Got internet this morning so time for a post.
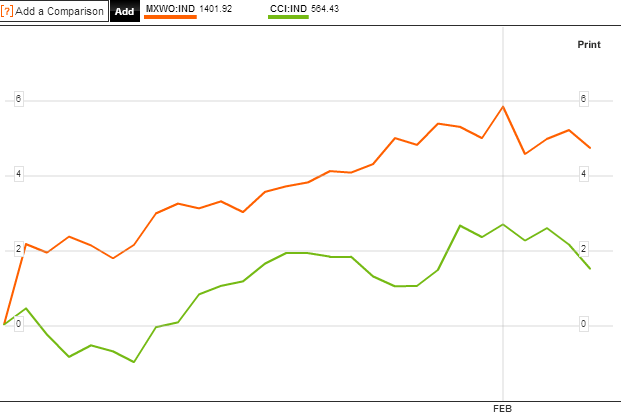
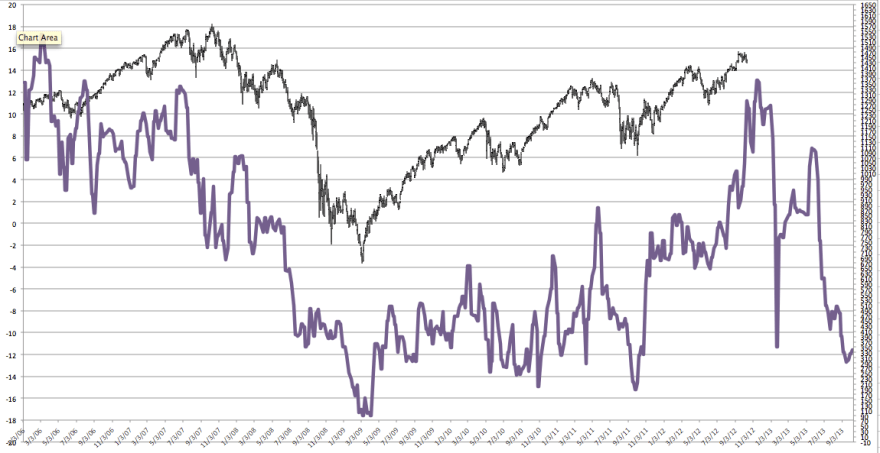
The chart below reveals that pro-risk (proxied by MSCI World Equities, Euro-USD, CCI equally weighted commodities index and 30 year treasury yields) made a correction throughout the month of March. Today Euro-USD and commodities have popped up – not captured yet in that chart – so I suggest the correction in pro-risk may now be over. Equities remain the leading class, and various indicies have broken out to new highs in the last two days, which cements the idea of the correction is done.
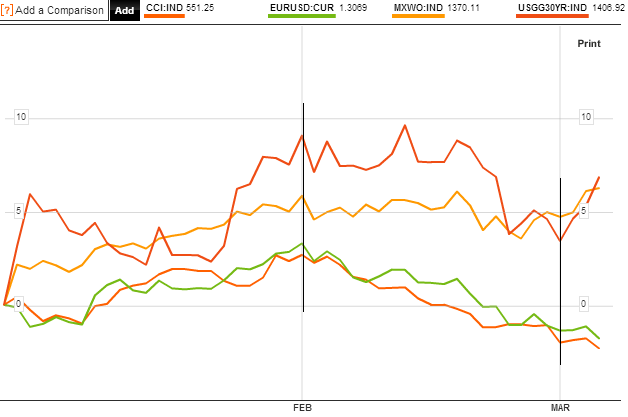 Source: Bloomberg
If you recall the 5 models in alignment, they projected a January swing top and a March swing bottom. If this is playing out, then the next and final top should be around June. With history as our guide, the stocks cyclical bull should end with a frothy overthrow, so the kind of sentiment and buying levels we are reading about should be expected. However, I am not sure whether stocks can keep pushing on from here until June. I originally targeted around 1600 for the SP500 to top out, and this was echoed in work by Laslo Birinyi and Barry Bannister. We are currently less than 4% away from that.
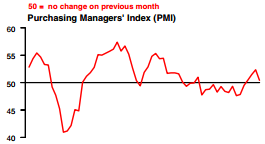
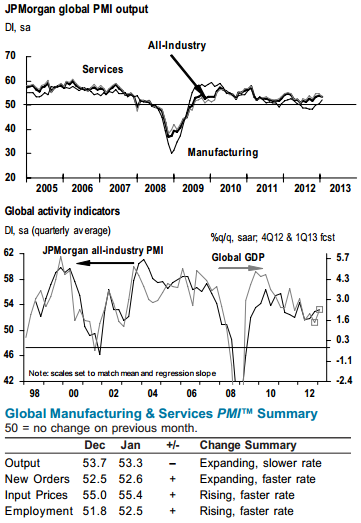
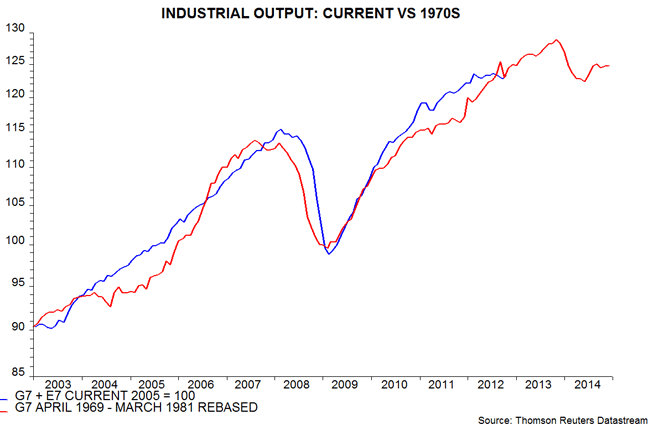
Again with history as our guide, we should see a topping process with weakening internals and negative divergences in leading indicators. In terms of leading indicators we don’t yet see this. The latest global PMI reading for combined services and manufacturing looks like this, still in expansion:
 Source: Markit / JP Morgan
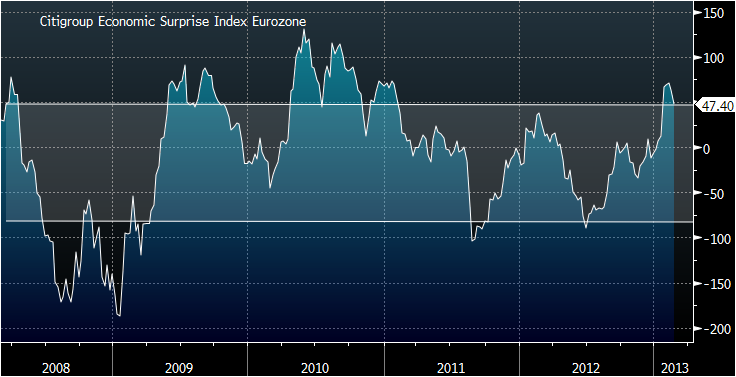
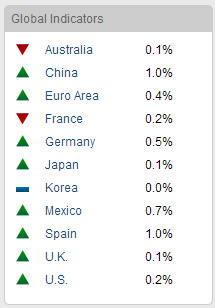
Citigroup economic surprises are back in the positive for the US. ECRI US leading indicators have weakend a little but remain in a strong positive uptrend. The last missing update in CB leading indicators was for Euroland which came in a positive and improved +1.0. So, right now, we have a backdrop for pro-risk to advance, but I am watching for evidence of trend changes in these indicators.
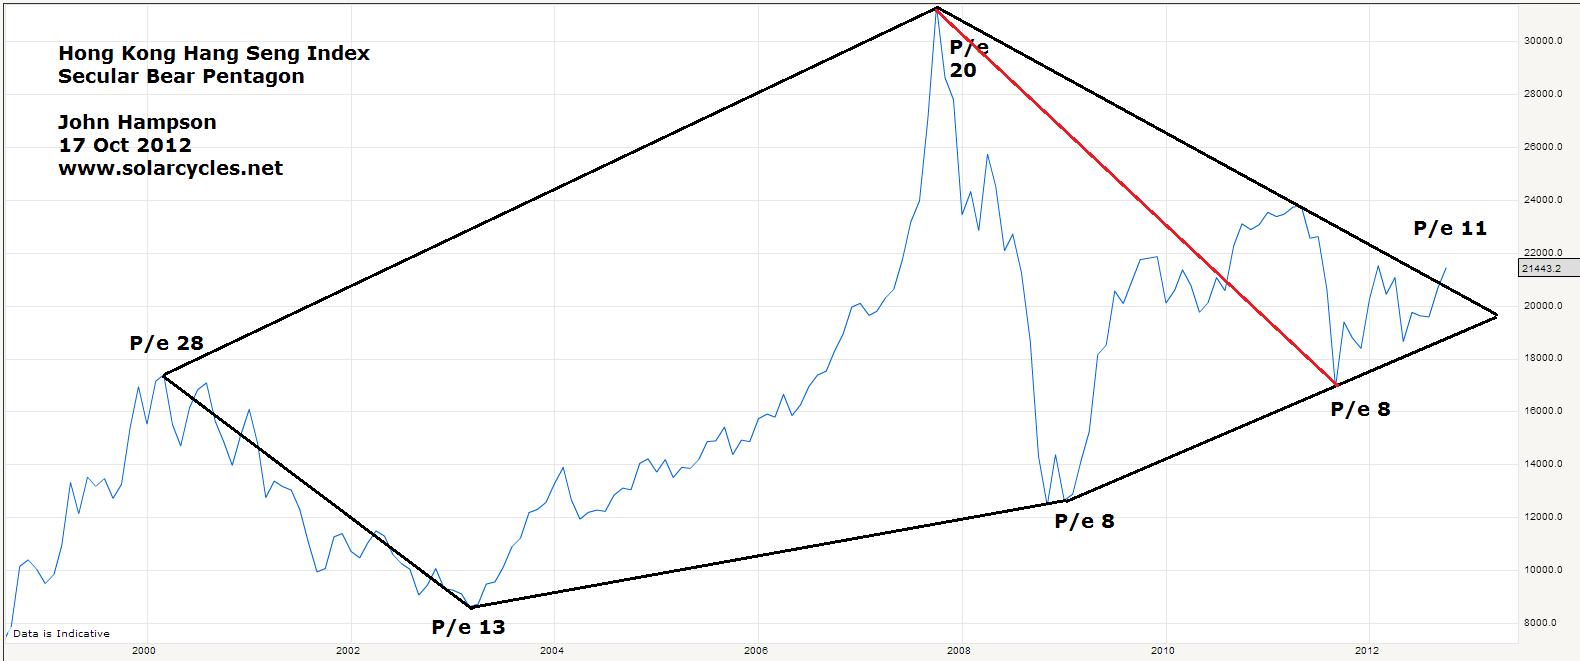
In terms of market internals, stock market breadth has overall been good and confirming. We need to see those internals weaken for greater likelihood of a top. It does not mean we cannot see a deeper pullback before a renewed attempt at a high – which then displays the weaker internals – in fact that would be the historic norm. So, I am not sure about the push on until June from here, without another correction. Supporting this we see a spike in the bullish percent over call/put indicator, which has been missing, which suggests US stocks should top out soon (Tom Demark predicts at 1567). We also see daily sentiment for the Nikkei index over 90 (out of 100) and it stands on that one precarious steep leg. Plus, Monday is the new moon, which has the potential to be a swing top. So, with this in mind, I have taken profits on my Nikkei positions this morning (NZ time) and left my other stock indices positions in tact. Back in October 2012 I wrote about how cheap the Nikkei was and bought for an average of around 8700 (see here). That trade has returned 40%:

I believe the Nikkei has entered a new secular bull, after a 19 year cycle from nominal top to nominal low, but that this steep single leg up needs to become a more stable ‘W’ with a retracement, a higher low and then a push on again.
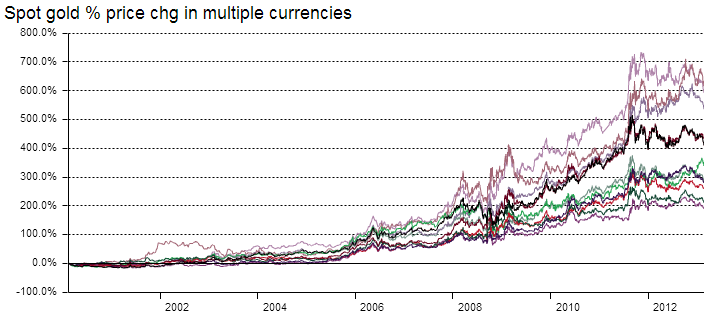
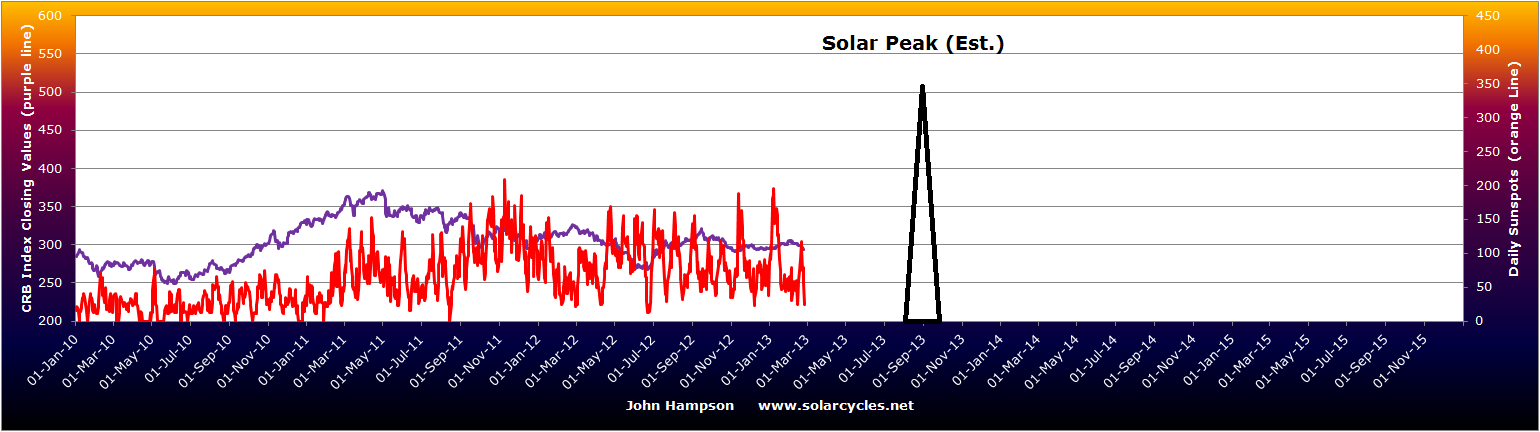
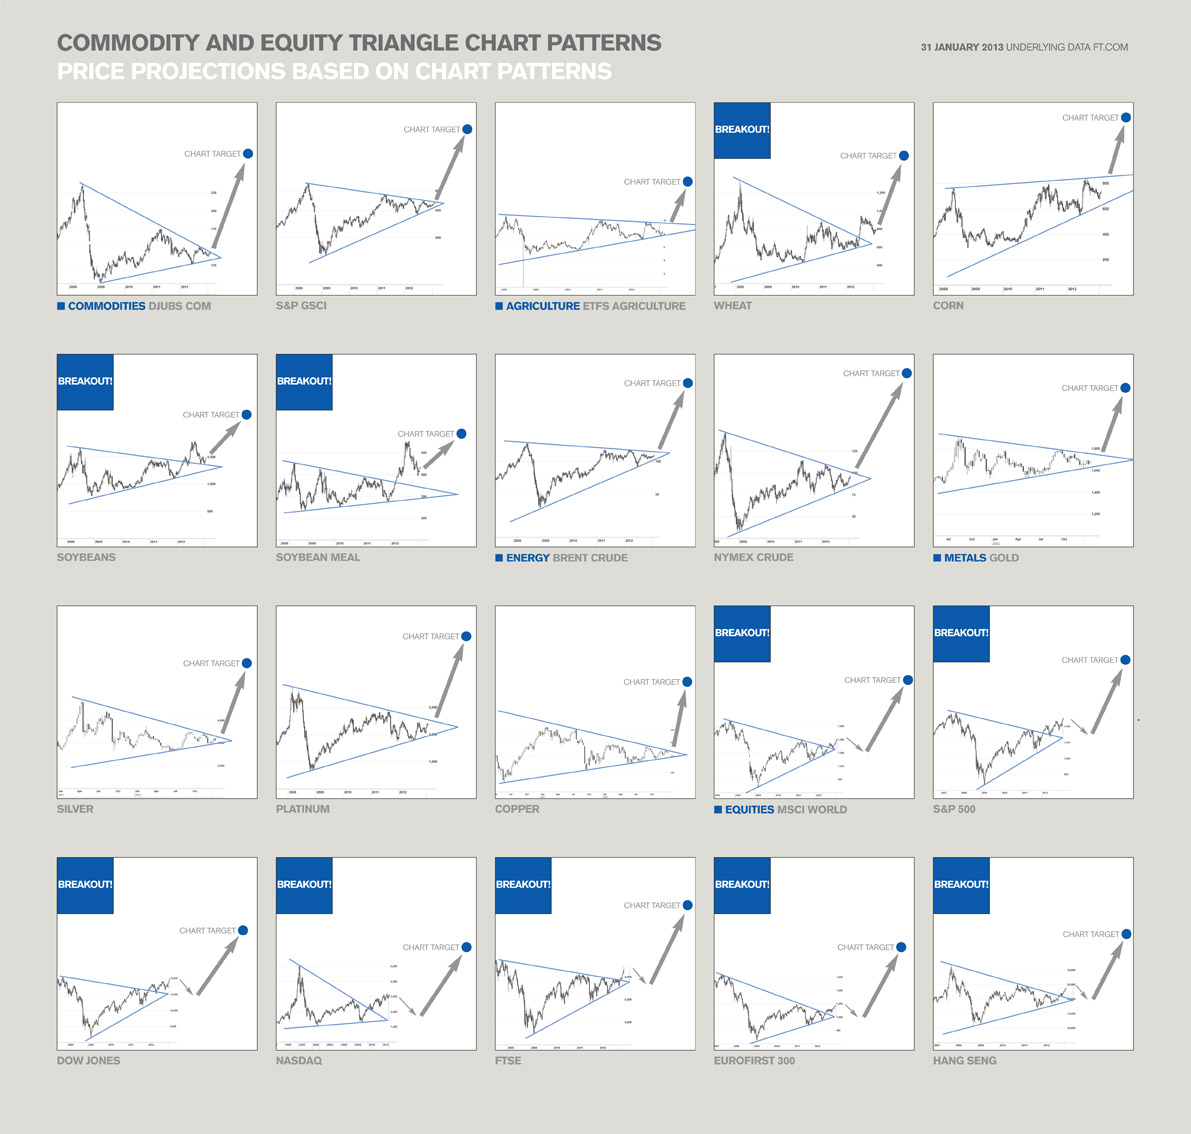
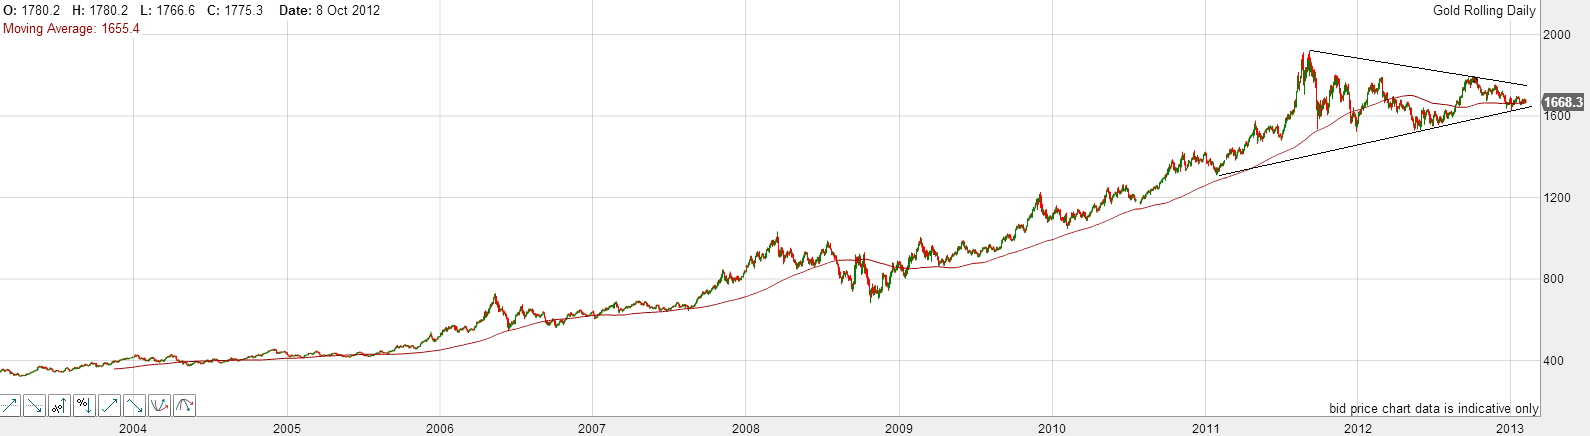
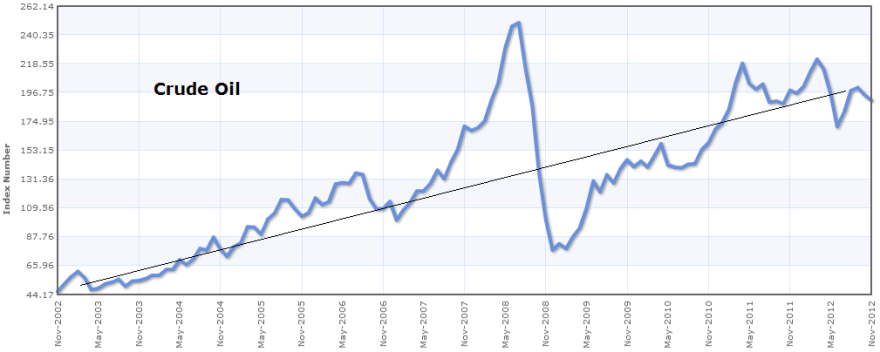
Commodities, as a whole, are in a different place, with sugar, coffee, precious metals, wheat, orange juice and others suffering bearish sentiment and low buying interest. However, most of those are now back to important support levels, which combined with the contrarian sentiment readings, provide a good base to rally. And so we return to the guide of solar/secular history, which suggests commodities should now take over as the outperforming class, and while equities process a top, commodities go make their secular finale. This, as you know, is subject to the solar peak timing being correct, and we still do not have decisive evidence on this, so I continue to watch sunspots.
Danny pointed out the change in IPA solar peak forecast. I now understand they are using the SIDC methodology, so it doesn’t amount to a different forecast. Here is a summary then of the solar peak projections:
NASA: Fall/Autmun 2013
NOAA: May 2013
SIBET: Sept/Oct 2013
SIDC: Either Fall/Autumn 2013 or it occurred already in Jan/Feb 2012
Polar reversal method: Q1 2013
The consensus therefore remains that it should be taking place ahead this year – and so it remains that a daily sunspot count over 200 would help sure up that likelihood. Therefore, that scenario remains my favoured and I am positioned for it, but until the alternative secnario is weakened, I am not taking on further commodities positions, despite some very attractive current plays.
TheDarkLord referred to the possibility of a twin peak, based on the similarity to solar cycle 14. I covered this last year, when the parallel was already being floated – see here. You can see in the charts on that link that SC14 was essentially a flat top as well as a twin peak, but note that the smoothed solar peak and the secular asset peak both occurred at the front peak – in fact they happened both dead on Feb 1906. So, it is the smoothed peak forecasts, as compiled above, that are key. That said, I have previously shown that there should be an echo commodities peak (a lower peak) a couple of years later, which could tie in with a second solar peak. However, I have also previously shown that by that point, being in equities is the place to be, returning better than commodities. Therefore, it does not change my strategy: assuming the consensus solar peak is correct and ahead, commodities should make their secular peak in the months following it, then I wish to exit commodities and target equities.
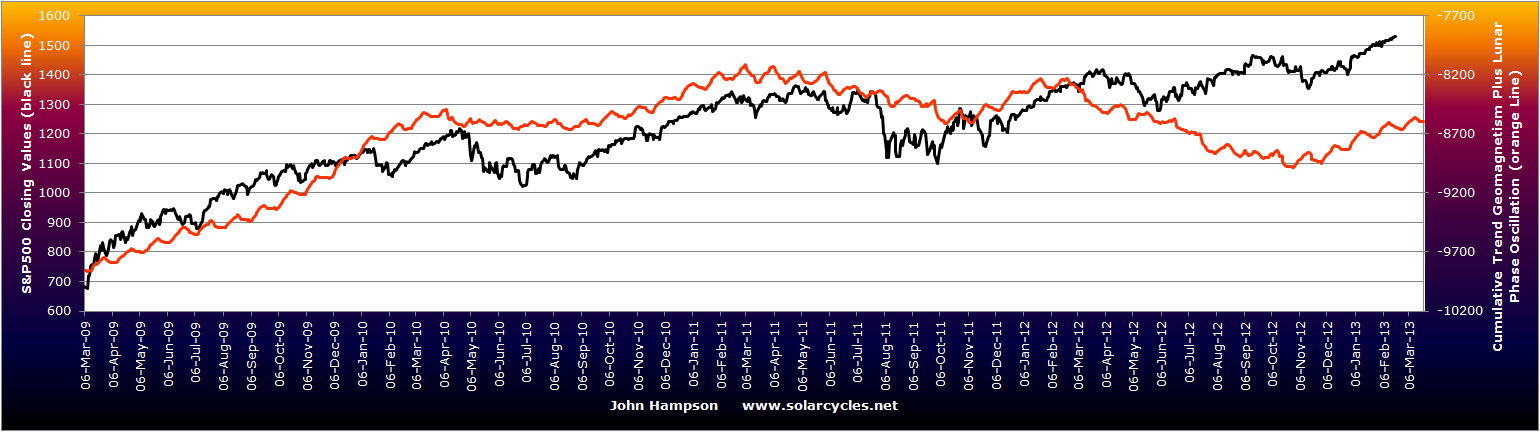
I have not been able to update the models this week, but will do so next week. The key points are that the new moon takes place on Monday, the geomagnetism model has weakened slightly (geomagnetism should start to seasonally worsen here) and sunspots are back up around the 100 zone.