

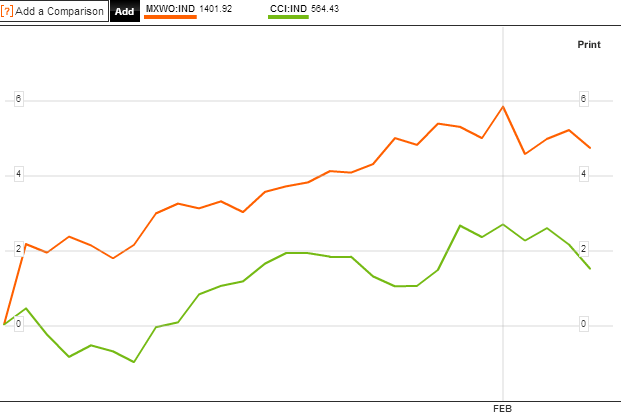
Mixed fortunes within asset classes heading into the weekend, but a summary chart below showing MSCI world equities and the CCI equally weighted commodities index reveals a general pullback began at the turn of February, which could mean the January swing top predicted by the 5 models in alignment could still be validated.
 Source: Bloomberg
Treasury yields also peaked at the same time, the turn of February, adding to the case.
If we look solely at US stock indices, however, it would appear that they just broke upwards out of a range on Friday, which is normally technically bullish. However, the Dax made a similar range breakout in late January only to then reversed it, and there are some clues that the same could occur here, such as the Vix divergence below:
 Source: Cobra / Stockcharts
US earnings, so far coming in at a 64% beat rate coupled with a 63% revenue beat rate, have been providing a tailwind. However, economic surprises have been weakening, and also suggest a pullback should occur:
 Note how surprises have turned negative, and that the last two times that occurred, equities made a swing top.
We also see some frothiness extremes in certain sentiment readings for US equities and also in equity fund flows. In short, I see more reasons for US equities to turn down here and pullback, rather than fulfill their breakout, and so join other pro-risk in consolidation or correction. I maintain that any pullback will be followed by a return to the highs and likely a higher high, which will mark a cyclical top if accompanied by negative divergences in breadth, leading indicators and so on, likely by mid-year 2013.
In terms of leading indicators, the global picture is still fairly healthy. Here is the latest combined global PMI (manufacturing and services) reading:
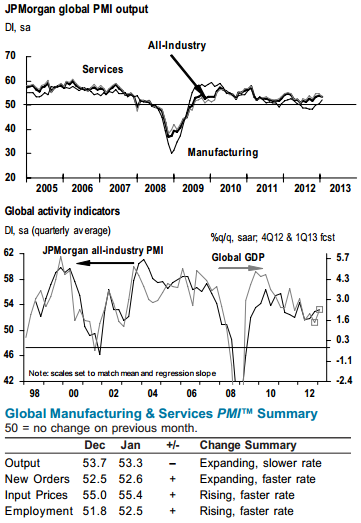 Source: Markit / JP Morgan
To add to that, ECRI’s leading indicators for the US also show strength:
 Source: Dshort / ECRI
Copper, which is generally a bellweather for the global economy, may have broken out:
 Source: Kitco
Which brings me to a chart provided by Rob Bowden showing many commodities may be poised for such upward thrust out of large triangles, with equities largely having broken out.
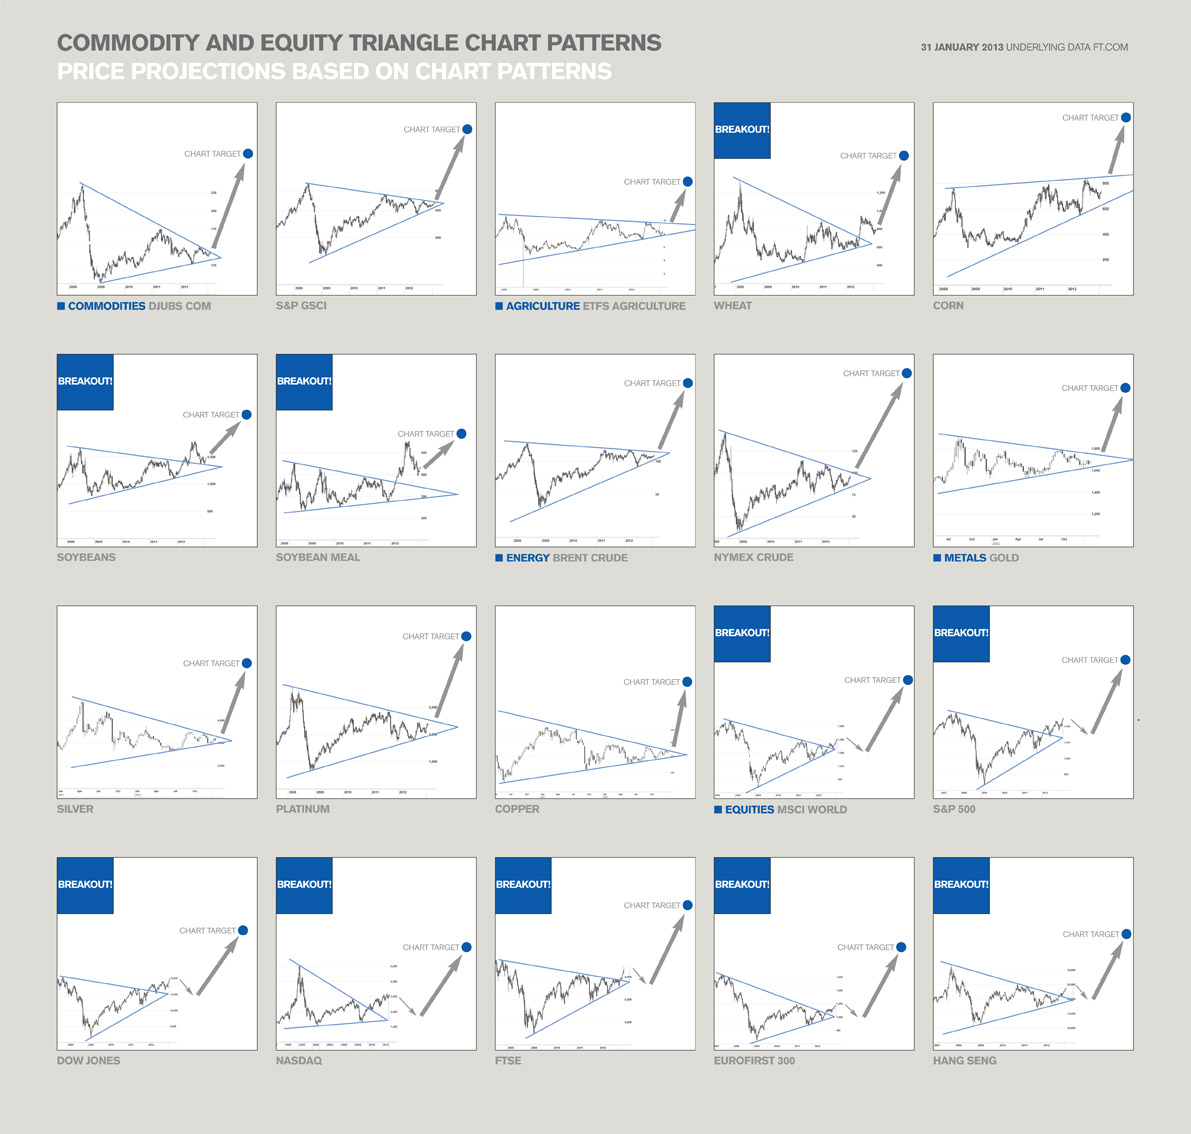
Source: Rob Bowden
There are no guarantees commodities can break out here but the scenarios shown would largely reflect my own views – equities pull back to the nose in a final shallow cyclical bear, and commodities make a secular finale acceleration up and out.
The caveat would be if my primary scenario is incorrect (secular commodities peak and solar peak ahead), and the alternative scenario is correct (secular commodities peak and solar peak passed). NASA’s updated forecast this month continues to point to a solar peak circa September 2013, and I maintain that the probability lies with the primary scenario for now. One or the other is likely to be validated soon by action in gold, which remains tantalisingly undecided, shown here:
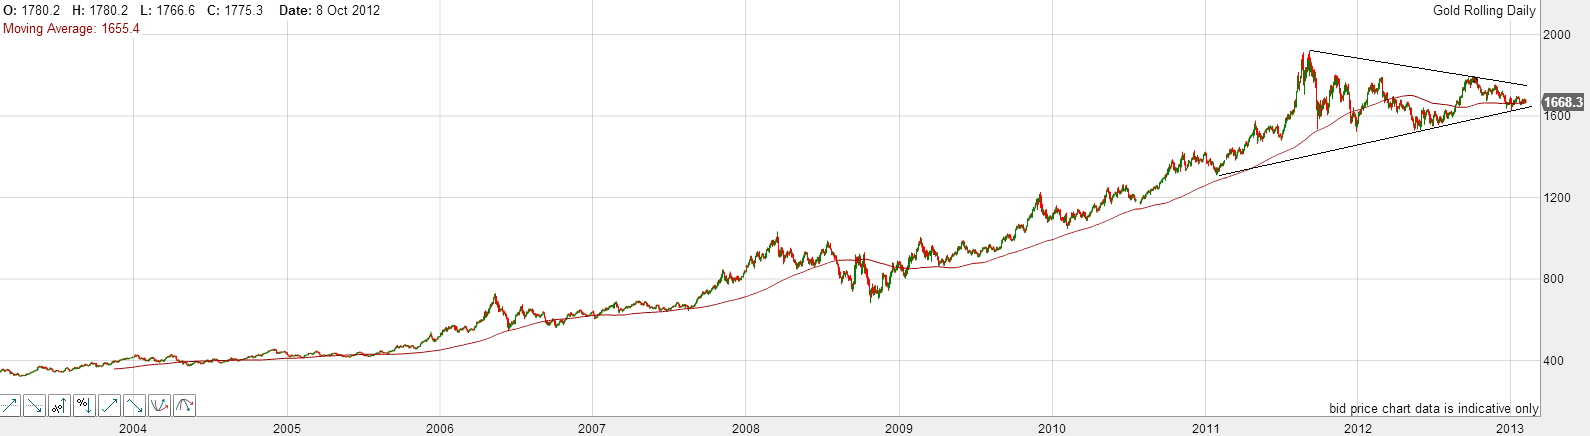
Into the nose of the triangle, it remains above the 200MA, which has largely supported the secular bull, but it remains perilously close to dropping out of the triangle and beneath that key MA. Sentiment is fairly depressed for both gold and gold miners which should be fuel for an up-move. But I do wonder whether we might see a lunge to the downside to flush out weak hands before an upwards break. We’ll see.
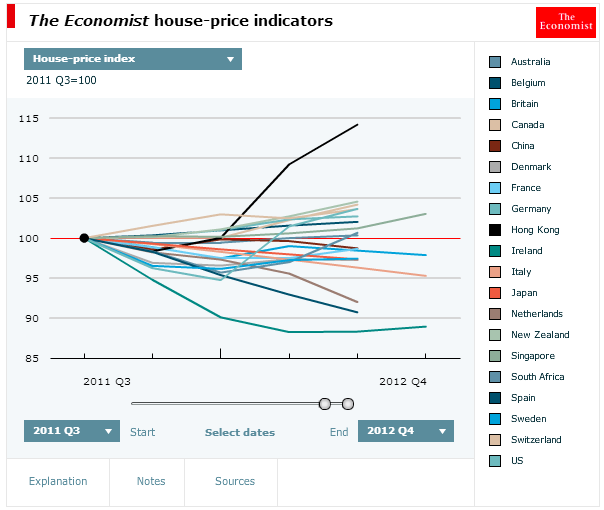
Lastly, here is a summary of global house prices. It’s a busy graphic but the overall theme is that in late 2011 and early 2012 we saw what appears to be a turning point for global real estate, with a pick up since then in markets such as Hong Kong, US, Switzerland, South Africa, New Zealand and Canada. Various European countries remain in downtrends but may turn out to be the laggards in a change in trend.
 This would fit with an overall transition from K-winter to K-spring. A bottoming out in real estate and a new secular equities bull emerging in due course. One last push in commodities, before money begins a secular move out of treasury bonds and commodities and into equities and real estate.

Whenever I see Triangle patterns forming , I always think of this…
http://www.thepatternsite.com/TrendChanges.html
Downside break possible of course
I would add an indicator of Monthly/Weekly Fed Money Printing as well as general S&P cyclicals i.e. Feb is weaker then we rally to summer… When unemployment hits 6.5% this year and the fed goes ops then I think we get the top. i.e. September sun spot peak.
Also the VIX gets sticky in a bull market i.e. the gas to the pedal so if we get a bull market like in 2003 then the VIX is quite useless as all oscillators. Important to know when the oscillator works or when the trend sets in. Hard to know when =(
Agree, it’s tricky. Let’s see if that divergence means anything or whether it’s in for a prolonged period of low reading.
I am grain trader and believe we are due for a spectacular rally in grains this summer. The USDA number continue to under report demand and over report supply as to not create panic. Old crop corn and soybean supplies are at 5.5 and 4.5% ending stocks to use ratios (historically some of the lowest ever recorded). If the Western grain belt does not get rain in the next 3-4 months you will have your incredible blow of top in grains.
Thanks Tom, good to hear
That Rob Bowden collection of charts is marvelous!
Hey, and your post ain’t half bad either. 😉
Thanks.
Cheers Highrev and thanks to Rob for providing.
Sold out of my remaining SP500 long position first thing Asian markets Mon morn, expecting the pullback in the US markets lagging the others. No other trade changes.
Now travelling down the coast from Sydney to Melbourne for the next week. Sydney = lovely.
Interesting upcoming week for Federal liquidity. The Fed Mbs and Rmbs will settle mid-month as usual, around $80 billion probably Tuesday through the following Wednesday. Note these large Mbs settlements will likely be mid-month throughout the year which means these liquidity injections will be going head-to-head against the new moon cycle.
The Mbs settlements may not have too much overall effect this week as the Treasury continues unusually high levels of borrowing, $99 billion in new issuance, $37 which settles Thursday and $72 billion Friday. Since the debt ceiling punt, the two weekly auction settlements have been on Thursday, both down days. Friday will be the only day of the month which doesn’t have a Pomo.
important pivot based om the tools i use
http://stockcharts.com/h-sc/ui?s=GDX&p=W&yr=1&mn=11&dy=0&id=p86062631675&a=265228379&r=1360679907737&cmd=print
Cheers