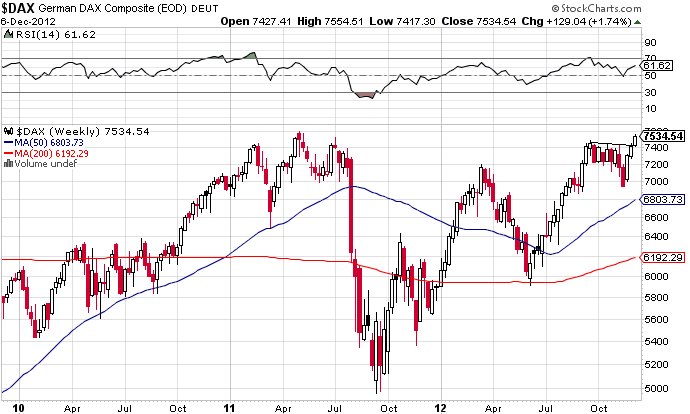
There has been some consolidation in pro-risk over the last few sessions, which is normal into today’s full moon. The correction overall has been minor, and the next two week period into the new moon is one of low-forecast geomagnetism. I believe therefore that subject to some last minute resolution or postponement of the fiscal cliff issue, pro-risk can now rally again. But how near are we to a cyclical bull market top in equities? In the last few weeks we have seen technical breakouts in the FTSE, Dax and Nikkei, to add to the recent Hang Seng breakout. Plus we have seen a compelling bottoming formation in the Shanghai Composite. None of that looks like a top. If there is a cyclical bull topping process occurring anywhere then the most likely would be the US markets, as they have pulled back from their highs and remain someway beneath, with tech (usually a leader) underperforming. It is possible that US markets could top first, leading the rest, so let’s take a look under the hood of the US markets.
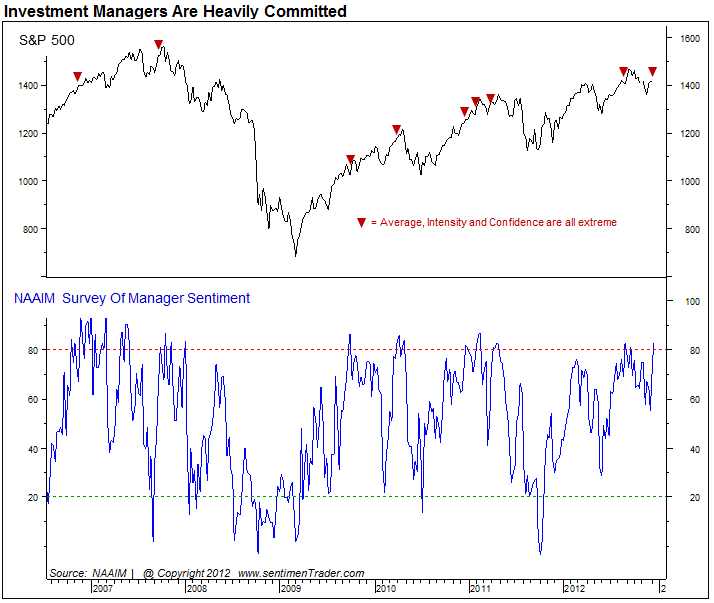
NAAIM sentiment is into the bullish extreme. That’s a caution, but note how we saw a congregation of such extremes in 2007 prior to the peak, i.e. we could be at the start of such a process rather than the sell point.
 Source: Sentimentrader
Investors Intelligence sentiment remains neutral – bullish, not into the extreme bullish zone. Bullish percent over call/put ratio remains very neutral:
 Source: Stockcharts
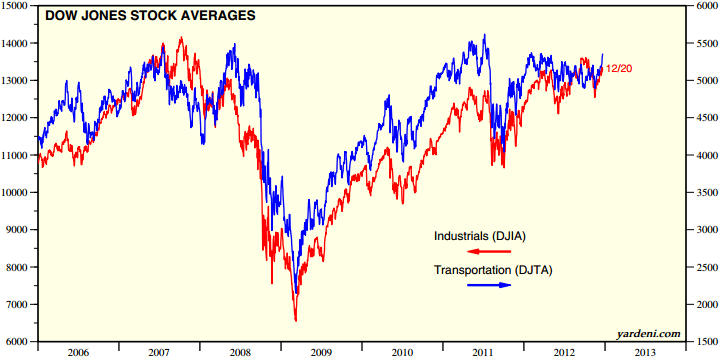
There is as yet no negative divergence in breadth as measured by advance-declines, shown below compared to 2007:

Source: Cobra / Stockcharts
Cyclical sectors continue to perform well overall, with the exception of technology. Below are four cyclical sectors versus the SP500. Note that in 2007, around half a year before the final peak, cyclical sectors started to underperform the index and defensives outperform. This is not what we see, bar tech.


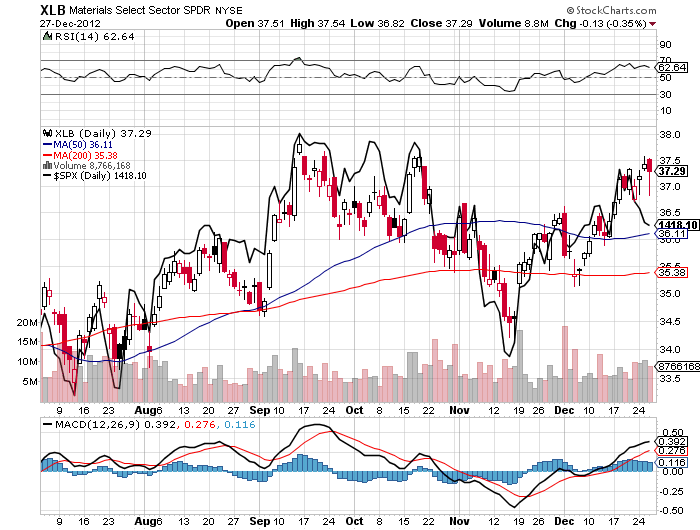
Source: Stockcharts
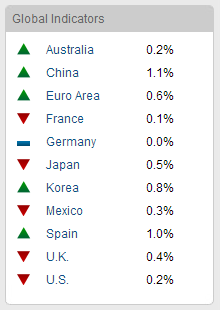
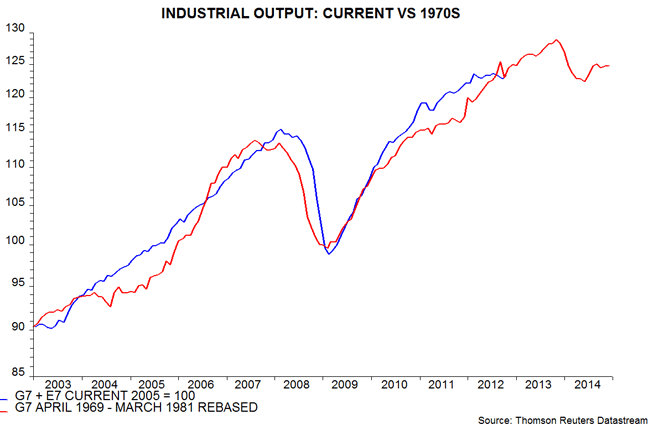
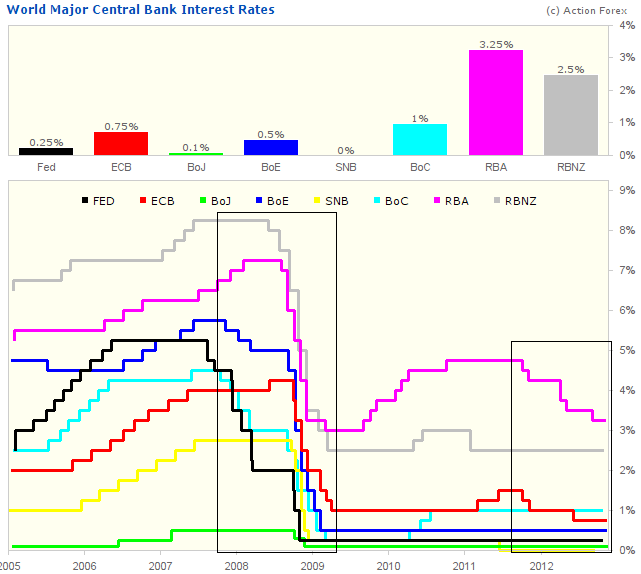
Economic surprises for the US remain in an uptrend, and ECRI leading indicators are positive and have been ticking up again the last 2 weeks. Global leading indicators remain mixed. Two PMI readings for Japan and Russia disappointed this week, with Russia falling to 5o (the dividing line between growth and contraction) and Japan languishing further negative.
Now take a look at this. Eurodollar COT 1 year in advance as a predictor of US equities, which I’ve referenced before. Whilst it has not been a perfect predictor, it is fairly compelling and points to a clear sharp downturn for equities as of the turn of the year.
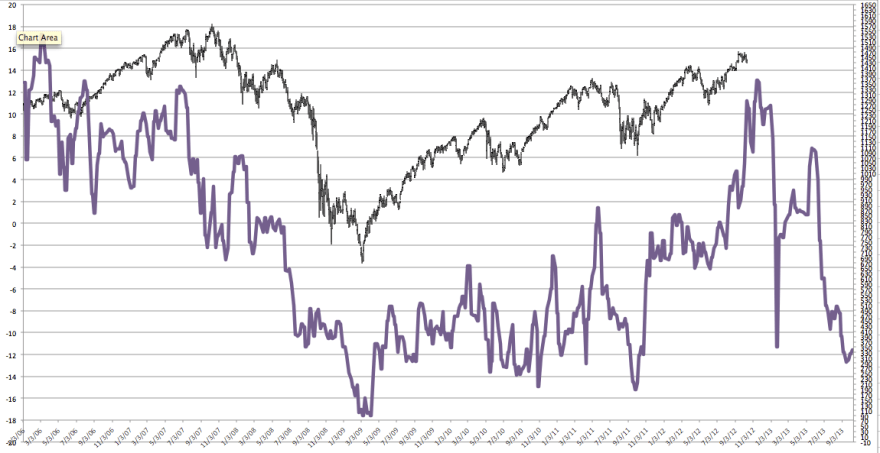
Source: Tradetrekker
And to that I will add Norwegian Jan’s chart of the Kitchin cycle, which also shows a significant fall is due.

Source: Jan Benestad
Eurodollar COT and Kitchin cycles are not part of my usual toolkit, so I am unsure how much weighting to give. But it’s a signal for caution at the least. So what might I do? Well, if I draw in other historic signals of a stock market top and forthcoming recession, there’s a less compelling case for a top here. Treasury yields are rising but not significantly yet, inflation is not yet accelerating, leading indicators are mixed but showing weak growth ahead rather than rolling over, and we don’t yet see generally in equities the topping process of a rangebound market with reversals of reversals of reversals lasting several months whilst internals decay. If that process has begun, then I would argue that we don’t yet see anywhere where that process is mature.
On the other hand, the Nikkei has rocketed to overbought levels, whilst the yen is at bearish sentiment extremes, plus the Aussie dollar is at the bullish extreme. Potentially a reversal in these assets could be ahead which could imply a wider move anti-risk, pro-safety. But as yet we do not see such significant sentiment extremes across wider pro-risk or safety that would make this more compelling.
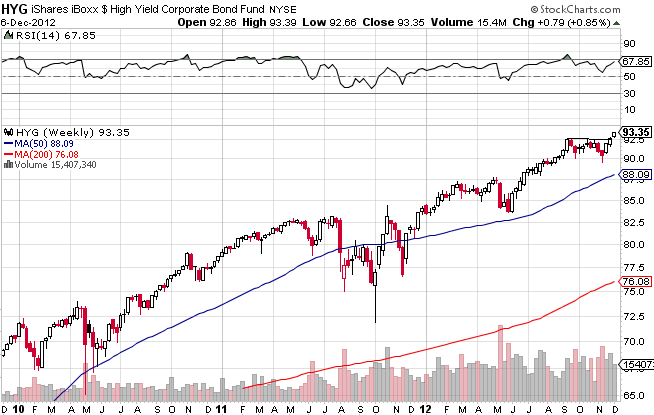
I continue to watch treasuries, which may have topped out, and if so outflows should find a home pro-risk. Flows into equities remain negative, as opposed to frothy, as shown by the chart below which measures flows into US equity funds. It captures the secular bull / bear cycle well.

Source: Pragcap
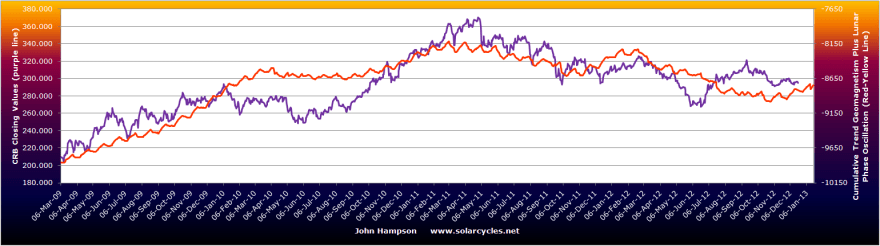
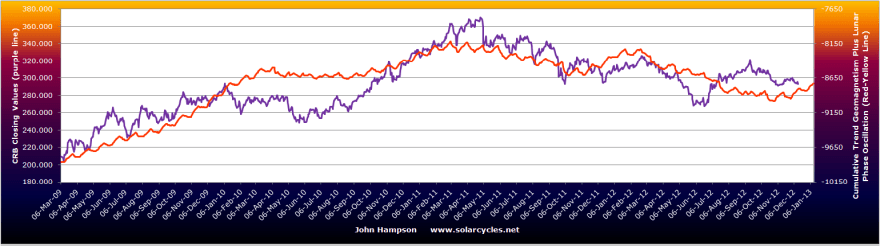
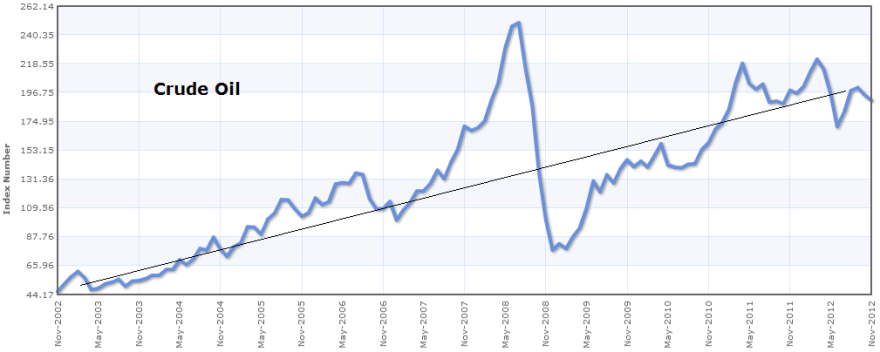
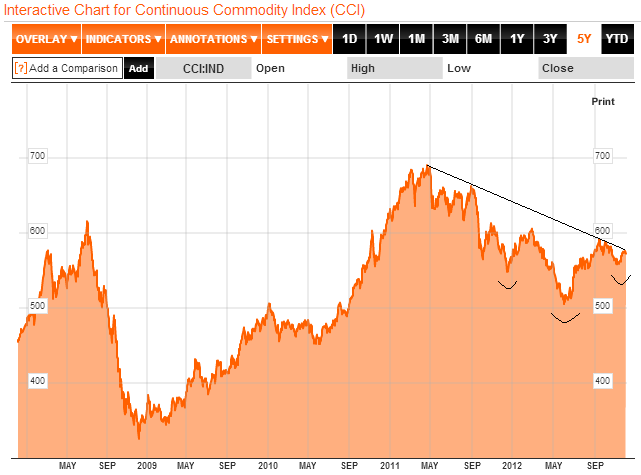
Tom DeMark predicts a 50% increase in Chinese shares over the next 9 months. Solar/secular history predicts a blow off top in commodities ahead in 2013/2014 with acceleration beginning now, and this is echoed by Gann. Leading indicators of leading indicators predict improvement in Q1 2013, the lag of central bank actions this year. If equities made a cyclical bull market top here and now, I’d find it hard to square all that. I would rather expect growthflation (particularly with growth in China) brings about a surge into pro-risk and out of treasuries, with equities making an overthrow top first before commodities make their parabolic secular finale.
Back to the near term, I continue to expect some kind of satisfaction to the fiscal cliff, even if just postponement, will bring about a rally. But there are no guarantees. A failure could sink equities, as we saw in the steep cliff-nerve related put of hours falls of last week. The meeting is set for Sunday, which means one of the two scenarios on Monday.
I’m now in Central Thailand for a week near Phitsanulok. I shall mull all this over and assess whether I want to act today in any way. Any input or thoughts from you guys of course welcome.