Bull Market Peak

US Stocks:dollar, stocks:bonds, junk bonds and volatility (inverted) all peaked out mid-2014 with the solar maximum.

24sepe1

Source: Stockcharts

Crude oil, put/call, breadth and bullish percent did likewise.

26sepe1

Sornette’s bubble end flagged then too.

Screen Shot 2015-09-24 at 20.18.51

Source: FinancialCrisisObservatory

Global business activity peaked out at the same time.

22sepe9

Source: Thenextrecession

And economic surprises.

24sepe12

Source: Not_Jim_Cramer

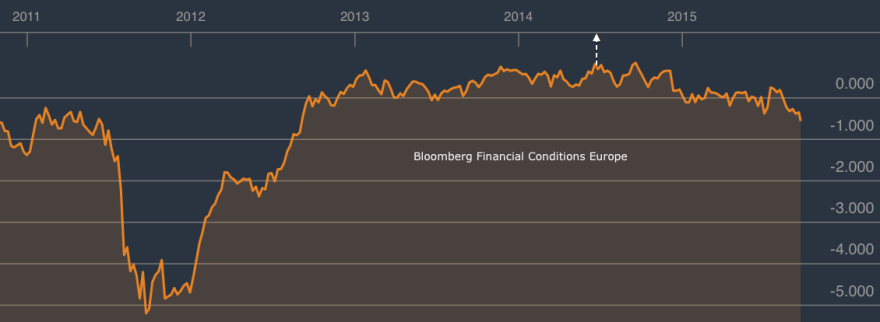
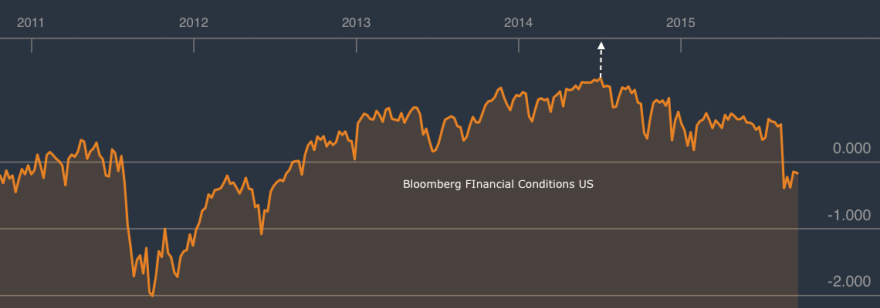
So did financial conditions, Europe and US.

Screen Shot 2015-09-22 at 20.28.53 Screen Shot 2015-09-22 at 20.27.06

Source: Bloomberg

And geomagnetism has played a key role in these developments, intensifying since mid-2014.

a3

With united demographic downtrends in the major nations, solar history suggests markets and economy should tumble down to the next solar minimum.

26sepe7

Source: NOAA

26sepe2

Source: Tarassov

Drawing demographics, solar cycles and valuation together we get this:

19sepe9

It fits all three and that’s what makes it fairly compelling.

The mid-2014 peak we see in many indicators and assets is unrecognised by most. They see the August 2015 drops as the first drop in a topping process or a wave 4 in EW, both meaning we head back up. But the drops into last October fit better with this, with a secondary and final peak then forming in May 2015. The nominal price action has been uniquely confusing in this major peak, but the clues are provided by those under the hood and cross asset indicators.

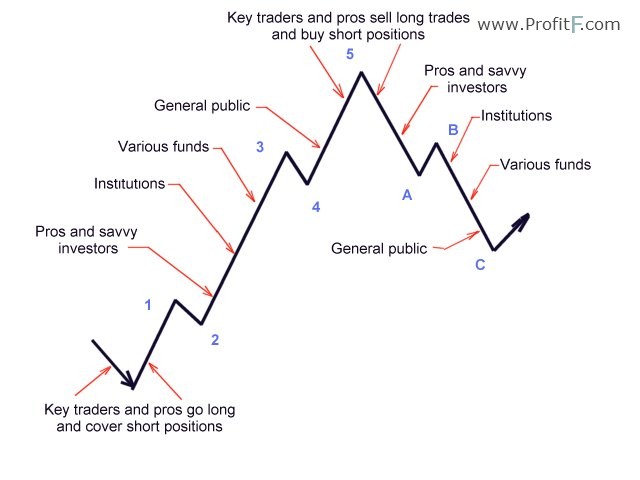
What resonates with me about Elliott Waves is the waves of mass crowd psychology. We see this phenomenon playing out in solar cycles, lunar oscillation, demographics and valuation. But the weakness of Elliott Waves is that on any chart at any time multiple different counts can be produced and are then refined with time to make the count always ‘right’ with hindsight. I simply don’t see evidence that Elliott Waves are reliable market predictors (emphasis on the reliable), but the general underlying idea is very much in play in overall price action, something like this:

22sepe3

Source: ProfitF

We all know an up trend rarely ends abruptly but instead typically peaks, reverses a while and next heads back up. Then, typically, the move either fails before the previous peak, double peaks with it, or makes a marginal higher high but on negative divergences, before the trend reversal takes off in earnest. All akin to turning a tanker at sea: it takes some time. Whatsmore, the last move up is typically the stage on which the retail money makes its usual late and painful act.

Between last July and this May we saw smart money flows weaken, dumb money indicators hit new highs, leverage jump to a new record and stock market internals notably diverge. All evidence of a wave 5, a secondary peak, or the terminal rally after the primary distribution, whatever you want to call it:

26sepe9

That second chance peak is now looking fairly potent on Biotech:

Screen Shot 2015-09-21 at 21.06.18The point is that topping processes share similar characteristics which reflect how humans work. A peak takes time to form with some back and forth, some telltale signs in those leaving early and those joining late, and some health warnings.

Finally, let’s recall that this has been the second biggest mania of all time, as measured by valuations, leverage, allocation and sentiment. The second major error analysts are currently making (to go with the failure to see the topping process began last July) is to see charts like this one as contrarian bullish:

Screen Shot 2015-09-26 at 07.29.22

Source: Yardeni

The jamming of the indicator at record highs last year highlights the mania that was in play. The subsequent crash is the mania bursting. The low reading is bearish, not bullish. It will take some time to recover, maybe even years. Given how ultra saturated the market was in terms of allocations, leverage and sentiment, it is unrealistic to think that the market will now go make new highs. Some of the dumb money was wiped out in the August falls, some more is selling on every move up to get out at break even.

The most bullish outcome is that the market gradually digests the falls and range trades whilst all the excesses of 2014 are gradually mopped up. But, there is no precedent for this in history. From 2014’s valuations, leverage, sentiment and allocations levels we have only seen devastating bear markets in the past. The post solar max and demographic environment add to this likelihood.

Gold looks to be completing its basing. Global stocks are now retesting their August lows. Clearly, if gold takes off here and stocks decisively break down beneath their August lows then the mood will properly change. The most bullish outcome I consider is that stocks range trade and recover some whilst the 200MA gradually arches over, as bear markets often aren’t in a rush, more of a slow bleed. However, written into the record leverage, is a period or periods of panic selling. Biotech is in an ideal technical set up for that to now occur. DAX and RUT look post second chance, which in past major peaks led to waterfall selling. So maybe we fall apart rapidly here – or, my bullish scenario – we hold up (without exceeding the highs) into the end of the year and fall apart in early 2016. Every man and his dog thinks that stocks are going to bottom out and resume bullish in October in line with seasonality so it seems likely that something else occurs. I think actual (rather than seasonal) geomagnetism is likely to play a role in this, so I am watching developments. I favour the falling apart option but you know my positions disclosure. Trades-wise I’ve been increasing shorts and adding to gold on the basing evidence, and adding stops to all of it. I’m going to carry on with this strategy unless the market bounces on positive divergences and shows evidence of a renewed move up for the bulls.

Short Term US Update

The breakout in equities is likely to become a fake-out or short final up leg, based on historical indicator patterns. Breadth and strength have negatively diverged:

26apri19Source: Stockcharts

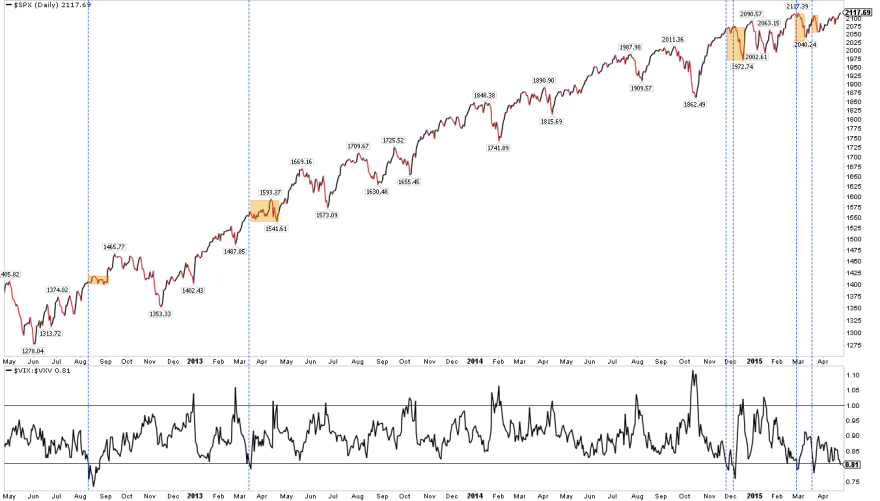
Volatility relativity also suggests a correction or consolidation should now come to pass:

26apri1Source: Fat-Pitch

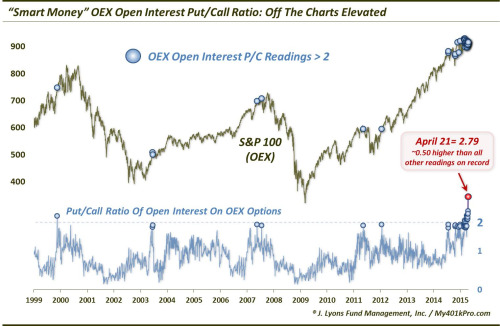
‘Smart money’ bearishness is off the scale:

26apri20Source: Dana Lyons

US economic data surprises remains deeply negative. Two updates from this week:

26apri10

Source: Sober Look

26apri5Source: Alhambra

Blended earnings for Q1 are so far better than expected: -2.8% versus -4.6%, but of course still shrinking. Blended revenues are worst than expected -3.5% versus -2.6%. ECRI leading indicators have improved but are still negative.

On the bullish side, leverage has been on the increase again.

26apri7Source: DShort

And real narrow money indicators point to economic improvement ahead.

26apri3Source: Moneymovesmarkets

There are two scenarios currently in my mind. My first and highest probability scenario is as per the first several charts above plus all the charts in my last post, namely that stocks are right at the end of a major topping process, and under the hood they already topped. That means last week’s apparent price breakout will quickly fail. I have smallish short Dow and long gold positions aligned to this, looking to build on reversal and momentum.

My secondary or outsider scenario is that US stocks have yet to join Chinese and German stock indices in a parabolic blow off ending pattern, fuelled by potential improvement in economic fortunes/prospects into summer-end. This would be similar to the lag of the Sep 1929 stocks max versus April 1928 solar max, a kind of maximum outsider in the historic range. Should this appear to be occurring I would step aside and continue to try to identify the top.

Ultimately, as things stand right now, I consider all the key supports for the bull have been removed. Earnings, economic data, smart money, allocations, sentiment, valuations, solar max, geomagnetism. We are left with dumb money on leverage, plus expectations that both the economy and earnings will recover in the remainder of 2015. We might consider the latter is key: whether data does improve again – and maybe it is. However, recall the evidence shows that the stock market leads the economy rather than the other way round. The wealth effect of the stock market. The question then is what will cause participants to pull the plug on equities? We are now in a phase of ultra-complacency where most traders can see nothing that would cause that to happen. Yet that ultra-complacency makes us at highest risk of the collapse.

A final chart: the collection of countries now paying negative returns on government bonds. Swiss 10-year bonds are amazingly now paying a guaranteed negative return. It should be clear that when money is being invested in a bond paying an assured loss for several years then it is because deflation, recession and relatively larger losses in other asset classes are expected. Either that, or investors are making a foolish mistake. So who has it right, stocks or bonds? Smart money flows, valuations, allocations and sentiment all continue to show the bubble is in stocks, not bonds. Bonds and commodities are accurately reflecting the harsh reality of current global demographics, trade, and economics, whilst equities have become a ponzi scheme divorced from fundamentals.

26apri12

Source: Emma Masterson


ZIRP vs Solar

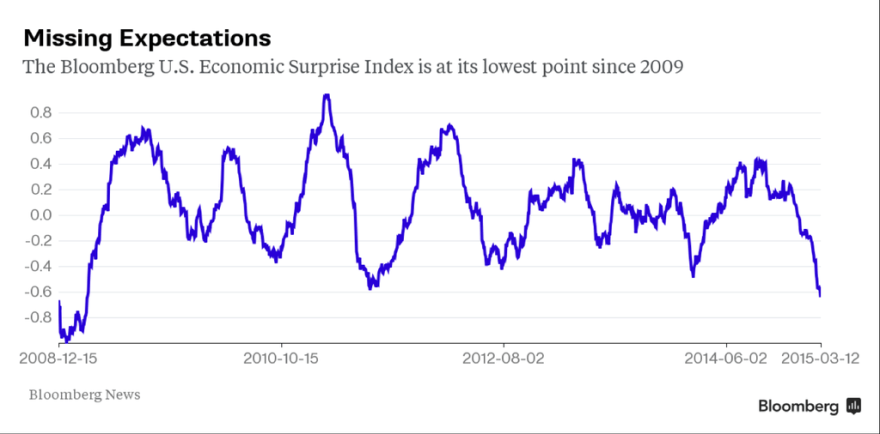
US economic surprises are now at their worst level since 2009:

15marc8Source: Bloomberg / Jessie Felder

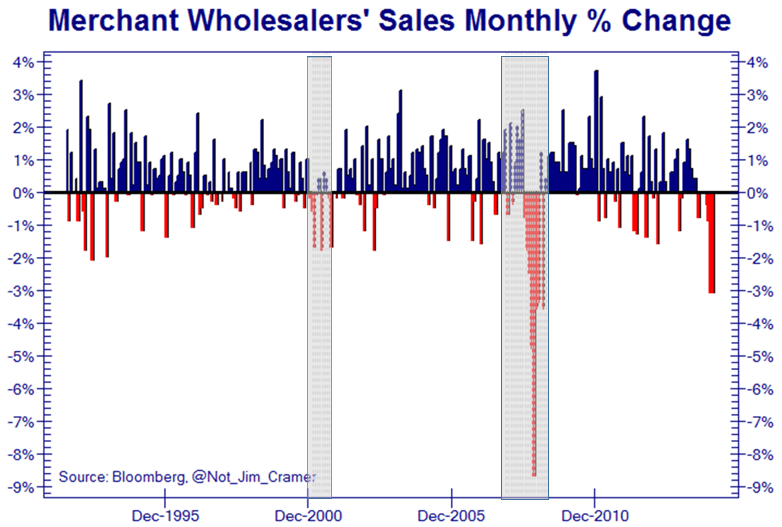
A trio of such bad data releases are charted here: retail sales, wholesale sales and rail traffic:

15marc3
14marc4Source: Not_Jim_Cramer

15marc11

Source: Callum Roche

They are all recessionary. But Charlie Bilello hypothesises that the pattern in economic surprises over recent years could be inspiring stock market participants to hold through:

15marc1

Source: Charlie Bilello

That pattern is a bit of a mystery and could suggest problems with the Citigroup calculation. Regardless, our positioning post-solar maximum should spell recession, no recovery this time:

Screen Shot 2015-03-15 at 06.44.11

(my chart)

The picture is similar for earnings. Forecasts for the near future are negative, yet further out participants expect earnings to recover dramatically again:

15marc30

Source: Charlie Bilello

As things stand, the estimated earnings decline for Q1 is -4.9% which is the largest drop since 2009, and the bigger picture for declining EPS is shown here:

15marc2Again this would be consistent with a bear market and recession, unless that dramatic recovery later in the year is to take place.

Solar theory argues that we see a speculative bubble into the sunspot maximum, which then pops post solar peak. People unwittingly buy and speculate both in the economy and financial markets into the smoothed solar maximum, and then do the opposite once the sun’s activity starts to wane.

There is some argument that government bonds are in a bubble, given their long bull market and ultra low yields. However, a look at household and fund manager allocations reveals the bubble to be in equities not bonds:

15marc21 15marc9 15marc61marc4Source: Fat-Pitch

And the bubble in stocks becomes clear when we consider valuations, sentiment, dumb money flows, leverage, and more.

Commodities may have undergone recent falls but they were not in a bubble leading into the solar peak.   Real estate has recovered some in the last several years, but does not show bubble characteristics. Sentiment and allocation to bonds has remain depressed throughout. Cash allocations are at low levels.

A common argument is that ZIRP encourages money into equities. Bonds and cash are returning nothing. At least some yield can be found in stocks.
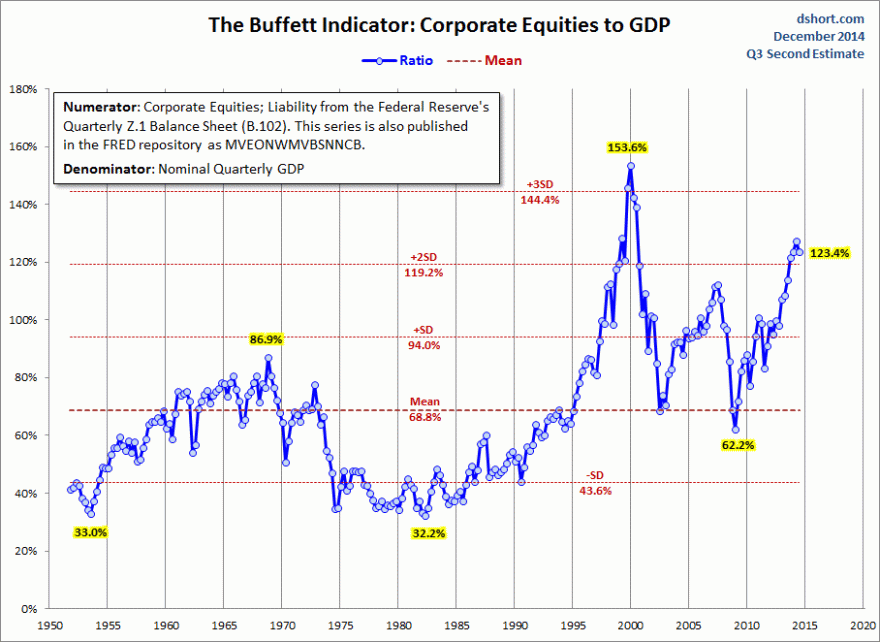
Perhaps this explains why sentiment, allocations, valuations and leverage have remained at ‘saturation’ levels. Money has flowed in to maximum levels, producing common bubble characteristics, but money hasn’t flowed out the other way whilst ZIRP persists. The shallow corrections in equities have swiftly seen those measures topped back up to full.

Which brings us to this week’s FOMC. As things stand, analysts expect rate rises to start in several months time. Yet economic data of late has been fairly dire, which means the Fed may play safe and delay. If the Fed now resets expectations for rate rises (to start later) then will the correction of the last 2 weeks in equities be swiftly brought to an end and stocks rally to new highs on all-in measures again? I consider it a key test of whether ZIRP is the main driver.

It’s a test I expect to fail as I don’t believe it. I maintain the driver is the solar maximum, and that we see a range of evidence that speculation and the economy did indeed peak around the mid-year 2014 smoothed solar max. Even central bank balance sheet expansions topped out around then, as they too are subjects of the sun:

15marc15Source: Chris Carolan

Stocks:dollar continues to show a clear peak at that time:

15marc32

Source: Stockcharts

The negative divergences in volatility, junk bonds and breadth remain in place since then:

15marc40

Source: Stockcharts

All this should mean we are at the end of a topping process.

But how do we square this with action in the Dax and Eurozone indices? I suggest as a function of the sharply declining Euro:

15marc20

Remember the Euro was traditionally seen as risk-on? Hence the Dax and Euro largely moving in the same direction pre-mid-2014. But then, post solar max, things changed and remain changed.

Flipping back to the US, insider selling has leapt to a major warning level:

15marc10

Source: Bloomberg / Nautilus 

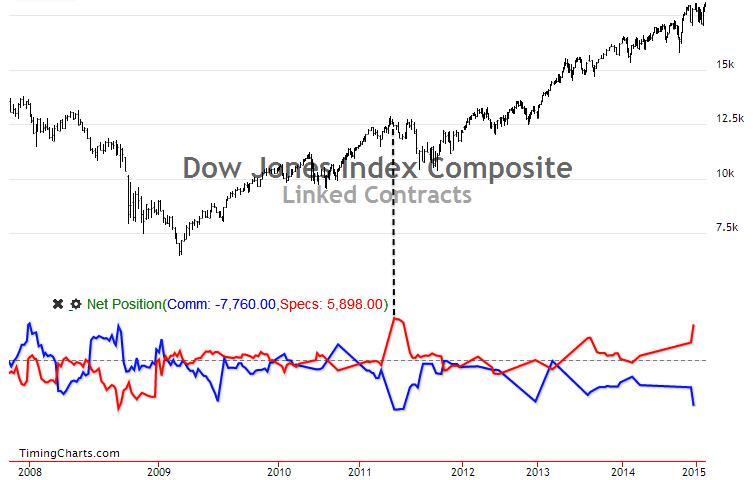
If we combine that with the commercial positioning, maybe the market can finally roll over here.

8marc5


Source: Timing Charts

The Euro-dollar remains set for a significant reversal (positioning, sentiment, oversold/bought). Maybe then we can see a sell-off in US stocks and out of the US dollar occurring together: a contra-US move reflective of the current relative economic and valuation divergences. Just a guess.

By geomagnetic seasonality I still have my eyes on a March/April bottom, but this would be a significant low. This would imply a sharp sell-off erupts out of the initial falls of the last two weeks. Should that not occur then the case would build for the markets not properly rolling over until mid-year, and that would still not be inconsistent with the insider/commercials charts above (markets peaked but then took some time to roll over).

Select indicators hit washout levels by the end of last week, but the majority not. However, that keeps options open into the FOMC.

In the bigger picture, this is what I see: valuations, sentiment, leverage and allocations have been flagging a top for some time. Insider selling and commercial positions now join them. Various measures and indicators show peaks mid-year 2014 at the solar max and remain in divergences since. Earnings and economic data (concurrent and leading) have turned negative and Fed balance sheet expansion drawn to a close. If the solar theory is correct then earnings and economic data won’t come back here, and the realisation of this will finally see the scramble for the exits. Based on history a crash is already written in the leverage and highly skewed exposure and sentiment. Set against all this, central banks largely still continue to ease and keep conditions favourable for speculation. The outcome will be extremely telling.

3 Exact Dates

As we wait for the ECB decision and market reaction, I see 3 exact dates being revealed that align with my ‘triple confluence peaks’ idea, i.e. we are seeing major market peaks form at the new moons closest to the geomagnetic seasonal highs (inverted) closest to the smoothed solar maximum.

The smoothed solar max is likely to have been around April 2014.

22janu14

The seasonal peaks (inverted geomagnetism) fall at the turn of the year and mid-year.

22janu1

The new moons closest to these seasonal peaks were 1 January 2014, 27 June 2014 and 22 December 2014, so it follows that we should see major speculation peaks at these dates in the year of the solar maximum, 2014.

Bullish percent to call/put, cyclicals to defensives, high yield to treasuries and small cap equities to bonds all peaked very close to the 1 January 2014 date.

22janu2Stocks:dollar, stocks:bonds, FTSE Eurostox and NYSE composite indices, NSYE breadth, volatility and junk:treasury bonds, oil, US dollar (inverted), leveraged loans and junk bonds all peaked very close to the 27 June 2014 date.

22janu7 22janu5

22janu3

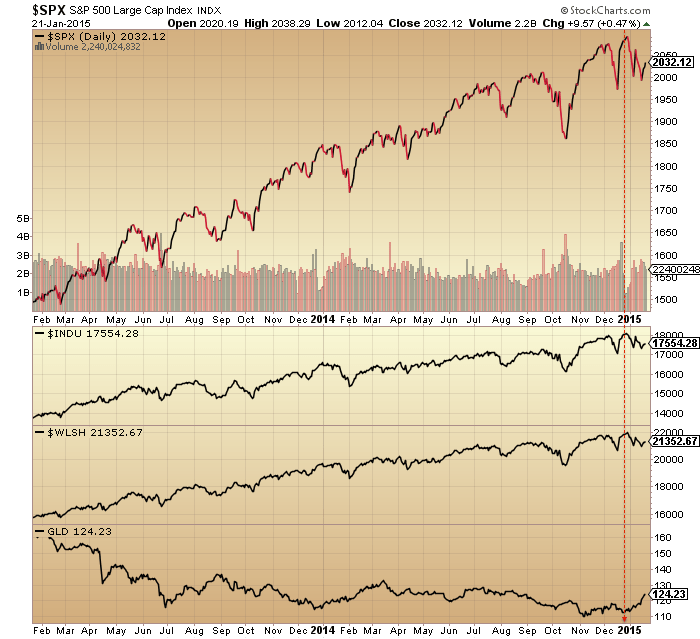
The final date, 22 December, has tentatively topped out the remaining key indices and speculation measures, namely SP500, Dow and Wilshire 5000 (plus an associated bottom in gold) and a blow-off top in sentiment and allocations.

22janu4 22janu6If this ‘dumb’ model of the markets is correct then we should make no new highs from here but rather collapse to a March/April initial bear market bottom (first leg down).

If an anomaly is at hand and the solar max is still ahead or speculation somehow extends further in time, then the next logical peak would be mid-year 2015, likely June 16. However, I rate this possibility as negligible. Look again at the risk measures that changed course Jan 1 2014: they remain in downtrends ever since. Add to these the large range of assets and indicators that peaked June 27 and remain in downtrends ever since too. Then consider the change in market and cross-asset behaviour since the final date, Dec 22, together with that capitulation in sentiment and allocations. This has to be game over, in my opinion. However, if we consider it a game in which central banks can cheat and change the rules, then maybe, just maybe, natural forces can less freely flow through the markets. I don’t think this is likely as central bank members are solar subjects too. However, this is subject to confirmation in a critical real time test in 2014-2015. Market reaction over the next few days to the ECB announcement will be a key tell.


Saturday Markets Update

Stocks ended the week on some buying. We are approaching this coming Tuesday’s new moon and Thursday’s ECB meeting, at which we should expect some kind of QE or new programme of action, given the Swiss central bank’s pre-emptive action this week. Therefore, I expect a little more strength in the first half of this coming week and then a sell-the-news resumption of the equities downtrend, which ought to be the definitive breakdown in stocks, as we head into the geomagnetic low of March/April.

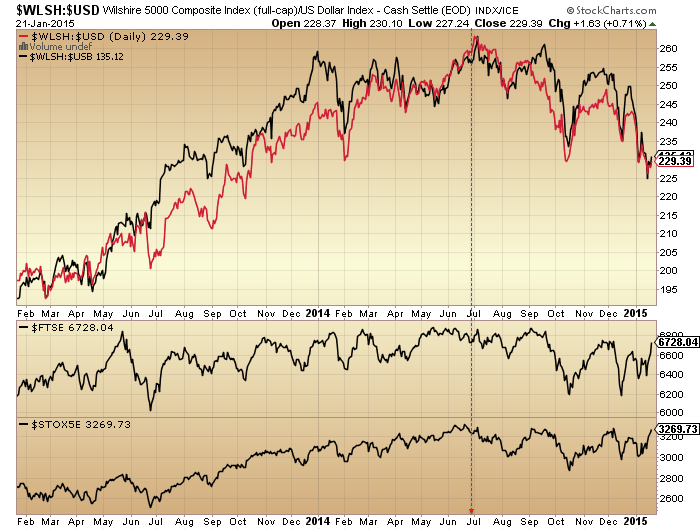
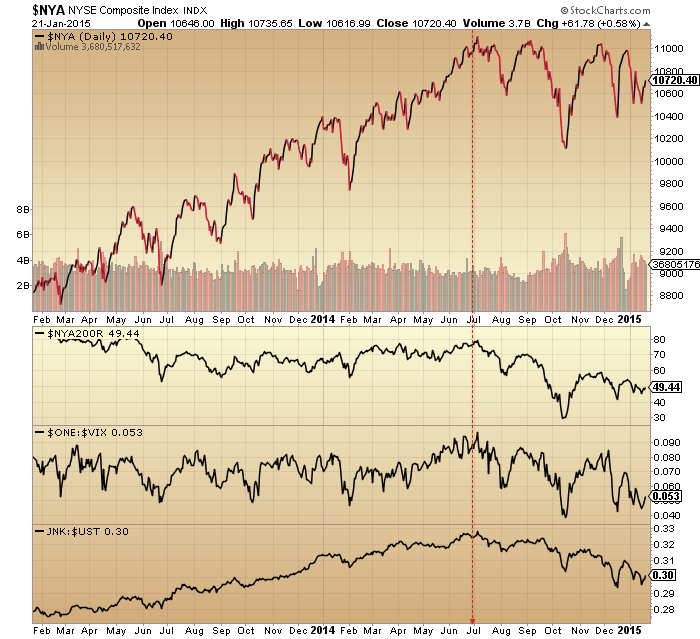
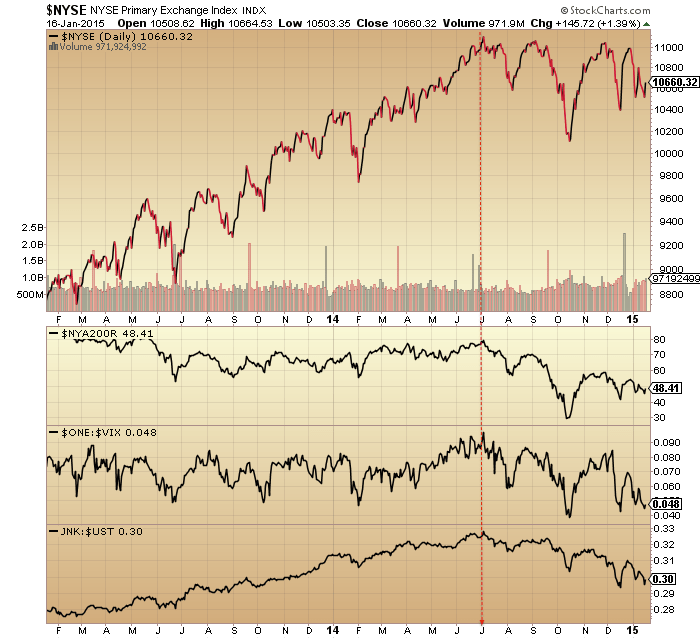
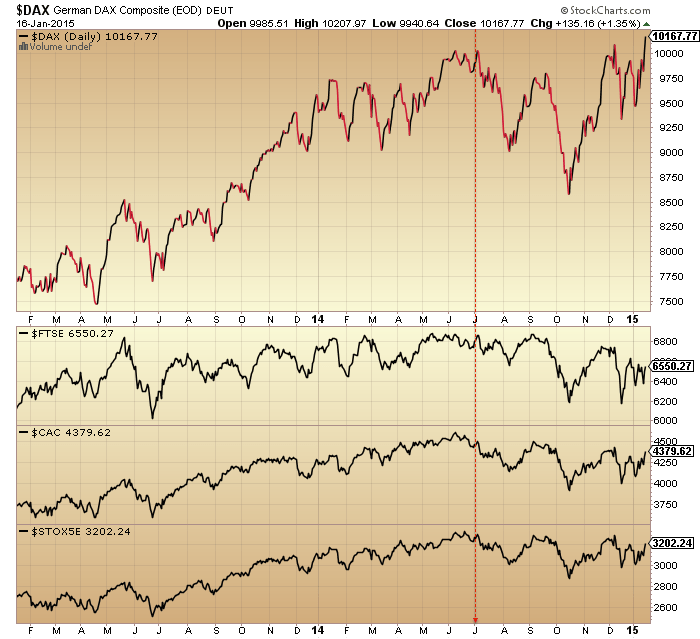
The Dax made a new high on Friday, but this has to be seen in the context of a fast-weakening Euro, and the majority of other global stock indices still dictate the overall peak around mid-year 2014. Shown below are other European indices in comparison to the Dax plus US stocks, together with breadth, volatility and junk:treasury bonds.

17janu1 17janu2

 Source: Stockcharts

Here we see the deflation problem Europe has to address with policy response.

17janu5Source: FT

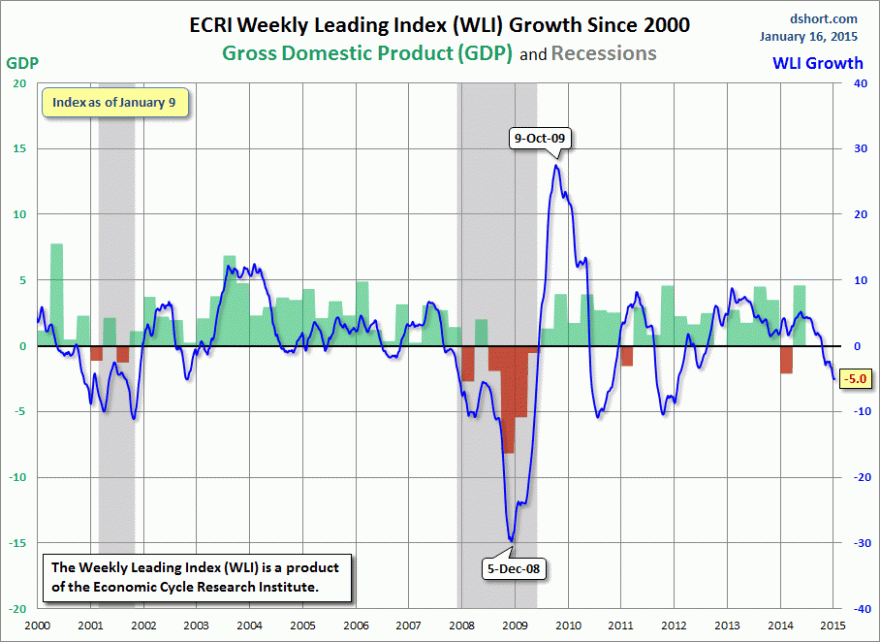
US earnings season is underway for Q4 2014 and is currently reporting a blended earnings growth rate of 0.6% and a blended revenue growth rate of 0.8%. This the weakest in some time, and earnings forecasts for 2015 are also weak, due to the combined impact of rising dollar and tumbling oil. Meanwhile, economic surprises for the US are dropping towards the zero level and leading indicators for the US continue to flag red:

17janu3Source: DShort

Therefore, supports for the bull continuation have been significantly weakened.

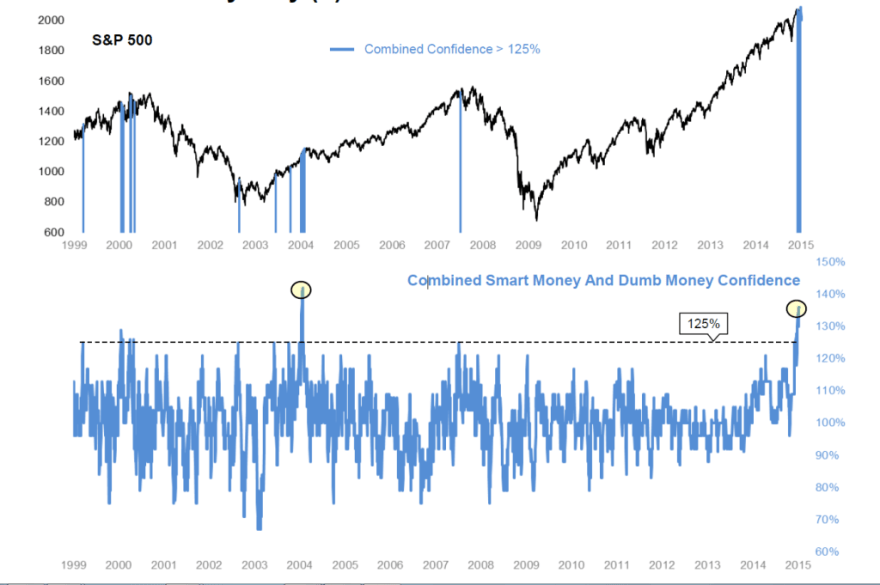
Here is combined smart and dumb money for US stocks: a rare lop-sided agreement that has been a marker of previous major peaks:

17janu11Source: Sentimentrader

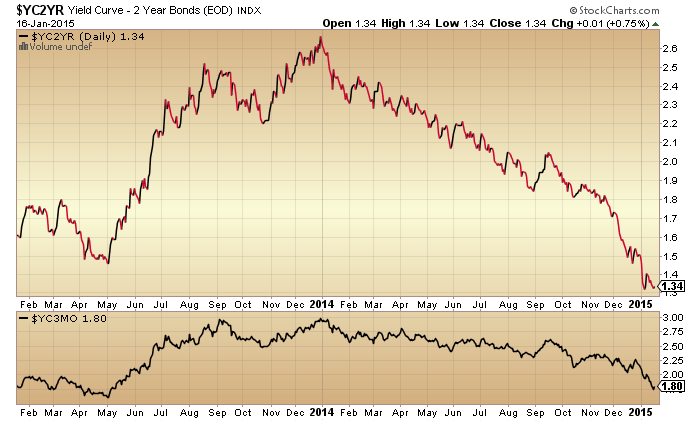
Similar topping flags have been raised throughout 2014 but at this point we see a more united degradation in leading indicators, negative divergences, earnings, and cross-asset action. Below we see how December to January has produced intensifying developments in government bonds and currencies.

17janu6 17janu8 17janu9

Industrial commodities have also seen acceleration to the downside in that period, whilst gold has taken off. All these developments make it unlikely stocks can continue their levitation, and this divergence in growth-dependent commodities versus safe haven commodities ought to continue. But what about agri/soft commodities? Largely unloved, but climate could give them a boost. 2014 ended up as the hottest year on record:

Screen Shot 2015-01-17 at 06.38.41

Source: NOAA

Perhaps when the US dollar finally turns, agri may attract buying interest. Positioning in the US dollar remains extreme, whilst the Euro is showing signs of capitulation. Again, I would the see ECB meeting this coming week to be the sell-the-news event.

In summary, developments are now much more supportive of stocks breaking down and gold breaking up. Post-solar-max, degradation in leading indicators and earnings, sharp moves in commodities and currencies, and a lot of data pointing to a mid-year 2014 ‘real’ peak. Back in 2008, stocks and leading indicators were tumbling whilst commodities levitated, but commodities could not levitate for long under those circumstances. I see the same here in reverse, with the cross-asset and cross-indicator breakdowns the prelude for the collapse in equities.

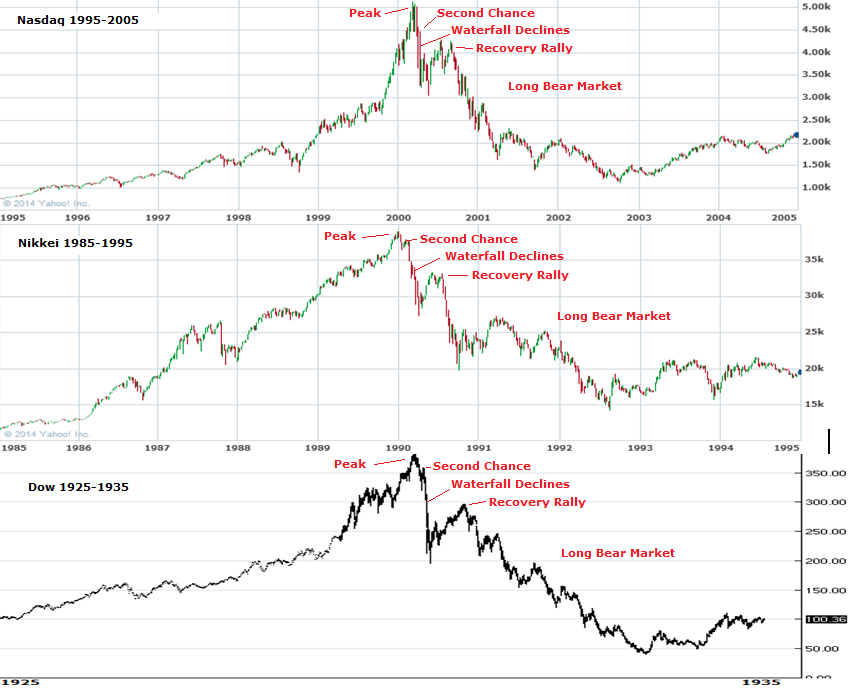
I previously looked at the ‘second chance’ peaks of the similar examples from history, e.g. Nasdaq 2000, Nikkei 1989, Dow 1937. They all showed a main peak followed by a lower high (failed) peak, which was then the trigger for waterfall selling. Looking at stock indices charts for 2014-15, we don’t see obvious such second chance peaks. The most parabolic of the indices was the Nasdaq 100, but this has produced more of an up-and-down range over the last couple of months, than a clear second-but-failed attempt at the high. So, we need to see price develop further to assess, but the picture may be one of a topping price range instead. It does not alter the likely subsequent collapse, which is already written in highly lopsided sentiment and allocations, extreme leverage and the post-solar-maximum rug-pulling.

17janu15


Macro Updates

1. Non-Farm Payrolls out on Friday, a big number forecast. Note the two biggest prints of the last 20 years were March 2000 and May 2010, both market peaks. This is a lagging indicator.

Screen Shot 2015-01-08 at 06.33.09

Source: Trading Economics

2. US earnings reporting season starts on Monday. This chart shows that a contraction in whole economy corporate profits has historically produced a market correction within 0-7 quarters, ticking since Q1 2014.

8ja11Source: Don Draper

3. We are seeing new all-time record lows in 10 year government bond yields in Germany, France, Italy, Spain, Portugal, Netherlands, Japan, South Korea, Australia and Switzerland, with the latter leading the race to zero (source Charlie Bilello):

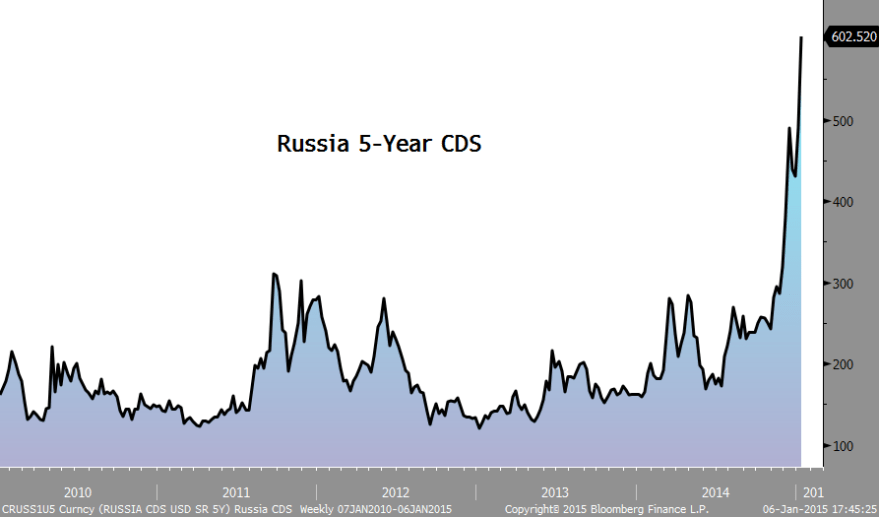
8ja124. Russian CDSs rocketing, warning of potential default:

8ja7

Source: Charlie Bilello

5. US Inflation Expectations now negative, for the first time since 2009:

8ja6

Source: Charlie Bilello

6. Eurozone annual inflation now negative, for the first time since 2009:

8ja15

Source: Charlie Bilello

7. Global manufacturing PMI dropping sharply since mid-2014:

8ja5Source: Markit

8. US factory orders annual growth now negative:

8ja3Source: Alhambra

9. Combined balance sheet expansion of Fed, BoJ and ECB reversed course as of mid-2014:

8ja8

Source: Chris Carolan

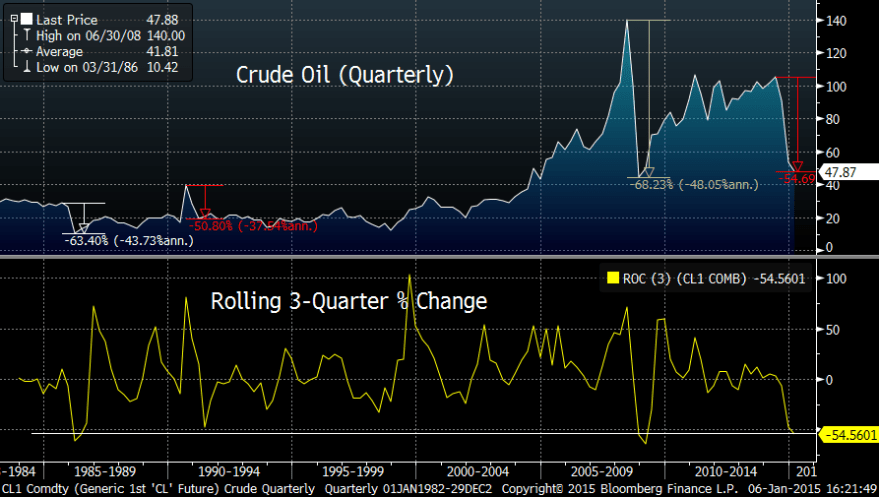
10. Crude oil ROC and futures curve show a bottom should be close. However, a price bottoming process is likely before any long positions would be fruitful.

8ja9

Source: Charlie Bilello8ja10

 Source: Phomax

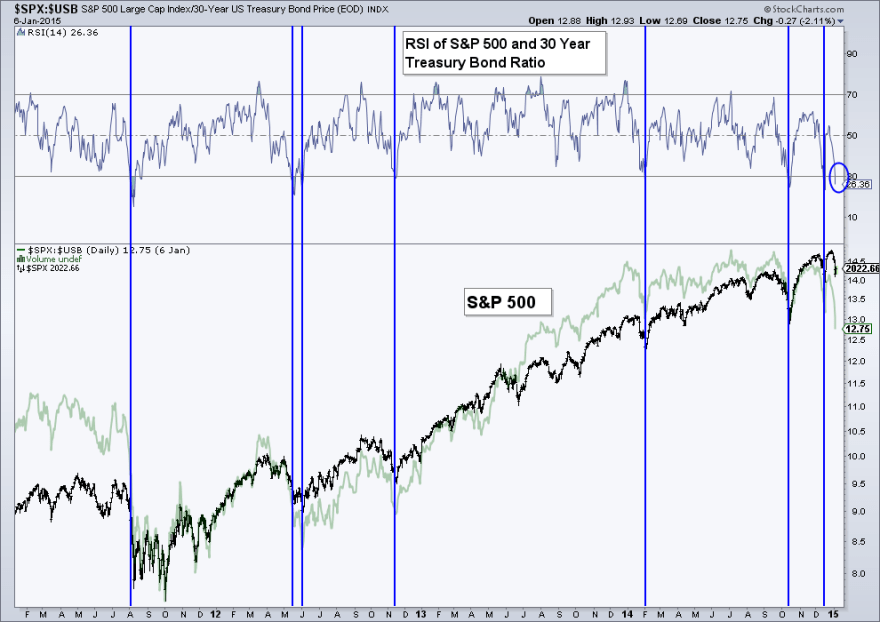
11. Treasuries to stocks RSI and treasuries to stocks sentiment both echo previous bottoms in stock prices the last 3 years.

8ja1

Source: Andrew Thrasher8ja2

Source: Rory Handyside

So do stocks bounce again here? At some point the pattern fails and stocks break down hard. The question is, are we post-second-chance? I believe the key is whether stocks can rally back up into the Jan 20 new moon, or whether the earnings season is a sell from the outset.

End Of 2014

I’m back and refreshed. Thanks for all the messages, and for all the comments in my absence. Here is the big picture.

1. Primary shift to defensives and away from risk occurred as of January 2014, as measured by stocks to bonds, cyclical to defensive sectors, small caps to all caps and high yield to treasury bonds. Clock ticking from that point.

30dec2

 Source: Stockcharts

2. Solar maximum looks to have occurred around April 2014, marking peak speculation. Equities mania on borrowed time thereafter.

Screen Shot 2014-12-30 at 06.16.52

 Source: Solen

3. Game over effective start of July. World equities, crude oil, high yield bonds and the US dollar all turned at that point. Deflation in charge.

30dec44. US equities composite, breadth measures and volatility all show the same reversal at the same point: start of July.

30dec1

5. Those twin peaks in risk appetite at the start of the 2014 and mid-year fit the seasonal model which is from the influence of geomagnetism:

30dec12

6. Which sets us up for a final peak at the end of Dec 2014 / start of Jan 2015 for those remaining stock indices which have yet to top. I referred to this as my worst case scenario (latest peak) in 2014.

30dec15

7. Developments in December support this now happening: sharpening falls in crude and government bond yields, flattening of yield curves, blow-off top in equities allocations.

30dec530dec10

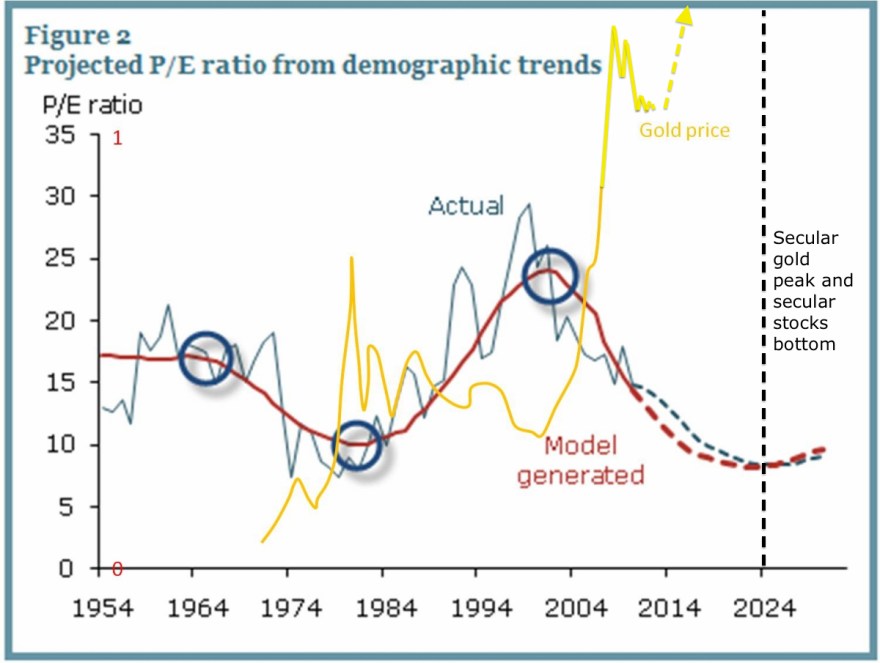
8. A new bear market in stocks will be a cyclical bear within an ongoing secular bear market. No new secular bull market as many believe.

30dec16

9. This secular position is dictated by demographics.

30dec20

10. The other play from this is that gold should enter a new cyclical bull within an ongoing secular bull, and this is supported by recent signals such as miners:gold ratio, gold/miners sentiment and price basing patterns.

12se1

 Source: Glenn Morton / My projections

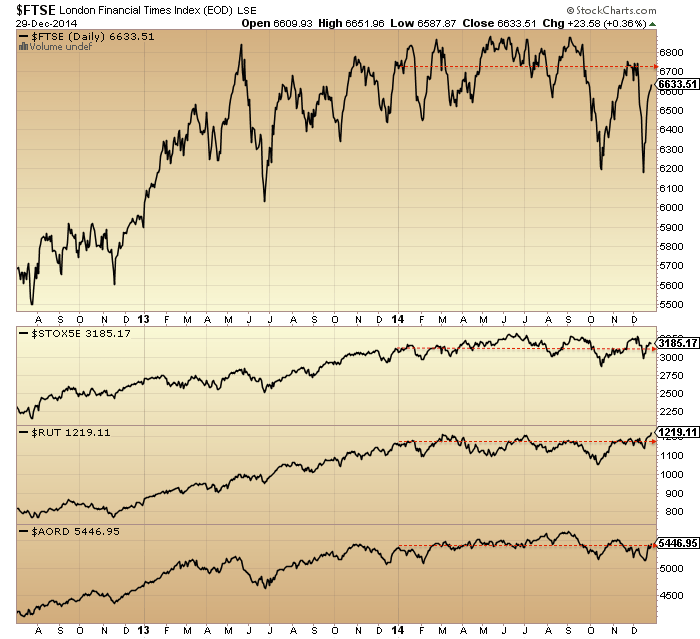
11. A sampling of stock indices from around the world, below, shows 2014 has been clearly either a large topping process or a large consolidation range. If the latter, then we should have seen excesses in valuations, sentiment, allocations and leverage worked off with time rather than price, yet all those measures remain highly stretched, suggesting this is a topping process.

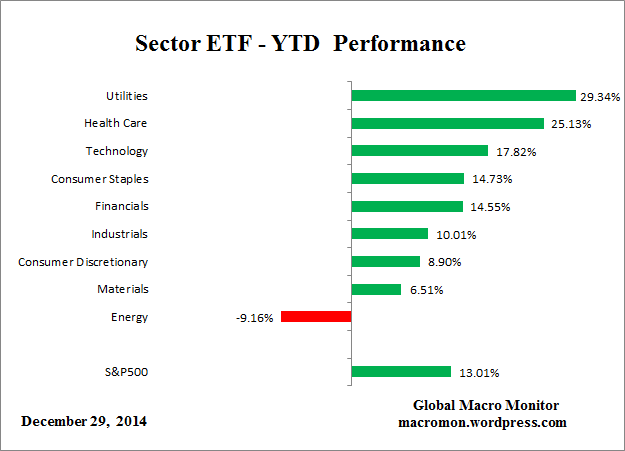
30dec3012. Plus, the two strongest sectors of 2014 are the two that are historical associated with outperformance after bull markets peak out:

30dec7

Source: Macromon

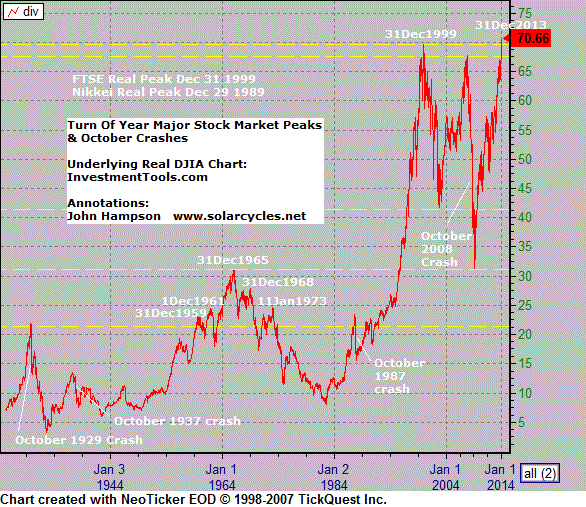
13. The peak-to-date in margin debt remains close to the solar maximum. This leverage, along with major extremes in sentiment, allocations, tail-risk, valuations and our post-solar-maximum status, is the set-up for a market crash. To repeat what I have said before, until/unless these measures are reset without a crash, then history dictates that is the most likely outcome. Crashes don’t occur often, but when they do, the set-up looks like the current.

30dec9

Source: DShort30dec8

14. Leading indicators and the longer term stocks:bonds ratio resemble 2000, 2007 or 2011, suggesting a minimum 19% drop in equities. This is the percentage figure I quoted as my general target for short positions because, stretching the view to the last 100 years, this is the minimum we should expect without being greedy by aggregating various angles on the market. To be clear though, the set-up is compelling for a bear market, not just a sharp correction, so I refer you to the secular bear chart above for the bigger projection.

30dec40

Source: DShort30dec41

15. Which brings us to the value of history as our guide, because 2014 taught us one key lesson: 100 years of reference points may not be enough, we need to allow for the unprecedented. An aggregation of angles shows how unprecedented 2014 became:

30dec50

 Source: Hussman

So what caused this? The most common view is that central banks brought this about with their policies of ZIRP and QE and unwavering verbal support. However, I maintain that ‘central bank policy trumps all’ was rather the mantra for this solar maximum mania than the driver. To prove this, we should now see equities collapse and gold rise despite central banks, and that is the final part of the real time test for the power of the solar maximum. If I am incorrect, then equities should continue their bull market in 2015 as central banks policies overrule. However, I refer you back to all the topping indicators and angles in equities that have amassed, together with the examples of 1930s US and 1990s Japan which revealed central banks’ true relative impotence. Ask yourself if typing numbers into a computer (ZIRP and QE) and saying a few soothing words can really work.

The crazy stretching of indicators delivered this year made for the most difficult year of trading since 2000, the last solar maximum. So if I can make one prediction for 2015, it is that it will be easier and more predictable. I am short equities and long gold and expect patience to be finally rewarded. I wish you all the best for the coming year.

State Of The Markets

It’s been a while, so here’s how things now stand.

1. The topping process kicked off at the turn of the year with a gradual shift to defensives, as represented here by stocks:bonds, consumer discretionary:utilities, high yield:treasuries and small caps:all caps.

13dec10

Source: Stockcharts

2. The shift to defensives was a global phenomenon, shown here by German, Japanese and UK bond yields, as well as US.

13dec13

3. The smoothed solar maximum is likely to have been April 2014. Historically, peak speculation and appetite for risk assets has topped close to that:

Screen Shot 2014-12-13 at 11.05.52Source: Solen

4. In keeping with that, margin debt peaked in February, the commodities index peaked in April and certain breadth measures peaked around that time:

13dec16

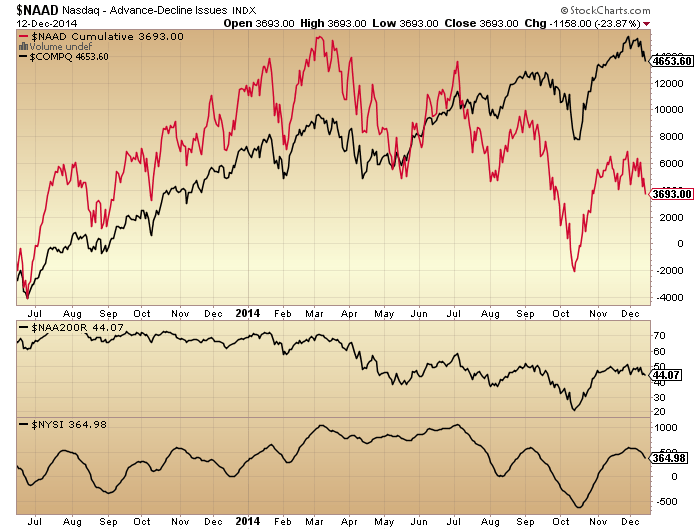
5. Then either side of that, the move to defensives occurred as of January and the price topping formation in equities took place in the window from July to November, with US large cap stock prices rising in a megaphone formation whilst the remaining supports for equities were dismantled and many flags were raised. Here shown are breadth, volatility, bullishness, junk bonds and leveraged loans as examples.

13dec18 13dec19

6. Considering the final thrust to the peak to be the rally from October to the start of December, then its size and duration fits in well with similar topping thrusts from history:

2000: 17% in 23 days

2007: 15% in 39 days

2010: 16% in 55 days

2014: 14.5% in 37 days

So is this finally it? Dare we dream that equities have topped out and are now in a bear market? Yes we do.

7. A key change in the last two weeks has been that the remaining leaders appear to have finally reversed, such as the Sensex, Nasdaq 100, Apple, USD/JPY and the Nikkei. These are tentative reversals but the point is they have aligned in the declines.

8. Looking at the bigger picture, households are about as exposed to equities are they likely to be (given no demographic tailwind):

13dec30

Source: Fat-Pitch

9. Dittto, valuations are as high as they likely to reach:

13dec40

Source: DShort

10. Sentiment is as lop-sided as it could be:

Screen Shot 2014-12-13 at 13.58.23

Source: Yardeni

11. Leading indicators for the US are negative:

13dec50

Source: DShort

12. Corporate earnings for Q4 have been sharply revised downwards due to both the high dollar and falling oil price.

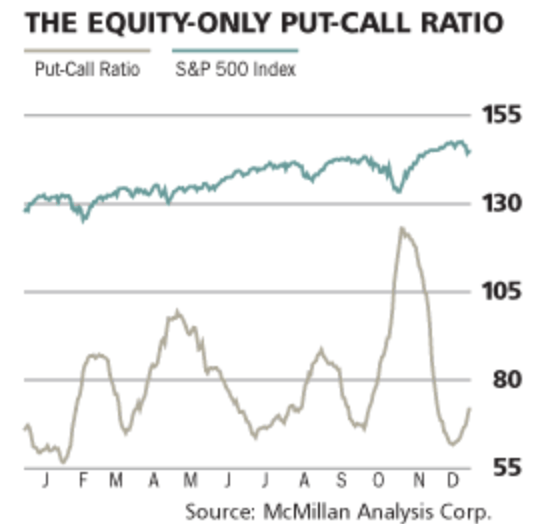
13. Put/Call ratio is signalling further price declines:

Screen Shot 2014-12-13 at 07.01.14

Source: Barrons

14. Stocks are nowhere near oversold yet:

13dec60Source: Charlie Bilello

15. However, Rob Hannah’s capitulative breadth hit 5 at the close of the week, suggesting more selling Monday/Tuesday could take this to exhaustion levels.

16. Which brings us to the phenomenon I have covered before: selling right into the close on Friday can trigger steeper selling on Monday due to weekend reflection. Is this finally going to happen? Allocations, sentiment and Skew are all set for it to occur.

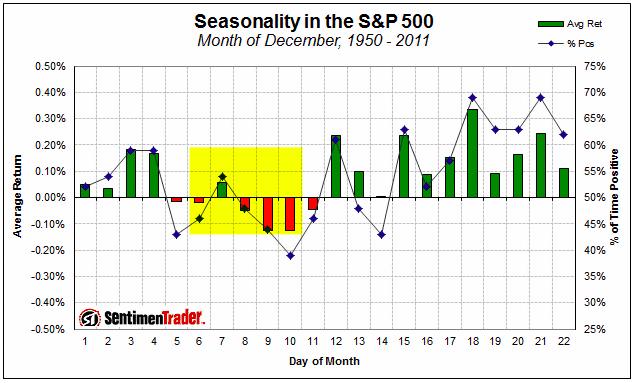
17. But what about the favourable seasonality of year end, the ‘Santa rally’ in the second half of December?:

13dec70Source: Sentimentrader/UKarlewitz

There is upward pressure into the Dec 22 new moon and a limited history of bull market peaks occurring near the last trading day of the year. Offsetting that, we have downward real geomagnetism pressure at this time of year, and that megaphone price topping formation which ought to now have a destiny with the lower boundary given the overthrow turned out to be just that. Meanwhile gold has built out a compelling bottom and is ready for a rally at the expense of stocks.

The whole topping process is already on borrowed time versus the solar maximum, and indices such as RUT and DAX stretched about as far as they could again in November without jeopardising the topping process. Therefore, I see reasonable odds that the Santa rally won’t happen. In mirror topping years 2000 and 2007, December was a down month both times.

Let’s see if Monday opens the selling floodgates. The key should be a gap down open, with weakness starting from early in Asia/Europe. Should stocks alternatively garner support again then maybe they can hold up into the end of Dec before finally rolling over. But it’s high time we saw weakness into Friday’s close follow through, against that sentiment/allocation/skew backdrop.

Cross Asset Position

No reversal yesterday in equities but I maintain it has to be close at hand.

The Nasdaq added another day to its small sideways range. RSI divergence argues the next move should be down.

11nov8Source: Stockcharts

The SP500 is at the top of its megaphone pattern and the Dow has edged above it. Gold miners made a megaphone top in 2011 and they also edged out above it, before reversing:

11nov2The combined reading of II plus AAII sentiment is the highest on record, which casts doubt on the fuel for higher prices in equities.

11nov3Source: Lance Roberts

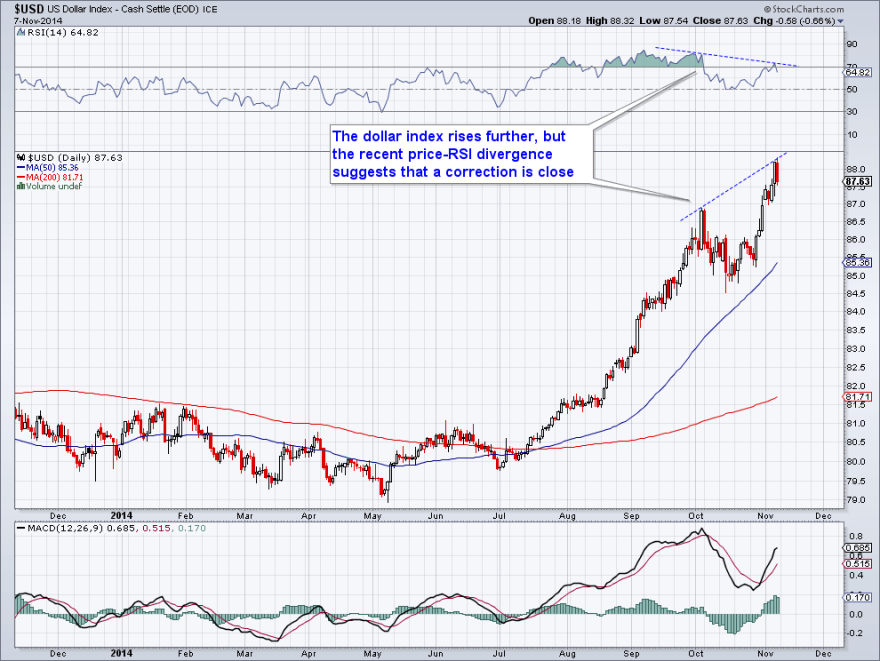
Positioning is extreme in the US dollar, sentiment is extreme, and there is an RSI divergence between the two recent peaks.

11nov15 11nov16

Source: Acting-Man

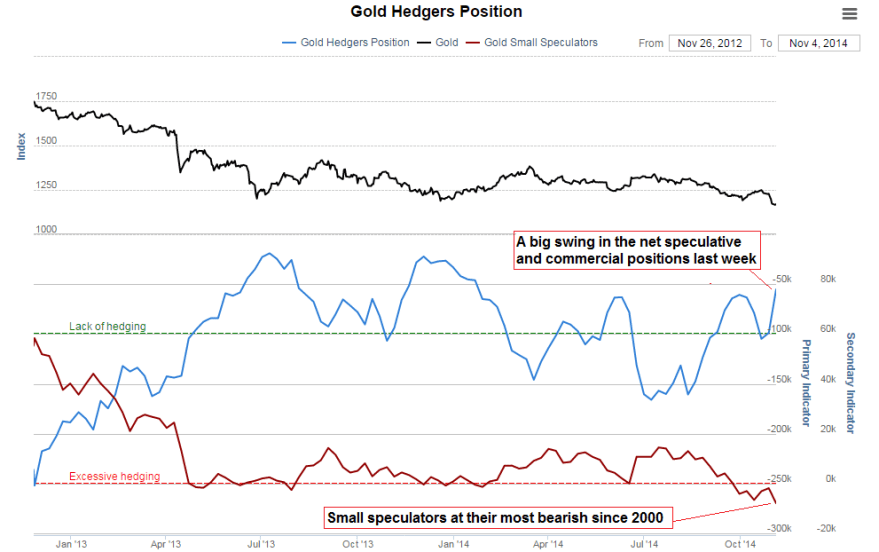
Gold miners bullish percent reached zero and Friday saw a voluminous bounce. Positioning in gold is also extreme and contrarian:

11nov17

Source: Acting-Man

Sentiment plus oversold conditions in commodities argue for a broader reversal too:

11nov12 11nov13

Source: Emma Masterson

Plus positioning in treasuries remains at elevated levels more in keeping with a bottom in treasuries than a top:

11nov7

Source: Zero Hedge

Add all these together and there is a compelling set-up for a major reversal out of equities and the US dollar and into gold, miners, treasuries and maybe other commodities too. If gold and miners can hold above Friday’s low then I believe the move kicked off at Friday’s full moon, but we really should see supportive developments a.s.a.p. if so. There is a geomagnetic storm in progress and the cumulative geomagnetic trend remains down, so the underlying pressure is negative on risk assets.

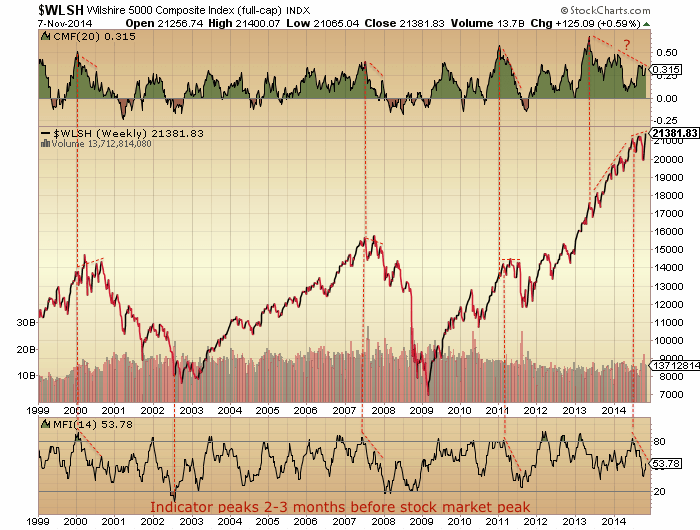
Here’s a look at buy/sell pressure and momentum indicators for US equities. There have been 6 major distribution days in 2014 and no major accumulation days since October 2013. This suggests underlying enduring smart selling pressure despite the higher prices. Also reflective of this are the negative divergences in the two money flow indexes CMF and MFI:

10nov2

MFI has been divergent since the turn of July, which puts us on borrowed time for stocks to peak, but CMF shows anomalous long divergence since way back in mid-2013, which I suggest shows the atypically long mania in prices.

The Chaikin oscillator and ULT momentum indicator show the same anomalously long divergence, this time since the start of 2013. I don’t believe these indicators are broken, but rather they again reflect the strength and duration of the mania this time, which in turn suggests a major crash lies ahead.

10nov3

There are multiple other indicators that reveal the mania in stocks began at the start of 2013 and is now almost two years old. Phenomenal and historic.

If we look back at the Nasdaq into its 2000 peak, to compare manias, then those two ChiOsc and ULT indicators still only made a normal 3-month leading divergence. Their divergence versus the Nasdaq in 2014 is around 12 months, which is unprecedented.

10nov8So what does that mean? I believe these indicators further cement the overall picture of one serious mega-mania which is on borrowed time and heading for a major crash. It’s just a matter of patience and money management in negotiating the short term.

So far in November we don’t see a renewed ramp up in sunspots and the probability remains that the smoothed solar max is behind us.

a2Meanwhile, the collective evidence from sentiment, allocations, negative divergences, cross-asset positioning and other market indicators make it improbable that stocks can grind higher into year end or Q1 2015 for an anomalous late peak relative to the solar max. Rather, the evidence still supports a renewed turn down in equities this week and a significant down November, keeping the bear trends in European indices in tact and completing the megaphone tops in US large caps.

Simply put, I have no case at all for higher prices from here whilst I have a multi-angled cross-referenced case for equities to turn down without delay in a last gasp of the topping process that began 1st Jan. It is what it is. So on we go, it’s a partial holiday in the US today, but stocks and futures are open whilst bonds closed.