
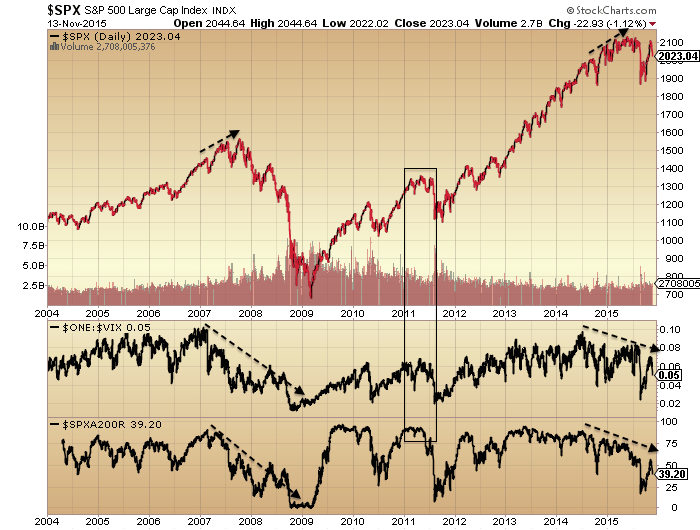
The Wilshire has been repelled at the 200MA and the 200MA is turned downwards, as it was in post 2000 and post 2007 bear markets:

Source: Stockcharts
The only exception in the last 20 years was 2011. The 200MA turned downwards, the market was repelled but shortly afterwards bounced again and burst back through.
The SP500 didn’t break out of what could be a large rounded arc top.

Source: Puru Saxena
Breadth and volatility continue to show long negative divergences like into the 2007 peak.

We can see 2011 wasn’t the same: full breadth into the peak and not the same complacency.
Risk and other major indices are still flagging.


Source: John Kicklighter
So I still think we are at the equivalent yellow circle, until all these indicators start to behave otherwise.

There is still the possibility we just made ‘second chance’ which historically led to a very rapid sell off:

Failing that, then the yellow circle above back in 2008 or a similar point in 2000 saw more back and forth in an overall downtrend. Either way, the key would be that we don’t revisit the early November high again.
The solunar model shows a decline into late November before a bounce.
Source: Chris Carolan
Of the near term indicators, $CPCE has reached a level that could suggest a bounce here.

Source: @NathanAlanLey
But note how the boxed range shifted higher since July which could mean $CPCE goes higher yet.
Insider action has reverted to the buy zone.
Both 1998 and 2011 saw a second (or more) $TRIN spike (fear capitulation) which hasn’t occurred in 2015. It doesn’t have to, but just one more potential clue.
$SKEW remains particularly elevated. It doesn’t have a great track record of calling the outsized move that it is supposed to predict, but again, it may be a clue.

Economic data remains weak but mixed. The overall global situation is fragile, and I maintain just the stock market, with its wealth effect, is keeping disaster at bay – for now.
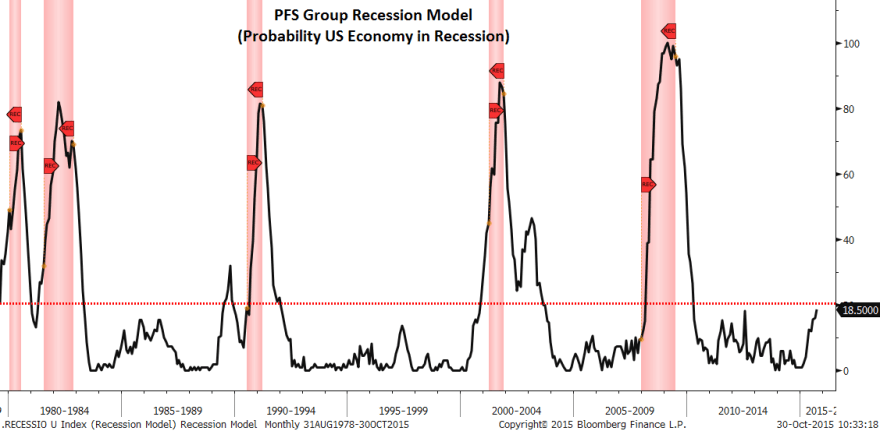
Source: PFS
Source: OECD
Then we have a series of anomalies occurring in the financial markets which may collectively spell liquidity troubles. Corporate bond inventories have gone negative, repo rates are fractured, swap spreads have gone negative. These are fairly unprecedented so no-one seems to quite know what they mean, but given the distortions that have built up under ZIRP and QE we shouldn’t be surprised if another systemic crisis was to start to take hold in some area.
Lastly, gold still looks like it may need a final washout low, due to open positioning and put call ratios. My guess is we see the US dollar break out and take off again here, as a bearish development for the overall markets, and gold gets its final sell off in response, before breaking into its new cyclical bull, as equities move decisively into full bear market.

Thanks John, great work as always. I have been reading your blog for awhile now but first post. My analysis agrees and I have all the indices on sell signals now with new lows expected. The challenge as always will be getting position sizing right, putting stops in correct place and not getting whip sawed out. Best to your trading.
Yet another clearly considered, evenly balanced synopsis of an exciting situation. A fascinating read. Sincere thanks.
Compelling analysis as ever.
If curious, count the number of trading days from highs to lows in recent months.
It reveals a pattern that points to late November for the next major low, lining up with the solar-lunar model John has shared.
I’d say that’s very useful for swing trading the next couple of months.
I tweeted to John that the financial dislocations we are seeing (as mentioned here):
http://www.bloomberg.com/news/articles/2015-11-12/five-strange-things-that-have-been-happening-in-financial-markets
..are all as a direct result of FSB Basel III rule changes.
The FSB are an off-shoot of the BIS (you know, the central bankers, notably the Europeans). My view is that they are deliberately bursting the bank and sovereign bubble (nexus). That’ll be the primary feature of the next few years.
Like the death star…..http://srb.europa.eu/ ‘will be fully operational, with a complete set of resolution powers, from January 2016.’ Grab some popcorn, may the force with with you.
Good eh?
Thanks, John, for another fine article.
I suggested several weeks ago that the Dow (and maybe the SPX) might go to a marginal new all time high, while at the same time all the broader indexes (RUT, NYA, W5000) might be tracing out a five wave ending diagonal triangle (as a failed fifth wave) from the late August low. Now that every other blogger sees the potential for a new all time high in the Dow, I’m having my doubts, but not enough to change my analysis. The current downdraft would be the fourth wave of the ending diagonal, but we can’t go much lower (if I’m right). That means sometime this coming week, we need the final rally to start – short and sharp, no more than a few weeks. If we just go substantially lower from here (small retraces aside), then JH is right and it’s all over – just a three wave bear flag ended.
Thanks again for another angled view John.
Never obtuse though. 🙂
Good one
I’m glad someone spotted how bloody good that was. Not often does such an opportunity for word play like that arise. Cheers John.
What do you think of Martin Armstrong’s theory that this time really is different and that, contrary to many expectations (including yours and mine) that stocks will crash, instead it will be government bonds selling off and fuelling both stocks and precious metals? The shift of public -> private assets.
Didn’t Martin Armstrong expect a stock crash? Is this a new view?
Armstrong flip flops on most things, the Dow especially.
His ‘big bang’ is predicting the bursting of the govt bond bubble.
That bubble will burst, but it is surely inevitable that we go through a bear market in stocks and a recession first, before the market moves away from govt debt (i.e. US bonds).
1920-34 is when I see sovereigns getting into serious trouble, although a few EZ sovereigns will default before 2020 I reckon.
History shows: first the big deflation, then the big inflation (or worse).
2020, rather than 1920 of course.
I thought about the stock and metals contemporaneous rally potential this week when Yamada went on Bloomberg calling for stocks and metals to go down in the short term. I’m not sure why she gets excessive praise. I recall vividly her calling for $5k gold and now she is calling for sub $1k.
Thanks all.
The exit from gov bonds seems plausible, at some point. But for the stock market there have been too many topping indicators for this not to be a major top, IMO.
Looks like DAX will be off another 1.4%, FTSE just over 1% and Dow 0.8% on open…..
Any takers for a long??:D
J
Absolutely. I went long in the early hours and have closed out for a good profit. Back to net short. The drop due to the Paris attacks was a huge overreaction and I’ve seen it before. I still expect stocks to falls but it won’t be because of the Paris terror attacks…more so due to John’s topping indicators and weakness in the global economy.
You better watch out for that hindsight guy that the sarcastic guy was referring to. I declared mine above, where was yours? 😀
Incidentally, I am not going back to net short on cash SPX again immediately, as I feel we have a little more upside and need to see the open at least. Good luck though.
J
Haha yeh apologies I didn’t declare my longs here. my shorts are larger positions than those longs so am still expecting further drops.
Don’t forget, the SPX 200/50 DMA crossover in August, the 200 DMA was trending down at the time, which is very bearish, much more so than if it had been trending up 📉
A few bull points were particularly satisfying so far:D
John H, thanks very much for your continued and thorough analysis. The title of this piece is particularly apt.
I believe we may have seen our first proper 5 waves down from Nov 4th top including the overnight fall last night. Here’s my count:
http://postimg.org/image/z8hi3u5fp/
The last night’s initial drop down was undoubtedly due to the mindless carnage in Paris and my thoughts go to the victims and their families.
I do however believe that since we’ve seen a full 5 down to make Wave – 1 of a larger sequence then we should expect a retracement of somewhere between 50-60%. On the DJIA that’s above 17530 through to 17630 although I wouldn’t be surprised if it went a bit higher because all surprises have been to the ‘up’ side.
Am looking for a bounce to 2050-60 max on SPX, have taken 50% of my long from last night now and will wait……
J
You’ll get some stick from someone here, he dislikes (and often calls out) those who post successful trades retrospectively. I can’t recall who, but I seem to recall he has hypocritical traits.
Hi
Sounds like a top guy and very sensible too – wish he was here more often.
There is another guy on here who has really changed over the past 6 months or so. He now sounds really bitter, is sarcastic in the extreme and likes to throw his weight around in a dismissive manner. I am worried about him, if you see or know him, please pass on my best regards and hope he gets better soon.
J
p.s. I have just gone short Nikkei at 19520 for a swing short (hopefully)…..
I am also long GDX, short CVS and have some Jan puts currently up 0.7%.
J
Allan, I just read your view on physical gold, thanks for the response. I wish I had better options on retirement money for holding physical gold. I might still buy some with after tax money in the coming weeks.
FWIW to anyone, I liquidated my TVIX positions just a few minutes ago…
Still VERY bearish on the market, but this looks like we’re trying to get a bounce going here, and those are my most leveraged bearish positions…
Went from “outrageously and foolishly bearish”, to “I can sleep better bearish” now… 🙂
But at this moment, the plan is to re-short at higher levels, and crossing fingers we get there…. But to be clear, i’m still plenty short…
Decided to put some of my Core Holding sales from the post August rise back to work on the long side. I bought back half of my sales of CCJ. I don’t want anyone to believe this is me thinking the market is turning up, rather trying to see if I can pick some bottoms of individual stocks. Since this was a core holding, all I basically did was shave out 2 points of this holding. I am very interested in STX as well. I completely lucked out on that sale just before their implosion. At this level, I REALLY like their dividend around 7%. STX is a very strongly managed company that knows how to squeeze value out of their business. I will buy more CCJ and possibly STX if they fall in the expected next leg down. Not all good value stocks fall that much in panics. Taking a risk on the CCJ buy now.
closed out of my wynn and bidus at the pop this morning. gave up about 15% from last weeks wins. left nav which is a long term position of stock/covered calls and protective puts. added some john deere, target and spy puts out over the next 3-4 weeks. glta
peggy spiral upside targets for 11/18 is esf 2040-2061 revised down from 2082 then down next week. 6 month spy target 1553
Hi Scott,
Laat time you said Peggy’s said the spiral was up through Friday. Now its up through 11/18? Could you clarify please?
Thanks,
Anonabc
no, i said her spiral forecast was up through this coming friday. spiral forecast an esf high of 2082 by 11/18 which was revised downward this morning to 2042-2061. again through this friday. then down the following friday. 6 month target is 1551.
Hi Scott,
In still a bit confused. This Friday is 11/20. High on 11/18 would be up till Wednesday.
I dont understand why your saying up till Friday abd saying 11/18 as thats a Wednesday?
Thanks
Anonabc
use it as a guide. jeger posted Peggy’s twitter page below. i should have stuck with it instead of being muddled by all the white noise. screwed up my bidu trade.
Ok. Ill go to the twitter feed.
Thanks
Just take a look for yourself:
https://twitter.com/mjmateer
HTH
J
Just as an observation, virtually every trader here and on other TA sites is betting on a bounce. I have yet to find a single trader who initiated a short position today. This suggests the boat is heavily loaded with new long positions betting on a bounce due to CPC and NYMO. When everybody’s all in the same trade, that’s usually a cautionary signal.
chsm1th, whilst your ‘observations’ are probably correct you have to view the ‘current situation’ (whatever that might be) within the ‘CURRENT CONTEXT’.
Do you REALLY BELIEVE that every mum and her poodle are ‘running for the hills’?
If so it would be very very useful to post a ‘chart’ which suggests that to be the case. Not what anyone else ‘MAY’ be doing HERE OR ELSE WHERE.
Thx very much.
JH, thank you for the update. I have no doubt that we will crash soon — even now. What is the best way to make returns?
I know you don’t trade China, but the crash so far has been frustrating — a few gap down mega days, and flattish days otherwise. Short sellers are literally jailed, accounts suspended, margin requirements raised.
What about the US? In 2008, shorting in financials were banned. The SEC is now thinking that short sellers need to disclose their positions. And as always, brokers raise margin requirements in volatility — and crashes are high in vol. There is therefore a risk that any short position be called in right when it is most profitable. Puts on the other hand, are expensive.
(I know you do spread betting in the UK — if Refco and Man financial can become insolvent, that will be another risk especially in falling markets…)
For all you contrarians:
One Of Wall Street’s Biggest Bulls Ends Six-Year Overweight on Consumer Stocks in Favor of Energy
http://bloom.bg/1kZB5uT
November 2000 and November 2007 were both -10% peak to trough (ES).
10% down this November?
http://screencast.com/t/W4U0wa6d
oh well Dax shorts closed at break even. Maybe should have taken small profits than try wait out for the big fall. Hope we get a few more heavy bullish days so I can re-enter short at a better entry price. Still plenty of time for a big November drop.
As I’ve been saying since I called the primary wave [3] top in May and [4] bottom in August, the big correction is coming, but everyone’s timing has been premature. We have one more new all time high to make first in my opinion. The NDX has already made its ATH, the SPX and DOW should follow.

Look for a nice bearish butterfly to form if I’m correct

Limit order hit for 1st tranche short SPX at 2051.4, just for transparency.
J
PALS and SPX balance of week:
Phase: – post new moon
Distance: ++ perigee next Monday
Declination: ++ south to north migration has begun
Planets: — mars still in front of Jupiter, Merc superior conjunct tomorrow
Seasonals: ++ holidays soon, market may share some wealth with consumers
Summary: I went heavily long spy option calls last Thursday and Friday. Got burned and recovered somewhat today. Will keep 2/3 of long position until this Friday as large green candle days are often followed by several more.
so far spiral nailing the moves again. still pissed i let all the white noise shake me out of bidu. poor discipline. don’t mind letting go of wynn for a small loss. may revisit later.
spiral expects a wave up nearly complete, ready for a b wave down, before a c wave up to top Wed/Thurs 18th/19th. then down again to retest or surpass friday’s lows in the next 2-3 weeks
anyone following the absolute destruction of big box retail? the following have been murdered. men’s warehouse, macys, kohls, walmart, urban outfitters, dilliards, target, nordstroms, and many more. i have added some dec monththly puts on some of the following and intend to add more. best buy, dicks sporting goods, tj max, rost, buckle, anf, gps, foot locker.
crazy mahem. must mean we are ready for new highs.
As Newton bought stocks right when it came time to crash, it looks like long time bear GMO decided to buy biotechs.
http://www.bloomberg.com/news/articles/2015-11-16/grantham-s-gmo-more-than-quadrupled-valeant-stake-in-quarter
Could be a British thing, but don’t want to insult anyone.
Retail therapy needed?: http://www.screencast.com/t/MloscaLGoCcL
This graph is Macy’s. weekly with 200sma in dark blue.
Short DAX at 18890. Got my better entry point! Looks like today is another day of punishment for those sinners that dare short the market. Nicolas was returning from his Spanish break today if I’m not mistaken.
Taken profits on my GSK trade from last week.
Following the sickening events of Friday evening
I think most were happy to see a strong day yesterday.
John Li, Mr Grantham always reminds me of Terrence Stamp’s
character in Wall St, very clever man, still human like the rest
of us though.
SP500 rapidly regaining 2065. Who could have forseen that eh?
Judging by the deafening silence here, it seems the policy is to simply ignore anything which doesn’t fit with the “crash now or crash soon” conviction.
The Market Humbles all Mark. My personal belief is that you can increase your chances of being right if you study the market and it’s history. That’s all we are doing here. Playing the probabilities. Being completely right all the time is more of a market newcomber attitude. One that ALWAYS gets humbled. Nobody has a solid answer, just a probalistic guide.
I totally agree with your first two sentances and your last one JaFree.
But people here are not playing probabilities. Most, including John Hampson, are playing what they see as a certainty – they have decided, using popular and priced-in indicators, that the US stock markets MUST fall. They have become so completely anchored on that, that they can’t even consider any other possibilities – and after a year and a half they show no signs of giving up.
And then we have the self-styled Comments Police here, who feel compelled to vehemently criticise anyone with alternative views. These people are convinced that those alternative views must by definition be wrong (because they conflict with the overwhelming bearish consensus here). They don’t use any sort of “probalistic guide” because they “know” that the markets must fall.
I don’t read your comments, other than the couple of replies to mine, but I assume given that you’ve mentioned probability several times above, that you like to give a probability when you comment. I’ve been commenting here for many years since the site started (ie. not a newcomer), and my probabilities have always been clear. Recently I’ve pointed out – in simple black and white – that my probability for a stocks bubble is 90%, and that it could be 13-19 January 2016 before it really gets underway in earnest, and that there are two most likely times for it to peak (Q2 2016 and more likely Q1 2017).
How much more “playing the probabilities” do you want?
I have been thinking of probabilities too — what is the best way to play such a wide window of peak dates?
SC1 Late 16/Early 17
SC16 Sep-15
SC12 Jul-17
SC13 Nov-17
SC7 Feb-16
SC10 Jun-17
AVG Dec-16
If you disagree with shorting outright, perhaps divide money into 6 parts and buy puts at various intervals?
‘Most, including John Hampson, are playing what they see as a certainty – they have decided, using popular and priced-in indicators, that the US stock markets MUST fall. ‘
Anyone else feel this statement is utter bollocks?
Mark, I know your view, I disagree with it.
Sorry that causes you to become somewhat angry.
Time will show us what is going to transpire.
Why not set up your own blog, if the writings and comments here are so unpalatable to you?
Good luck.
peggy’s spiral report nailed it this weeks updraft, just as it nailed last weeks down draft. spiral expects up thru today/tomorrow, then the rollercoaster goes down again through next week
‘SP500 rapidly regaining 2065. Who could have forseen that eh?
Judging by the deafening silence here, it seems the policy is to simply ignore anything which doesn’t fit with the “crash now or crash soon” conviction.’
Mark, several comments indicate that it was foreseen, perhaps re-read the comments in the previous post (you’ll find mine there I know).
Do you think that 2 up days rules out further declines?
Has anyone here (at all) been predicting a big crash now or soon? (It could happen, but probably won’t).
Many here think the bear has started, but accept it will play out over a number of years.
Have recent days disproven your 1998 analogue? I suppose further declines this month will do, it’s hanging by a thread at the moment.
Good luck.
John’s analysis makes very good sense and implies the market should drop. I think we are going to get a drop too but on days like this there is nothing to say hence the silence. We all know the central banks are continuously interfering to delay (and it will always be DELAY rather than STOP) this scenario so days like today are good to just switch off and focus on something else.
Hi Mark
The market rarely moves in a straight line, and making money is not so much about predictions. Yes, there are many individuals here hoping for a “crash” (however one defines that) and that is unfortunate as there are opportunities as always in both directions. Personally I am being fairly quiet as there is not really much to add right now. My posts have indicated my actions over the past few days and am looking quite carefully at the QQQ to see how far this bounce will go before I take new positions. I shall close out the rest of my SPX long around the time I re-open a shorton QQQ….IF I do……
In my view there really isn’t much to comment on, as there hasn’t been much technical action that fundamentally changes the picture. The markets are in a larger sense in a downtrend now unless new highs are made in my own personal opinion. I am therefore more likely to go short than long but that could change quite quickly. If however you are a fan of predictions, I can tell you that we will see 1000 and 3000 on the SPX at some point in the future. Perhaps when these occur, I will be able to post “well, we reached 3000, who could have foreseen that eh?”……
As ever, I find it very important to distinguish between “being right” and “making money”. This is where timeframes and personal aims come into the picture along with some details of activity. Your post suggests that SPX regaining 206x is important to you. It would be useful to know why…..if you see what I am saying?
Good luck to all as always.
J
I see what you are saying J, and if you’d bothered reading my comments (for more than a year now) you’d know exactly where I got 2065 from. I even posted a link to one of my old comments on it a few days ago.
If you ignored what I said then, then simply continue to ignore it.
Mark’s so bitter and sarcastic, he must be *that* guy.
Wise up Marky.
You can be long a particular share and still cautious,
not sure why people assume it’s black and white,
all or nothing, that is rarely a way to make money.
Crash is a word that is bandied about a lot,
never sure exactly what that means.
I guess most peoples definition would be a large
compressed % decline within a very short timeframe,
that very rarely happens.
Just reading J’s post above I wholeheartedly agree,
it is not about being right or correct, this is about making
money, unless you derive some strange satisfaction
from making random anonymous calls on someone else’s
blog.
I remain cautious atm, but that did not stop me going
long RDSB and GSK at the end of last week, as
considered they both looked oversold, closed both
those positions this AM.
There are always opportunities.
You mean “Phil White” is not your real name?? WTF?
Whose house am I sitting outside of then?
J
Mr White is the best name in the film Reservoir Dogs
I’m in Weybridge J,
if a cat goes missing around here it’s big news )
FWIW, just added back half of the TVIX positions I took off yesterday morning…
Adding back the rest at higher numbers, if we see them….
I appreciate no one really cares what I’m doing, but wanted to add a comment to the “deafening silence”…
If ~ever~ there was a comment that proves people “see what they want to see”, THAT would be the comment… Jeez…
Barry – much appreciated!
Holy cow we are heading towards a recession and we can still get indices rising 2.5-3% in a day! 2015 marks the greatest level of false hope ever recorded in history.
That’s kinda how i’m looking at it too….
https://theupsizers.wordpress.com/2012/12/02/entry-183-the-wile-e-coyote-school-of-economics/thelma-and-louise-soaring1-2/
Higher volatility in equity markets (up & down in a hurry) is rarely a good sign for the bulls, tends to happen in the initial stages of the turn from bull to bear markets.
Barry, I like your posts and would think the majority
on solarcycles never post but still read.
Article Clip:
Blackstone has exited “a lot of investments” where it can and is poised to take advantage of a correction with “a lot of capital,” he said.
from:
http://finance.yahoo.com/news/blackstone-coo-bit-correction-coming-141923061.html
Just a verification to me that the big guys have been selling and the Volume as a whole as been up since the Market Drop in Aug.
To add, now that Blackstone has decided to bring it to the public, they are most likely done with most of their selling and trying push a correction with news. In any case, it is an interesting comment from a Blackstone COO
Interesting to see gold take out its bear market lows today, whilst HUI (currently) has not, this pattern was apparent at the turn in the late 90s and early 2000s.
Gold making new lows is barely noticed by the *crowd* at the moment, so it’s clearly past the capitulation stage, and well into the despondency stage. Never going anywhere, who cares about gold?
Useless pet rock.
Buy shares, you can eat them.
The ‘big’ question currently on my mind is whether today’s high (wherever that might be) represents ALL of wave 2 or just wave-a of 2?
If it’s ALL of 2 then we should see a very quick drop through the 17400-17300 (the 38.2% – 61.8% retracement) range without stopping.
However if it stops and turns or waffles there then there is a good chance that we’ll have yet another high above today’s to complete wave-c of 2.
Just thinking out aloud.
Talking about the DJIA above, but then you all know that by now.
Also the a-b-c scenario would fit in with the spiral.
peggy posted an update on her twitter feed 2 hours ago (noon cst). spiral hit the A target today, starting B wave to about 2038-2032. then C wave up to 11/29-20
supposed to say 11-19 / 11-20. next week is supposed to be down according to spiral
Now THAT is a good, tradeable, HELPFUL, observation… Thank you for that….
Thanks very much for the compliment Barry. Looking at the closing action it is possible that wave-b may go horizontal i.e. stay above 17400 and waste time before charging up further.
If you are of a nervous (or bullish) disposition, please do no zoom in on 2015 in this data series. Relax, nothing to see here, please carry on:
https://research.stlouisfed.org/fred2/series/WACBS
Are you suggesting these are the tremblers to foretell of a bigger quake?
What is the easiest way for me to get some gold exposure?
I am thinking calls on GLD. But I have no idea what kind of capital gain/loss treatment that is. In the US, gold is a collectable and I think you can’t deduct losses on it.
Why GLD calls, and not just buy GLD??
Options just seem to complicate things…
I could be mistaken, but I believe GLD is treated like every other ETF, but regardless,it’s certainly not treated as a collectible…
Another option is CEF, which is currently trading about 10% under NAV
http://www.centralfund.com/
Just a few thoughts…
Thanks for CEF. As I said, I don’t know what is best. But I assume calls allow me to purchase at regular intervals lest the crash come in the next few quarters rather than right now.
GLD is a collectable for tax purposes.
http://seekingalpha.com/article/366091-gld-capital-gains-need-careful-tax-planning
Well, I stand corrected… I did not know that…
What a cluster-f THAT must be at tax time… *shaking head here*
I reshorted QQQ at 111.8x with a fairly tight stop above today’s high. Gap closed.
GLA
J
Mark:
Just catching up on a few notes further up, that I missed seeing earlier…
From reading your earlier note, it looks like you’re looking for quite the melt-up going forward, or at least very soon…. Am I reading that right?
And I take it you’re positioned quite bullishly right now?
And I apologize if you’ve explained it before, but 2065 is significant somehow?
How so?
Just curious…..because I’m probably on the other side of all your trades…
And I’m certainly NOT saying we can’t go a bit higher from here – Options expire this Friday,after all – but still, nothing I’m looking at makes me want to be the slightest bit bullish….
Thanks…
Mark said this last year:
https://solarcycles.net/2014/10/29/explosive-rally-again/#comments
“Sensible comments TDL.
And I also make SPX 2065 the natural top of a Fibonacci sequence (666-996-1201-1366-1531-1736-2065). The penultimate level, 1736, was perfectly backtested during early February 2014.
As for the expiration of QE, surely markets priced that in when it became obvious many months ago?”
Hi John;
Okay, I see that, but back then the S&P kept on going past 2065, to above 2130+ some months ago…. And yes, i’d agree, we’re at 2065 again, but now what??
And from his note above, it sounds like Mark is looking for substantially higher prices from here…
Just trying to understand why…
I am just trying to understand how 666 goes to 996 in a Fibonacci. Mark care to comment?
Probably a typo, 999 would be 50%.
Barry – agreed…..we have been at 2065 more than once now…..ffs hahahahaha
There has been a very solid support shelf on the DJIA just under 17460.
As I’m writing this the DJIA is at 17510. I believe it is going to turn down from around this level as it appears to have completed a flat correction since late yesterday.
IF that is correct then I would expect the support shelf to break this time and we’ll get an accelerated drop to around 17350.
Additional short SPX at 2056.2 entered just now, quite a tight stop on this one….
J
Gone long Dow, Dax and S&P. No reason other than wanting to join everyone else making money going long. My bearish views are unchanged but hey why not make money being wrong sometimes!
That generally happens to me a lot, as long as my stops can take it. 😀
J
Bo Polny still expects new ATH’s in gold and silver this year. I’m not yet about to laugh at his potential idiocracy but time is ticking for him. I was half hoping me going long would mark the top for markets but I was wrong so far. All trades nicely in profit 😦
100 pips banked on Dow. S&P trade closed leaving just the DAX long. Greedometer sequence 11 probably destroyed by this rally as well. Since I made 100 point on the Dow as a fluke just gone short at 17616 with 100 point stop. See how far much luck extends today!
Gold currently down. If we have another down close that will be 22 down days out of the last 25 trading days since the Oct peak.
Can anyone and I mean ANYONE honestly say that in fthe ace of record global demand that ANY security or commodity can have that kind of sell off under natural forces?
The only way that that can occur is because the large deep pocketed banks can leverage to infinitely without any requirement to back up their paper shorts with the physical metal.
It is as corrupt and as about as absurd as a market could be. Quite frankly I acn not wait until the entire US finacial system is ripped apart regardless of the consequences.
Then and only then can we reset the fraudulent landscape.
Hello Allan, trust all is well with you.
Just wondered, do you know is the largest (by far) influence on the *gold price* we see on our screens?
Thanks.
(This same sector of the market was heavily bought during the past 15 years of gold’s bull market BTW, but has been generally sold during the past four years).
Allan; same as in the 70’s during the ‘oil shortage’ when it was said the refineries
were full; along with tankers sitting offshore. Another example of free markets.
1:100 leverage physical to paper and no requirement to back your position with any physical whatsoever and the abilitiy to add contracts ad infinitum is not a free market, it’s a market that is by design there to abuse and manipulate.
Markets are manipulated on a macro level. CB intervention via QE is manipulation more so directly buying ETF’s and company stocks.
I pointed out at the time, when last month the USD had just initiated a death crosss coinciding with a bearish flag on the daily chart and worsening momentum indicators on the weekly and monthly charts.
Trot out Mario Draghi right on cue to give the “whatever it takes” BS, when there absolutely zero reason for him to publicly state it and it becomes obvious why he did so.
http://stockcharts.com/h-sc/ui?s=%24USD&p=D&b=5&g=0&id=p92112152225
Alan, a number of people have mentioned Mr. J Snider, from AlHambra Investments, here before.
His basic thesis is that for the last 5 decades the ‘Great Moderation’ was actually caused by banks increasing their Balance Sheet ‘liabilities’ by creating USD denominated Debt….BUT outside of the US Banking jurisdiction. i.e. EuroDollar and also Asian Dollar. This was at the time MASSIVELY profitable for these banks.
However with the increasing ‘defaults’ in EMs and the extra legislation everywhere they are hard at work reversing that Debt. HENCE there is now a HUGE shortage of USD (the real stuff) to repay that debt.
What that has meant is that ALL OTHER ASSETS are having to be liquidated to raise that USD cash.
ONE of the MAJOR Assets caught up in that is of course Gold.
Here is an article that he discusses this under:
http://www.alhambrapartners.com/2015/11/13/the-implications-of-october-15-and-money-market-duality/
Beware the guy is very hard to comprehend.!!
Hmmmm… we’ve reached our 61.8% retracement without any appreciable pull back first to provide a decent ‘b’ wave.
So here’s an alternative thought:
I can’t see this up wave as a complete 2nd wave because of the lack of clear definition. So…I’m still of the opinion that it is wave-a (convoluted I grant you). Now a zig-zag is pretyy much out of the question because there is not enough room on the ‘up’ side for a wave-c to have any sensible size relationship to wave-a.
So my next (and really only option for a wave 2 ) is a ‘flat/expanded flat’. That means that once wave-a ends (wherever that may be – but under the start of the previous down wave 1) it will retrace pretty much ALL of this wave-a up as a wave-b BUT then come all the way back up to complete wave-c.
Wow that is quite a ‘drooling’ prospect for me.
Of course if this continues above the start of the down wave 1 then I’m back at the drawing board scratching my head.
BTW congratulations to Krish for being brave enough to grab some ‘contrarian’ profits!! Hope you cash out in time.
I just posted above. It was pure luck, not based on anything proper and not anything to be proud of even though it worked. I’m just bored at waiting for this experiment to fail so trying to keep myself occupied. Don’t mind making and losing a few pennies here and there. Will make the pounds when it waterfalls (assuming i don’t miss the entry!)
I’m sure this is just another “broken” chart, but I just find this fascinating……with the US indexes just a couple of percent off of their highs….
I’m sure the BDI will “catch-up” to the S&P in no time…. 🙂
🙂 🙂 Barry, Barry, BARRY!! you are confusing reality (BDI) with financial manipulations (S&P) .
You’re going to struggle in this market if you try and apply logic. Wise up man.
No worries, it’s not a trading tool….
Just find it fascinating….
I’m sure we’ll see the S&P at 3000 at about the same time the Index works it’s way down to zero…
The world will be like Amazon! Free Shipping!! hahahaha
Good to have you here, Barry. We need a sense of ‘perspective’ and humorous candour. Thanks for that.
Allan, just to be clear; I was trying to agree with your point.
Still the light at the end of the tunnel approaches. With gold gone one step beyond all we have is that history can yet and yet again still have a go at repeating itself. But it hasn’t for a long time and still shows not a sign of suddenly deciding to do so now. Is it not time to put the possibility (however far from any comfort zone) of a Paradigm Shift on the table? At the very very least consider it. Give it at least an equal opportunity for being weighed.
Test it: Could it still be those swept-aside non-considerations that have maintained markets beyond all historical indicator relationships? Relationships that are being held as unassailable and are the holiest of the holy! Broken one after another but still held aloft as cornerstones of a belief system.
Sure this post is just more manna for the turn around belief syndrome. Only thing is that year after year such poop is evidently the only right-sided constant.
No need to heed. Carry on with the archaeology scraping. Search out the ancient cults.
‘But it hasn’t for a long time and still shows not a sign of suddenly deciding to do so now.’
You think 4 years is a long time?
GM, do you think the ‘author’ has turned bullish here?
Bullish on gold?
Doesn’t appear so purvez.
Perhaps he bought a load in late 2011 and is thinking of selling now?
We’re well into the despondency phase for gold now, past panic and fear.
Excellent. Onward.
Sorry GM I should have clarified. I was wondering about being bullish on the Stock Market?
God no, don’t do that p.
No not me GM. I meant has the author turned bullish on the stock market?
Just pulling your leg.
No indications in his treatise what he thinks of the markets.
Permanently high plateau maybe? 😉
Maybe it is watching every tick today, but I just can’t follow. Maybe it is my English.
In this instance, Google translate will not help any of us.
My translation: has gold’s 6,000+ year old reign as a wealth asset come to an end?
The Washington Gold Agreement (recently renewed by the EZ CBs) means…nope.
That and a decades old plan by the BIS to move us back to settlement using the one thing that can settle between nations.
To complete the loop, just added back the remaining TVIX positions exited first thing Monday morning….
Back to where I was, position-wise, and sidestepped a drop in the shares…
Saved me about $16k, so we’ll call that a small victory, in the middle of an otherwise money-losing week…
Like I said over the weekend “sometime this coming week, we need the final rally to start, short and sharp, no more than a few weeks.” The final rally to new all time highs for the Dow (and possibly the SPX), but not the broad averages (which are tracing out failed 5th wave diagonal triangles – counting from the late August lows). See no reason to back off that call. Keep your powder dry.
Good call and I agree.
Right I’ve had enough. My views are now identical to our good old friend Nicolas. Only difference is this is my last post on this website until my views change as I’m not going to troll this site. Good trading all!
See you next week krish.
Krish, have one more go at long positions. You never know that may be the jinx that’s needed here!! LOL.
Don’t stray too far though.
retail still is by and large getting smoked. made money on DKS yesterday and target puts today. 20% for the week net after making up from the down draft screw up on bidu and wynn on monday. liquidated my spy put spreads this morning based on great charting by peter ghostine. the $3k spec money i had for the bidu earnings release is now at $23k. been quite fortunate. peggy spiral orgiinal forecast for spy from 2 weeks ago of down big last week and big rebound this week was spot on
i got small put positions just opened for bby and gap (gps)…someone from this site advised me a few weeks ago to target weak areas rather than just spy. thank you!
Scott, please may I ask at what point did you decide that the Spiral 2030-40 down call was not going to happen? Thx in advance.
the es wave pulled back to 2041… close enough for government work. the spiral was only looking for a small b wave down before moving up again.
a premium service i belong to w/ Peter Ghostine (has a phenomonal track record) called the breakout on his private twitter feed at 8:15 this morning. i liquidated my small put spreads 205.50s/203s and 203/200s. i liquidated my target puts spread prematurely 73.5/70s because i was going to be out of the office and away from pc. i went 95% cash and missed playing the upside.
here is today’s final acct valuation. now at $23375
copied and pasted
$23,375.49
+$3,986.15 (20.56%)
the 20% increase was from yesterday close to today’s close
Excellent trading scott, Congratulations!!
btw…peggy’s spiral forecasts she reports are always the futures contract. right now she reported 2091 as her updated target for pullback. which is 10 points higher than the original she gave two weeks ago before last weeks down draft
all documented on her twitter feed previously supplied by jeger
thanks for the kind words purvez… i am trying to be a little more nimble and open minded from the blasting i took last may. if you are interest, check out 61point8.com it is Peter Ghostine’s subscription account $240 per year. well worth it. he posts all trades in real time and you see his trading book. bullish/bearish/indices/stocks. in the last 18 months i have been following him, he has had 3-4 down months. if i wasn’t such a stubborn bear for the last 18 months and followed his trades solely, I wouldn’t need my day job. he is that good.
in his last 8 months (options only no stock trades) he has not had a down month and is up $175k. high month $32k in April low was $10k in July. just looking at it makes me wonder why i follow my own rogue trading ideas.
peter lost $11K Jan and $7k in march. made $17k in feb. so jan and march were his only down months in 2015.
Thanks scott, had a look around the site. Certainly knows his stuff.
ES must have a headache:
http://screencast.com/t/ybwE6mqRu
Weekly view is more revealing IMO.
As jlisi6 said, let’s stop out some bears at the resistance, and then let the bear party begin.
For my money….this time ES doesn’t get knocked on the head.
http://screencast.com/t/iZzhbg7Dlr
I agree, based on weekly.
RSI looking very dicey.
Knock on the shoulders?
Ssshh, or everyone will see it.
( I hadn’t til you mentioned it).
Target wold be 1522, mmm.
I thought the knock on the shoulders happened in early Nov.
this is the 9th out of the last 10 months with monster rallies during monthly option expiration…i should have gambled on some deep otm calls on indices on fri/mon
https://pbs.twimg.com/media/CRW1lZUWoAAo2yd.png:large
here is north’ys link again for your vetting
That is very interesting. Wow. Imagine doubling your money at every expiration.
Oh my purvez i am not sure why you and most nearlyneveryone else fail to t understand? Your comment…
“What that has meant is that ALL OTHER ASSETS are having to be liquidated to raise that USD cash. ONE of the MAJOR Assets caught up in that is of course Gold”
Gold is NOT being liquidated gold is being accumulated. In fact Gold demand is skyrocketing due to Asian buying.
And that my friend is the whole crux of the matter. Liquidation of PAPER gold is not a refelection of the true underlying fundamentals of the physical market.
What is so hard to understand?
When 1 contract theoretically creates 100 oz out of thin air with zero requirement for pyhiscal backing thus meaning that any entity can create as many contracts at their will as long as they have deep enough pockets, then that OR those entities can exert control.
I say it again…There is NO liquidation in the physical gold market and demand is at record levels. The COMEX is a sham and should be shut down.
Allan I do take your point about Comex vs physical. However what I was trying to explain was the reason Comex is down (and hence ‘GOLD’) is because people are liquidating there to find USD. I clearly didn’t do a very good job of that. My apologies.
Allan & purvez,
Comex existed when gold rose from $250 to $1,900. Weird eh?
The current gold price (and over the past 4 years) is simply a reaction to the confidence in markets, corporate profits and policy makers.
When that confidence starts to ebb away we will see gold rise again, then all of the manipulation nonsense talk will vanish.
The leverage issue is valid, and in 2034, when the USD collapses, Comex and XAU (and GLD) will see a rush from paper to physical. I look forward to that day, as the price move will be something to behold. Hope I live that long.
Allan, you’re a bright guy, surprises me you fall for the manipulation meme.
GM, mate who do you profiteered from that run up all whilst periodically amassing outsized short positions only to reverse after washing out?
Do you really think that it is coincidence that we currently have a situation where banks recently had have near record short positions while at the same time also had record low levels of physical available and that this is NOT manipulation??
How in hell does that in any way reflect the true physical market where demand is running high whilst in Ag most producers are underwater?
The COMEX like most paper markets were set up not to benefit producers but to allow the major banks another vehicle to siphon money, except tjat now it jas become so overwhelmingly lopsided that in the PM’s markets it has reached glaringly absurd levels.
The time is very near mate. They are fast running out of the ability to continue the paper scam because the physical market is going to reveal the scam for whatit is.
I can tell you categorically that the vast majority of physical supply is heading east and the bankers are running out of options to prop up their scam.
Cheers
I’ll just add that eastern buyers are paying a premium for physical ATM and that is why western bamks are having issue acessing large amounts of physical.
The amount of Australian producer Au heading through HK is at records.
As long as the idiot producers don’t get hoodwinked into hedging the banks will lose.
Allan, there’s a load of BS written out there.
I read other stuff, like this, which gives me another view (there are 3 parts, most just won’t be bothered to read it all to actually grasp how the system currently works. Each to their own):
http://research.perthmint.com.au/2015/09/16/fractional-reserve-bullion-banking-part-1/
I’ve heard/read similar points of view regarding Comex. However, if there is such a demand for physical, then the price of gold and silver futures and physical would both reflect that. If there’s strong demand and limited supply, the price will go up. Physical and paper cannot disconnect price-wise. Because price has been declining for the last 4 years, that tells me that there is plenty of supply and not strong enough demand (yet) to reverse that trend.
It’s true that there’s a lot of paper supply in the futures contracts. However, if you’re long and you want to take delivery, you can do that. A friend of mine once took delivery on silver futures contracts. He drove to Comex in New York and had them load his silver into his van. Of course, if every holder of a long contract wanted to take delivery the same month, Comex would default. I suppose it could happen, but it hasn’t yet, and I don’t see anything on the horizon that indicates that it will.
Top comment pc.
http://uk.businessinsider.com/tom-lee-on-why-stocks-will-rally-2015-8?r=US&IR=T
Top man this guy if anyone is interested in making money. I am long all indices and holding into year end.
haha, you flip flop more than the footwear:)
As one should in the search for profits. I guess overvalued markets are just opinion. That S&P arc is still in play though. I expect it to smash through the top.
Krish, past FOMC and now well in to the second half
of November, you can make a strong case
for that positioning.
Staying openminded rather than wedded to a particular
viewpoint is usually the bast way to navigate markets.
Definitely true. I am divorcing myself from expecting the Central bank policies to certainly fail. Opening my mind to the idea they may actually work really well although it is my less likely scenario.
Krish have you seen the action since this morning? Not bullish. I’ve been trying to prepare a simple chart to show the ‘bearish’ case ….but things keep interrupting. UGH!
The only thing worrying me now as a bear……where is Nic?
I was thinking the same thing yesterday.. Yesterday should have been EXACTLY the moment he returned from vacation….. hahaha
But yes, a bit concerning… 😉
As well, where’s Richard??
I miss his detailed technical/fundamental analysis of why the market will go higher……..written hours after his detailed technical/fundamental analysis of why the market will go lower…….written hours after his detailed technical/fundamental analysis of why the market will…………
Scratch that…. Not really….
Errrr……..ok let me explain my comment then as it seems to have been misunderstood…..:)
Krish: ” I am long all indices and holding into year end.”
This statement said to me that you are now getting wed to *that* view for the next 6 or so weeks, and this view has been preceded by others that seem quite certain of the outcome. The problem as I see it is not whether one changes one’s view and how often (we should), but really how often one gets wed to a new viewpoint. As others have pointed out, this can make it difficult to trade but I understand some need to have some certainty (or be wed to a viewpoint) in order to trade.
Apologies if this was not clear, and no criticism intended. It is difficult to tell through this media how people actually think – we can only go by what is written.
All the best with the longs until 2016, although I suspect there is a possibility that you will change your mind in that time..:)
J
A whiff of interest rate rises, and stock markets react in the way they always react in such circumstances.
The partially cock-headed among you should continue to go short at 2093 (SP500).
The fully cock-headed, like GM, can wait and do his usual trick of shorting at the forthcoming lows over the next eight weeks. Show him some respect by refeering to him by his full name: https://www.youtube.com/watch?v=Daa8ZnxC-0Y
Nothing beats a blog meltdown, such fun to observe.
Please keep posting Mark, I can sense boiling point is nearby. The next 2 weeks price action should exert just enough pressure. Wouldn’t like to be his cat.
at least Nic is consistent as rainbows and unicorns! mark reminds me of the soup nazi from seinfeld. “no bear soup for you!”
Cock-headed, never heard of that one. Off to urban dictionary to uncover it’s true meaning…
Plenty of cocks here I suspect, I don’t rule myself out and choose to view it as a compliment. Thank you.
J
Here’s another must read from J P Snider of Alhambra….and this time it is almost comprehensible!!
http://www.alhambrapartners.com/2015/11/18/swap-spreads-refute-not-just-recovery-but-economics-as-a-science/
Thanks Puvez, that article linked to this article on Jobs, which further confirms my views on jobs. Both articles are very telling indeed.
http://www.alhambrapartners.com/2015/11/12/job-openings-and-jolts-crossed-signals/
This is the DJIA from the 15th Nov bottom. Yesterday I said that I couldn’t see how we could have a zig-zag given how far the first wave had travelled and how little the down wave had achieved. Well I’m changing my mind (again). Although the ‘B’ wave is shallow it is unmistakeably down sloping and the ‘C’ wave has reached just over 0.618 of wave ‘A’ length. That in my view is ‘acceptable’ as a ‘C’ to ‘A’ ratio.
http://postimg.org/image/5xg18llab/
So…we are back to having the option that wave-2 ended at this morning (i.e. overnight for the US) high OR what I had suggested yesterday i.e. a Flat / Expanded Flat.
The way we’ll know which it is… is if the next down wave is ‘hesitant’. IF that’s the case then we are in the ‘b’ wave of the flat/expanded flat. However if there is significant strength and it looks like a ‘water fall’ then we’ve started wave 3.
G’Luck to all
Again, a really good, actionable, thought process and plan… Thank you, Purvez…
Huge asset to the board…
I’d love to see the waterfall take over right about now, and if you ask me, it’s all set-up for it, but alas….. *big sigh…*
Mark, no need to get personal.
If you have a different view and are happy with it
then great, it should not make any difference if
someone has a different take – your own positioning
is what matters surely.
Markets are a difficult call atm, but yes we are
heading in to a seasonally strong period (usually).
I continue to see layoffs by smaller companies that add up to quite a bit if you consider the income levels. Another example, 1000 emlployees from Ctrix Systems. Well paid technolgy jobs, probably equal to about 4000 retail jobs. Do not discount these job losses and do not think that jobless rate means anyghing. Labor participation rate, which was stable through most of 2014 has plumeted in past 6 months. If you are so inclined to believe this sets up a bullish scenario, more power to you. The economic fundementals are crashing and the market will follow. Feedback cycle just starting. Watch Christmas sales numbers. Watch Labor particiapation in Feb. after Seasonal jobs collapse.
Jafree
Banks are laying off big style over the next year or so – probably around 150k jobs and those are reasonable earners too…..
Yes, I have covered some of those larger layoffs here as well. Basically, this looks like a cycle of most layoffs in a reducing revenue time. Layoff the highest paid workers is the theme. This will have an affect on the economy and the market. Much of the anounced layoffs have not all even occured yet, but if I am right, the fear of layoff will greatly affect the Christmas shopping season. An anectdotal data point that I saw on the TV news is the praise of the large amount of temporary jobs being created by Seasonal factors. My Reaction: WOW!!! Really??? Are we that desperate to point out the normal seasonal jobs? That it is now news? Too me the jobs picture is the most worrisome for the economy and the market.
FWIW, I added to my QQQ short at 113.72.
J
Just an update, after going through charts last night:
S&P/HYG ratio just hit a new high yesterday, and HY bonds still moving lower…
This is never good for the market…
Money-flow seems VERY weak into most of the stocks I look at every day, and it’s worrisome…
The “FANGS”, in particular, are rallying on ~vapors~…
If I had some real balls, i’d be shorting Amazon, Netflix, Google, Microsoft, Facebook, etc, right here, right now….
And options expire, once again, tomorrow… As has been pointed out yesterday, the market’s been rallying into the expirations quite regularly for months now….
And falling off substantially afterwards too…
I am looking at that same thing happening again, right now…
And this one looks like a big one coming up…
Just my thoughts… I am ~plenty~ short, using leveraged ETFs…..
Hi, Berry. Thanks for your comment. I have a question. What’s the best way to check Money-flow into stocks? Thanks.
not berry, but i can help. @northy northmantrader from twitter puts out daily charts that are on par with John Hampson’s. John has even borrowed them from time to time. he put out a very dangerous looking set of 3 3charts earlier today including money flow
http://northmantrader.com/technical-charts/
Thanks a lot , Scott! And sorry Barry. 🙂
Hi James;
I use the Metastock program, and then it’s just a matter of using whatever indicators you want to use… I have a few (indicators) I’ve built myself, but the Money-Flow indicator is built-in…
And of-course, you’d want to look at daily data, not monthly, although the same principle applies…
Here in the US, things will be quiet for Thanksgiving, and it would probably rally as it does pre-holidays. Everyone would want to talk about FANGS over dinner, and so the sale will probably be next Friday. Just in time for the full moon too to give her love to Richard Issacson.
I know krish bugged out of the shorts.. but this graph is troubling: http://4.bp.blogspot.com/-EZnGqaDPyLY/Vk4FgWUODEI/AAAAAAAAn-8/6Qz2GIunMxA/s1600/rsp_ratio.png
good chart pulp! hyg is a whisker away from its aug 24th crash lows and 2% away from its Sept 29 crash lows. i am loaded for bear. spy put spreads and even added some uvxy call spreads 12/11 against 12/4s. my hedge was profitable apple call spreads, but likely to take those off tomorrow.
my best buy puts ended up as a small gain, got greedy and didn’t do a put spread.
Nike seems pretty confident in a continuing market recovery for years to come based on its big share buyback and dividend boost. This type of stuff should help propel the markets upwards.
historically quiet….spiral is calling for a low 11/24. bradley turn date 11/25. let’s hope that we don’t have a black swan involving attacks on us soil. i’ll take any other black swan’s that are offered up though to fulfill the spiral low!! spiral has been spot on the last 2 weeks.
Thanks I have been eyeing 11/25 due to post-holiday and full moon, but now I see Bradley and spiral too!
don’t forget post monthly options expiration. 9 out of the last 10 months, i believe followed with a decent pullback the within 2 weeks. the missing month is august. the pull back started during monthly exp. and flash crashed the monday after.
If we rally big tomorrow, I might add to shorts.
no meaningful pullback after 10/16. just another 10 pt rally higher off the 9/29 lows
this is another one of northy’s charts
This is what I don’t understand; there are always two people to every transaction, a buyer and a seller. Some people want to buy others are selling. If you sold and think the market is going lower you should be happy and not talk trash to the buyer because they helped you out of your position. If you’re a buyer, you should be thanking the seller for those shares. If you have opposing views there’s no need to talk trash or try to proclaim who is right or wrong. You both should just believe you got a good deal and leave it at that.
Krish? said buying and holding into year end. What’s wrong with that? We’re in a seasonally strong period within a seasonally strong year. Swing support on the SP-500 has NOT broken. If you’re playing the higher highs or lower lows game, the trend doesn’t switch to bearish until 1820 is taken out.
Get along peeps, or you’ll end up like Daneric’s blog.
Most people have a need to identify themselves and others with labels and/or groups. Having said that, our society conditions us to think that way so it is very difficult not to automatically do this.
My comment was purely to point out getting married to a viewpoint may not be ideal. I wish him all the best and do not care whether he went long or short – it has nothing to do with me:)
The 1820 level is in my opinion quite right in terms of setting a lower low, but we have also failed to make new highs – so the next retest of that level is going to be very important to those who follow price.
GLA
J
Further evidence that the COMEX price of Ag and Au does not reflect the actual fundamentals of physical markets.
This just covers US and Canadian Ag coins. Aussie silver Kangaroos are exploding to record sales to levels that are triple above previous sales levels.
Australian Ag production has officially declined by just over 30% in the last 12 montjs and I have it from good authority that that figure is likely to increase to nearly 45% annually next year.
All whilst Indian imports of Ag are hitting unbelievable levels.
And folks try to tell me that with the Ag price, which is pretty much determined by the paper price, is all normal………to wit I say C%#P!
http://www.silverdoctors.com/rising-silver-investment-demand-puts-record-squeeze-on-north-american-supply/#more-60365
okay. Can you explain how paper price can be different from physical price and not have arbitrage players cashing in on the difference?
pC who says they haven’t been! Do you know they haven’t?
Why are physical holdings at COMEX at record lows and as far as premiums go just go and buy physical ANYWHERE. Nuff said because that will settle it.
Oh and BTW. Producers selling direct and at a substantial premiums is nothing out of the ordinary.
Of course it goes both ways as I have seen many go bust for selling under as well.
so you’re saying that the reason physical holdings at COMEX are at record lows is because more futures traders are taking delivery? I wonder where we could get data regarding that. Like what percentage of long contracts recently took delivery versus the percentage from 1 year ago, 3 years ago, etc.
Regarding premiums to buy physical, hasn’t that always been the case? Are the premiums higher today than they were a year ago or 5 years ago? APMEX has gold bars for 1105. You’d expect some premium because that’s how the dealer makes money. I don’t track that data, don’t even pay attention to it, but every time I’ve looked at it, there’s premium for physical. So that doesn’t mean anything one way or the other IMO.
Allan
I hear what you are saying and agree. I actually believe that the market prices for whatever the instrument is, Gold, Vodafone, SPX and soon are actually almost always wrong. Occasionally the instrument will reflect “true value” as we swing both high and low around that number. Obviously one can define “true value” in a number of ways, but if you imagine a shallow rising line reflecting the “true value” and huge oscillating curves that move in wide arcs around that line, that is what I perceive has been happening for many decades. Of course if you look at credit expansion and contraction, the image looks very similar, with GDP or similar being the rising centre line. Whilst you are very focussed on the shiny metals in particular, my view is that to a large degree this is happening in a lot of areas as a natural phenomenon of the “money structure”, and the use of leverage and derivatives that dwarf the actual market in question.
all vimho.
J
I would take the opposite view, that price is always right! Why? Because that’s the price that buyers and sellers agree on right now. Any other price is a lie and here’s why: If you believe price should be higher, good luck trying to find a buyer. If you believe price should be lower, good luck finding a seller.
Portfolio is up 1% since I switched to long. Bought some December puts today in case we get a post options expiration drop. Hopefully Super Mario will help boost the Dax back to 12000+ as I’m setting an ambitious target of 10% portfolio gain by year end…only 9% left to go.
You have the earlier November highs to break through
first, if that happens an attempt at new all time highs.
On new all time highs for US markets we may well end
the year with a rip your face off rally.
But that is a lot of may’s.
We look to be finely poised at this point.
Not only that. My new view is there shall be no such thing as a bear market for the foreseeable future. I expect many pullbacks but nothing that will change the trend to down. Who cares if there is a global recession. Stocks will continue to rise as they have not reflected reality for the last few years. Dow already up 140 points! Christmas has come early! The more irrational my thinking…the more profitable my trading. Keeping those puts in place in case it all goes terribly wrong 😀
How much are you hedged? Hussman funds has puts too and it hasn’t worked out too well for him.
My puts enable a 100% hedge should the market fall enough. I very much doubt they will be needed. I will just place stops to cover the put premium once the market rises enough.
Hussman must be overhedged.
http://www.bloomberg.com/quote/HSGFX:US
Check Hussman in 2-3 years though.
check out the spy vs percentage of sp500 stocks above their 200 day moving averages.
http://northmantrader.com/technical-charts/
i have liquidated my aapl call spread for 25% gain, bought back the short put spreads against my longs.
now holding 12/11 210 puts / 12/4 208.50 puts 12/11 uvxy 30 calls
and a small batch of agn call spreads 310/322.50s put on yesterday with agn at 302 expiring next week. as they say….loaded for bear.
no targets from spiral yet, but as of now expecting a low 11/23 then another low within 5-7 days later. bradley turn date 11/25. last turn date was 11/10 of same nature.
i will likely sell the agn spread before monday. may be bought out monday, may not. may flip a coin before close to see if i hold it for monday:)
anyone else other than northman trader notice fang is a little toothless on this spike higher to retouch 210 and qqq 114.40?
facebook
amazon
netflix
googl
not doing their monster moves on a day we are up this big.
things that make you go hmmmm
Noticed it, and mentioned it yesterday morning….
~Vapors~….
With today’s ramp higher one could be forgiven for changing the count on the DJIA as shown here:
http://postimg.org/image/4z2afu52x/
However wave 5 would be the weirdest ‘impulse’ wave I’ve seen ever. In fact even the internals of wave 3 don’t come up to a clear 5 sub waves up. So until this thing pops above the early Nov high I’m labelling it thus :
http://postimg.org/image/cphasb3cd/
Call me stubborn, but no EW rules have been broken here. Just a lot of pain for the bears. But then that’s what wave 2’s are meant to do….convince everyone that the previous trend is back.
BTW Barry, thanks very much for your continued compliments which are very much appreciated, but perhaps it may be better to wait to see whether the markets are doing anything remotely like what I’m proposing. LOL.
http://www.zerohedge.com/news/2015-11-14/goldmans-clients-are-suddenly-very-worried-about-collapsing-market-breadth
advanced decline
Advances & Declines
TSX TSX VENTURES NYSE AMEX NASDAQ
Advancing Issues 426 (38%) 155 (28%) 1,962 (64%) 799 (66%) 1,692 (67%)
Declining Issues 501 (45%) 138 (25%) 1,008 (33%) 379 (31%) 749 (30%)
Unchanged Issues 181 (16%) 263 (47%) 83 (3%) 26 (2%) 91 (4%)
Total Issues 1,108 556 3,053 1,204 2,532
New Highs 6 3 59 6 60
New Lows 27 10 75 15 54
surprised there wasn’t an etf for fang and nosh introduced this year
What are the 3s like please purvez?
And what comes after a 3 in your view?
Thanks.
Aaah the 3s. The 3s are when the populace realise that the 2s were frauds. That’s when the stampede occurs. Somtimes a 3rd pauses and retraces but….then starts down again. THOSE are the 3rds of the 3s. A JOY to behold on both the down and up side (IF you are positioned right – OUCH I can vouch for that, sadly!!) It’s what our host calls a waterfall!! Often they GAP in the relevant direction quite severely.
For the moment as I’m typing the DJIA has completely retraced the ramp from the opening. Let’ see if the fireworks start now or the CB’s fire engine arrives in time.
Thanks p, they sound like fun.
GM, only IF you are on the RIGHT side of them. Otherwise you get flattened sharpish.
Wishing ALL here a very good week end.
Attention all stray dogs – those of you who have made these comments your permanent home, and who instinctively insist on barking away any perceived interlopers – read no further!
Interest rates increases (6 of them) during 1999 didn’t hinder the stocks bubble then: http://global-rates.com/interest-rates/central-banks/central-bank-america/fed-interest-rate.aspx
Nor will the forthcoming interest rate increases.
Then there are the other strong similarities between then and now, as previously mentioned by Steve T and myself.
http://moneyweek.com/spread-betting/i-made-800-points-by-shorting-a-bull-market/
Nice to see Mr. Burford on the long side too after recognising this market is going higher. Dow at 19000 would be very tasty for me.
The one crucial thing missing from 1999 and today is a strong economy and incredibly strong employment. So if you believe the FED can keep this bubble going, more power to you, I am focusing on the downside and betting this bubble cannot continue with poor economy and jobs.
Happy Trading!!!!
Today’s J P Snider’s offering from AlHambra mentions that there has been a huge spike in Credit Card debt since March but there has been no equivalent spike in either retail sales or imports etc.
He surmises that people are using credit card ‘cash’ to live off. Are FANGS the recipients?
That is interesting and would contradict the thoughts that people are paying off their debt with the excess cash from fuel prices. Thoughts that I have heard in the media to explain why spending has stayed depressed.
JaFree, the more I dig around the ‘real infrastructure’ the more I realise that the proverbial Wolf may not even have to ‘PUFF’ (just ‘huff’) to blow the house down.
Scary thoughts.
Mark likes to reflect on interest rates, and rises. Well, reflect may be a tad generous.
I doubt he’s ever looked at the yield curve, or considered that interest rates are set by the market, not the Fed.
Here’s a link:
http://www.treasury.gov/resource-center/data-chart-center/interest-rates/Pages/Historic-Yield-Data-Visualization.aspx
Compare today’s yield curve with mid-98 (nominal), then compare it with (for example) February 2009.
Then draw your own conclusions as to what the yield curve is telling you.
Or, if you prefer, wait for the Fed to tell you they’re raising some meaningless overnight rate by 0.05%, because they can do that.
Mark,
Jeno makes a good point..
Thank you for buying…. 🙂 *big hug*
Mark, I’ve read all your posts AND ALL THE RESPONSES. No one to my recollection has ever criticised you on your analysis. Yes, they’ve questioned it but there has been no attempt to drive you away.
SO please may I request that you stop saying insulting things unnecessarily (‘stray dogs’ being one of them) and just present your analysis.
You and your analysis are welcome here. Most of us like a good debate even though we have ZERO chance of being swayed by the ‘other’s’ arguments…unless ULTRA COMPELLING (which it never is – ;-)) sadly.
So once again please leave the ‘name calling’ to genuinely stray dogs (if there are any in your area).
Many thanks
Hi Mark, I like the fact that you post but I have to say the tone of current posts and those of months ago differs markedly. It’s almost as though you’re two different people (I hope I’m speaking to the same person, lol).
I recall you challenging John in his analysis of solar cycles and I thought you brought a different and valued perspective (and, at least as far as large cap stocks go, a more correct forecast). But the tone was less personal than it is now and more focused on just the facts, ma’am.
What happened?
And by the way if we are to enter a stock market bubble, it would be folly to think that interest rates would hinder it. That’s the entire point of it being a bubble, the “normal” market behavior doesn’t apply.
Selling my December SPY 214 calls and rolling that into Dec SPY 210 puts today.
geno, YET ANOTHER nice trade. Congrats and MANY MORE!!
We’ll see how the puts turn out now. Moon cycle strength, seasonal strength and year class strength. I’m not going to mess around too much with these puts.
Good job, Geno. I also was in calls this week, and am remaining so until next Wednesday or until we reach 2120 whichever comes first.
Peter_,
“Is it not time to put the possibility (however far from any comfort zone) of a Paradigm Shift on the table? At the very very least consider it. Give it at least an equal opportunity for being weighed.”
You get the award for the first time I have heard “It’s different this time” on this possible Market top. If anything this is one ingredient that has given me pause. Not that it may actually be different this time, but lack of people actually mentioning it.
However, usually you hear it during boom times like 2000 top. This is not a boom time top, therefore you do not hear this talk. You need Main street success for wide spread thinking of this type. We don’t have it and in fact it’s the opposite. Main street has been and will continue to be depressed for at least two more years (IMHO). What we have here is more of a banking crisis similar to 2007, you did not hear “It’s different this time” argument back then either.
All tops have similar features, but not exact. The market continues to find ways to fool the masses.
I find it amazing how some posters come here and talk down to others so much.
One thing i have found is that male/female/old/young/black/white/red/blue/left/right whatever – we’re all pretty much the same.
it’s just the ptb that foment trouble
if anybody posting here was such a perfect market genius
they wouldn’t even be here
they would be with family on the beach or in the mountains
have a great weekend all
I’m pleased (already today) to see FTSE futures retreating to their daily lows, with a red candle (that probably has a fancy name) that looks weak to my unbiased eyes.
Lots of gaps down below, including way down at 5900.
Thanks to all of those that comment here this week and previously, it’s been a fascinating lesson in market dynamics and human emotion. As I visit quite a few other blogs out there, I feel strongly this is THE best spot on the internets for all-encompassing in-depth multi-angled market analysis, lead by Mr Hampson, quietly and calmly, and with many interesting and astute comments from those who visit. If my comments are sometimes a tad sharp, I apologise, I try to remain objective and unemotional, but, you know, I am only human, flawed, but striving for perfection (lol). I like to read different views, but if they’re posted publicly, I feel it’s reasonable to challenge them or ask for explanations. I try to share some snippets too, and always happy to debate and defend my view.
Have a good weekend, especially those of you in the bear camp.
Fed to hold expedited closed door meeting on Monday…. i’m sure its to change strategy toward the next round of QE instead of intead of raising interest rates. maybe its to swap their balance sheet for FANG and NOSH?
maybe it is to determine what to do about the transparency that the house is demanding?
or perhaps they want to chime in on the refugees taking over Europe and moving them to the united states. seems unusual though.
also interesting that it occurs the day after 11/22 a 33 master number
just before the full moon cycle and just after a significant astrological date 11/22
same day the next low spike is expected from spiral and before the bradley turn date and at a time when the advance decline line and hyg to spy has never looked more precarious
but there i go again rambling on….should have probably posted this in godlike productions….my bad
quite likely i am completely wrong again and the market will be up another 500 points next week
http://www.zerohedge.com/news/2015-11-20/transparency-fed-why-janet-panicked-about-houses-form-act
http://www.zerohedge.com/news/2015-11-20/fed-hold-expedited-closed-meeting-monday
scott/purvez, that’s a classic ZH scare-headline.
Check the schedule here, they have these meetings all of the time.
http://www.federalreserve.gov/aboutthefed/boardmeetings/meetingdates.htm
via peggy and spiral at 1 PM cst
Spiral update – price target 2042-2047. Low expected 11/23
Thx scott for that info. Also since you drew our attention to the ‘opex’ phenomenon, I’m getting wary of today’s initial retracement down.
I’m wondering if ‘THEY’VE’ twigged that we’ve twigged.
OK I’m gibbering again so it must be time for signing off and having a ‘small…ish’ Cognac.
Wishing everyone a great weekend. Yours is almost certainly going to be better than mine. I’m on pond clearing duties….hope it rains….NO BUCKETS DOWN!!
Dax:
http://screencast.com/t/XTU2Sxh2orfe
PALS next week SPX:
Phase: + M T W open, – Th Fr
Distance: – from M open to Th (post perigee)
Declination: + all week, moon crosses equator moves to North
Seasonals: + all week, Thanksgiving Rally possible
Summary: Staying in s.t. calls until Wednesday Full Moon open. Then will move to cash or buy puts intraday.
Anyone interested in some really unique and useful historical stock market astro stuff check out Danny at Lunatic Trader.com. His archive section has some real useful articles, imo.
Do you have a twitter account Valley?
https://twitter.com/SolarCyclesNet
https://twitter.com/platypusfoot
https://twitter.com/lunatictrader1
https://twitter.com/NorthmanTrader
No, I kind of like to read and post on this site only because of its unique focus and spirited debates.
My Dax 4 hour chart shows this gap to be filled: http://www.screencast.com/users/prince3000/folders/Default/media/e3504c19-8758-42b4-93cf-309897431804
http://stockcharts.com/h-sc/ui?s=%24INDU&p=M&yr=18&mn=0&dy=0&id=p67584604569&listNum=5&a=161952233
some traders have called for new high
one trader suggested jan 16 time frame
new high at kiss of upper line in mid jan would fit the bill
Slater9 .. your lines are missing .. can you repost 🙂 (?)
lines were there when first posted//// i checked
let’s see how long they stay this time
http://stockcharts.com/h-sc/ui?s=%24INDU&p=M&yr=18&mn=0&dy=0&id=p67584604569&a=161952233&r=1448154099735&cmd=print
New post out