US earnings: blended earnings growth stands at -2.2%, compared to an expected -5.2% before reporting began. So that’s quite a beat, and may account for some market fuel, but still negative. Blended revenue stands at -3.7%. With meagre sales revenues, companies have turned to buybacks and M&A. Take out the effects of oil and the dollar and earnings look better. The question remains whether oil and dollar are signs of creeping disease or whether they are more isolated issues.
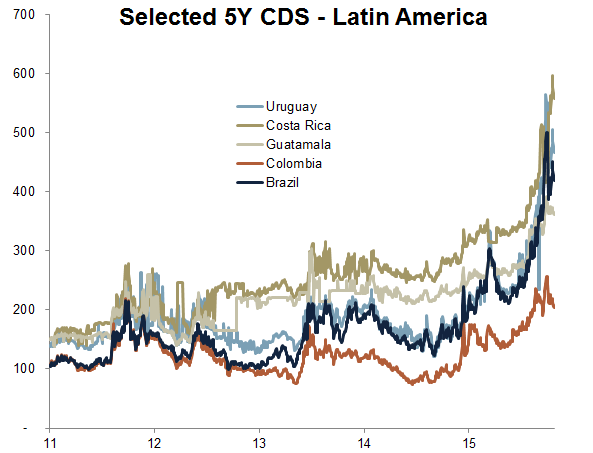
Weak oil, weak commodities, strong dollar and global manufacturing flirting with recession. These are the main problems in 2015. As a result, emerging markets with more reliance on manufacturing or commodity exports are in trouble. Some refer to this as the 3rd phase of the financial crisis (P1 US financial system circa 2008, P2 Eurozone circa 2011, P3 Emerging markets 2014-5). The question is whether the world economy can recover here again and ease us away from those issues.
Disinflation remains the dominant theme. Deflation is a threat, but if we take out energy again then prices have held up better. So for now, CBs are not reaching their inflation targets but nor are we slipping into deflation. Somewhere in between.
The strength in 2015 remains in services, particularly US services. As we approach the end of 2015, leading indicators for the US have weakened whilst they have improved in China and Europe. Maybe then we are going to see another rotation in outperformance, keeping the global economy and equities supported. Or maybe the negative feedback looping is now too entrenched. If the US dollar is now kicking off a new leg higher then we are likely in for more trouble, so something to watch.
The stock market leads the economy, not the other way round. We can summarise the above by saying that the global economy is fragile and therefore that how equities perform from here is likely to dictate whether we tip over the edge into a deflationary recession or stay in disinflationary weak growth. The situation remains unclear for equities. Neither bulls nor bears can declare victory at this point. Evidence in indicators suggests a topping process has been in progress for 2 years. Torturous for both sides. Plus, we can’t rule out the prospect of an even longer sideways range trade.
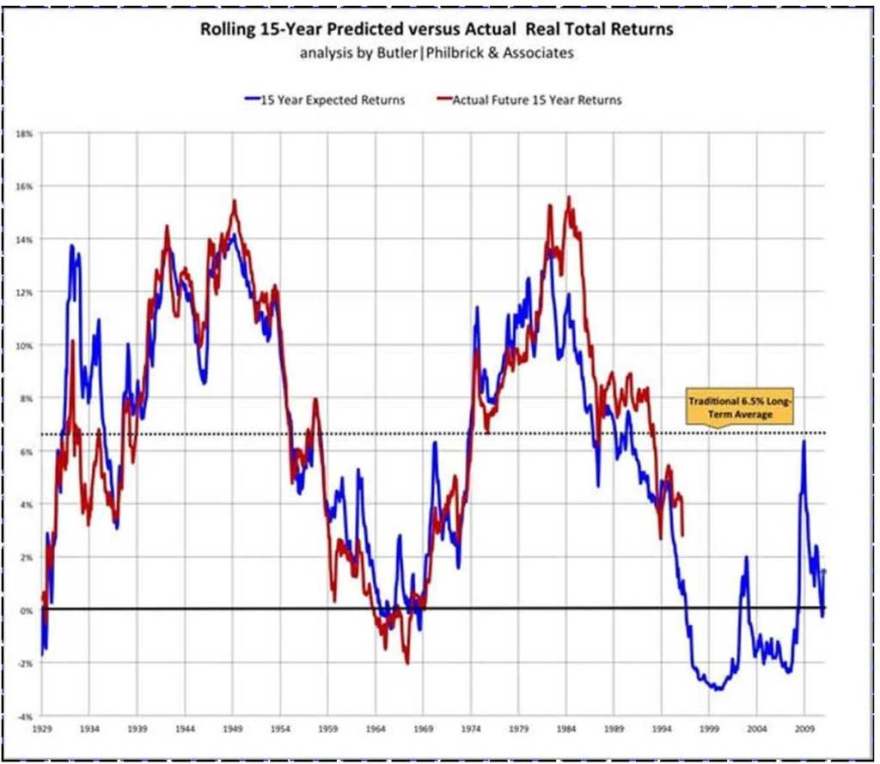
By demographic trends, the age of the investor is over, at least for the foreseeable future. This is echoed in a bunch of charts that extrapolate future returns based on current valuations, market cap and more. They suggest the market is going to flirt with zero returns over the next decade.
Source: AmericanAnnuityAdvocates
Equities struggled to make any more headway in H1 2015 with valuations in the 97th percentile historically, sentiment and leverage at all time record extremes, allocations to equities similar to previous major peaks. With a shrinking pool of buyers under demographic trends, there is a question mark over how stocks could now resume a bull market higher from here given the market appeared so saturated earlier in the year.
Here we see Rydex traders were at extreme allocations earlier this year equivalent to the 2000 mega peak, and how the recent rally has brought them back to fairly extreme levels.

Source: Stockcharts
They appear to have been playing the Biotech mania ($IBB). Biotechs are valued at 7x price to book, which is the same as the Nasdaq was valued at, at the 2000 peak. Can Biotechs and Rydex traders resume upwards and make even greater highs here, to beat the biggest mania of all time?
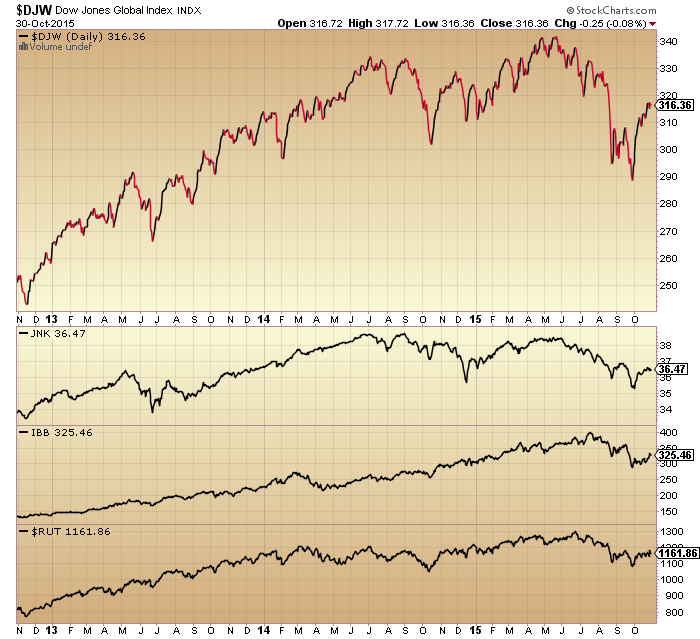
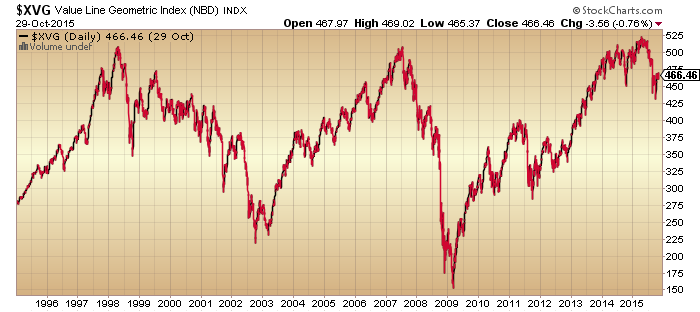
The Dow Jones World index appears to show a topping process that ended in May 2015. If that is so then we ought to be on the cusp of a new leg down.

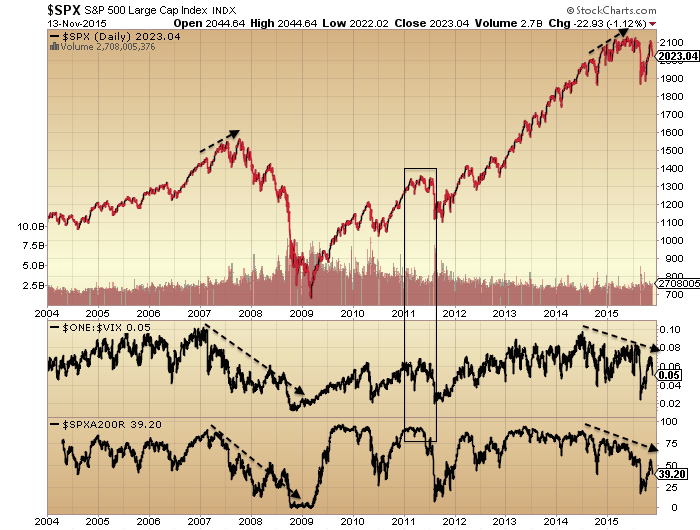
Stocks to bonds and stocks to dollar continue to show a peak in mid-2014, equivalent to Jan 2000 or June 2007 as a lead for a bear market.

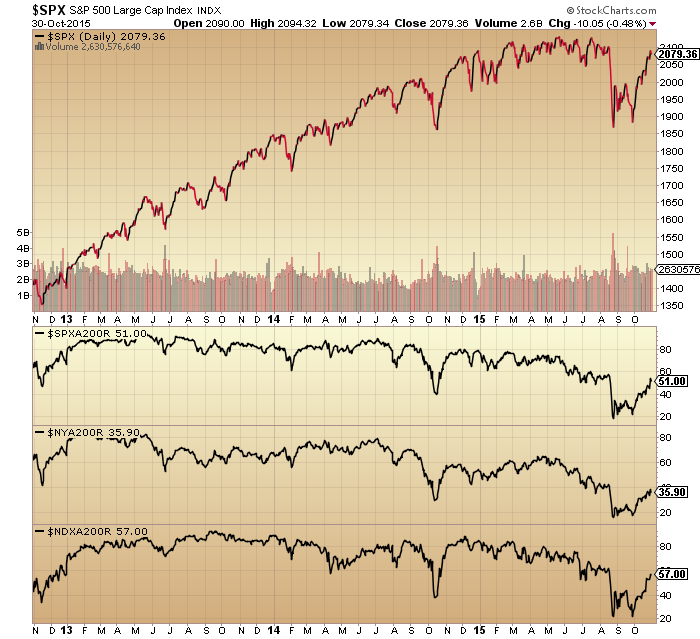
In both that chart and the Dow World above, new highs are required by the bulls to negate the bearish patterns. New highs are some way higher, meaning that more US large cap indices could go make intermittent new highs here, without invalidating these bearish charts.
However, levels of insider selling and puts-calls suggest the rally in equities is unlikely to get much further.
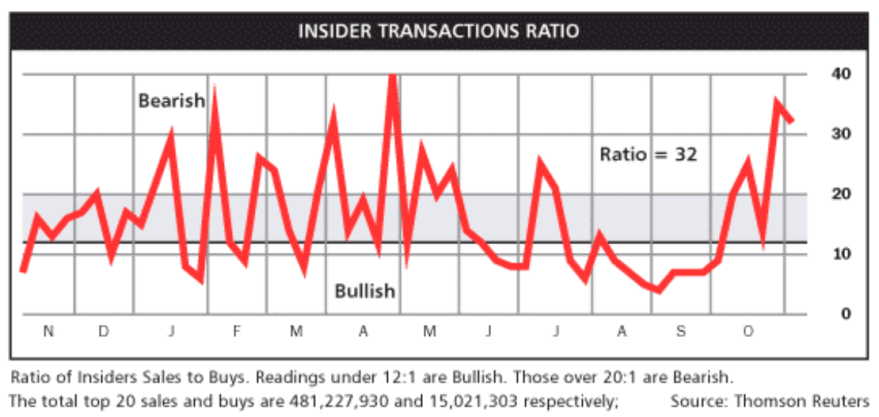

Source: Barrons
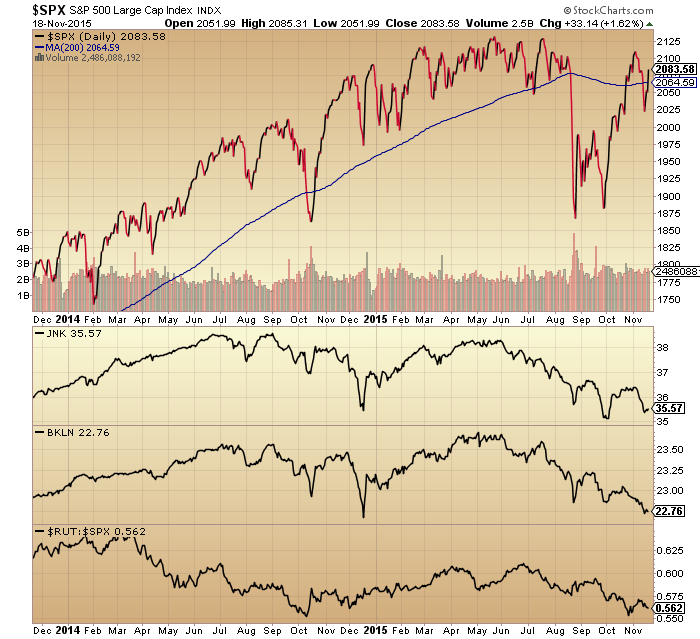
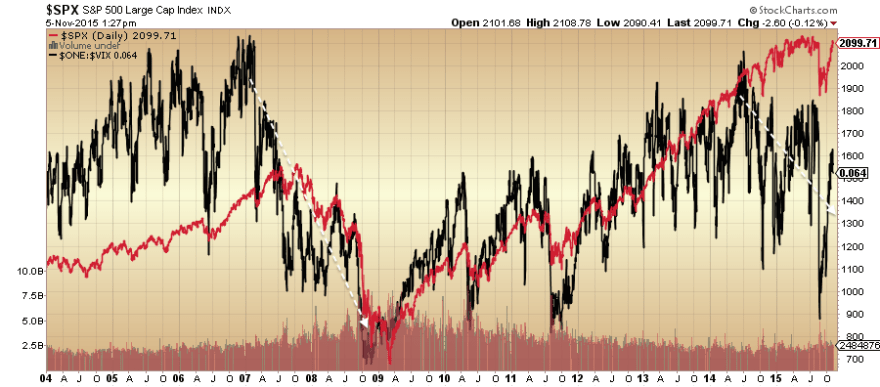
Divergences in both volatility and credit spreads also cast doubt on equities breaking out of their overall topping arc.

Cutting across to gold, it suffered a fresh collapse this week, with commercial positioning having moved to short. As the second chart below shows, it may need to fall further yet, to new lows, before a bottom is found.
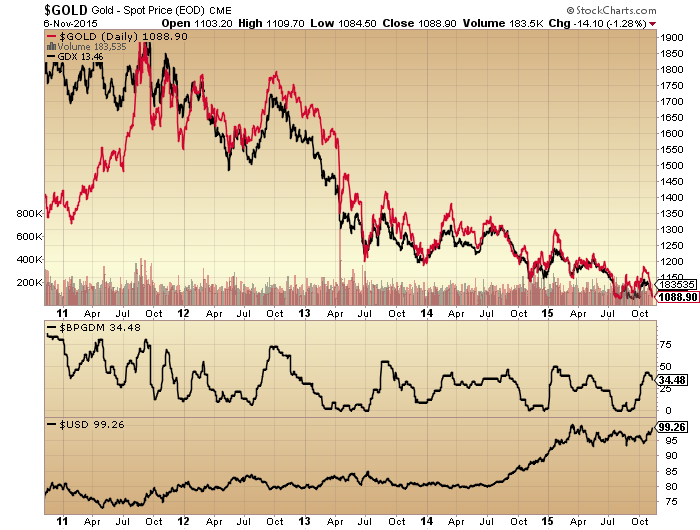

Source: The Daily Gold
This would fit with the new up leg in the US dollar which appears (tentatively) to have kicked off.
Regarding the sun, October was a period of low geomagnetism and increasing sunspots, both supportive of the rally in equities. Geomagnetism is back in progress the last several days and should this persist then it should act as a headwind to stocks.

Source: Solen
All those indicators that I previously pointed out as peaking mid 2014 with the solar max remain just so. Stocks:bonds, stocks:dollar, vix (inverted) and credit spreads can all be found further up the page showing a June-July 2014 peak which is still honoured. So, for now, the idea that the mania peaked out with the solar max still has a multi-indicator case.
In summary, the big picture suggests equities are going to struggle to break out bullishly, both in the near and longer term. Equally, however, stocks have been bid back up strongly off the October lows. Therefore, we remain in limbo. Near term indicators suggest stocks should be ripe to tip over again. Meanwhile gold may need to washout further to new lows before finding a bottom. Those two don’t seem obviously compatible, unless the US dollar rallies strongly, which could well be initiating.
Lastly, global liquidity has turned negative as central banks have spent to defend their currencies and propped up their economies. The last time this occurred was 1980 to 1985.

Source: Nowandfutures
But what saved our fortunes back then was the upturn in collective demographic trends, shown here:

Now note the collective demographic downdraft that is in progress from here until mid-century. This suggests central banks are going to have to keep defending their currencies and propping up their economies despite massively ballooning debt and shrinking reserves already. It is very hard to see how the world can get out of this trap.