Weighing up whether the equities bull market that began in 2009 is topping out here, we can look to fairly reliable historical topping signals, and I can summarise as follows:
1. A topping process, normally months, with reversals of reversals of reversals in a range – yes, up and down legs since May within overall range
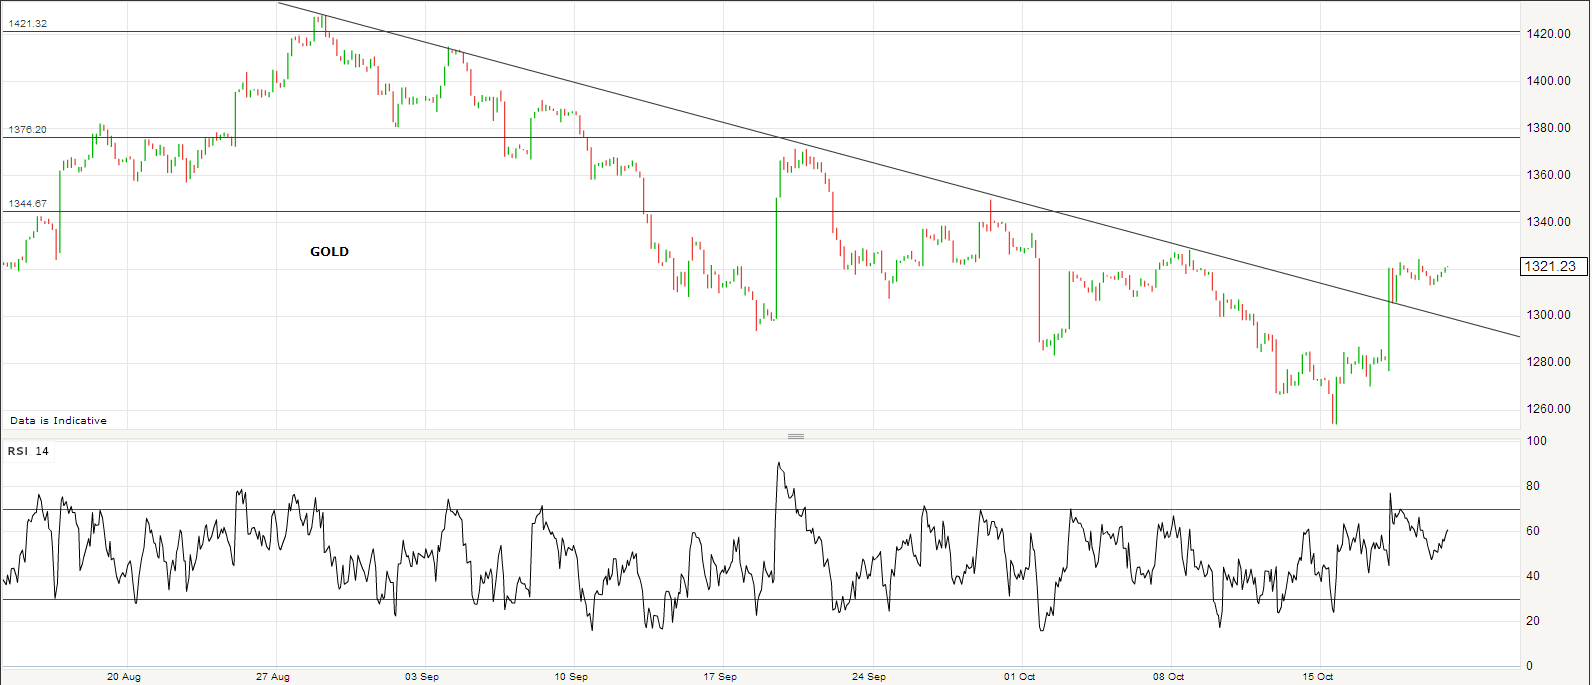
2. Evidence of overbought and overbullish extremes (such as RSI and sentiment surveys) – I found this not to be too reliable as an indicator once the topping process has begun, but nonetheless, investors intelligence bears would be one such current reading – click here for link
3. Breadth divergence – yes, advance-declines or Mclellan summation index would be two
4. Cyclical sectors topping out before the index top and money flow into defensives – nope, not happened meaningfully yet
5. Major distribution days near the highs – we have had some 90% down days since May
6. Yield curve flat or negative – since the debt impasse began, treasury yields at the shorter end of the spectrum have indeed inverted, the longer end remains healthy
7. Tightening of rates through rising yields – we have seen a doubling in treasury yields over the last 6 months
8. Excessive inflation – nope, we are seeing global disinflation
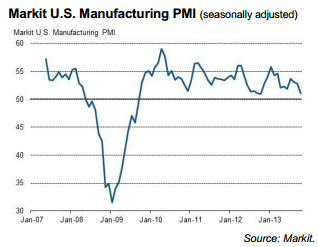
9. Rolling over of leading indicators and recession model alerts being produced – combining OECD, Conference Board, ECRI, narrow money and Recession Alert, we don’t yet see this in any meaningful way
10. Market valuation excessive – measures such as the Q ratio and cyclical p/e show the US to be currently overvalued, whilst globally speaking valuations are within normal historic range (however, by my work this is relative to demographics and as such USA and Europe should get cheaper)
In summary, we see some warning signs of a top in progress, but not yet a full set.
To be clear, not all cyclical tops are a process. Some are parabolic manias that end in a spike, with a similar crash down the other side. Examples link here.
However, we don’t see parabolic rises in equities in global stock indices currently, and if this is a top being formed currently, then it is of the topping process type. The 2000 and 2007 tops were topping processes, as were the multiple tops around the 1970s.
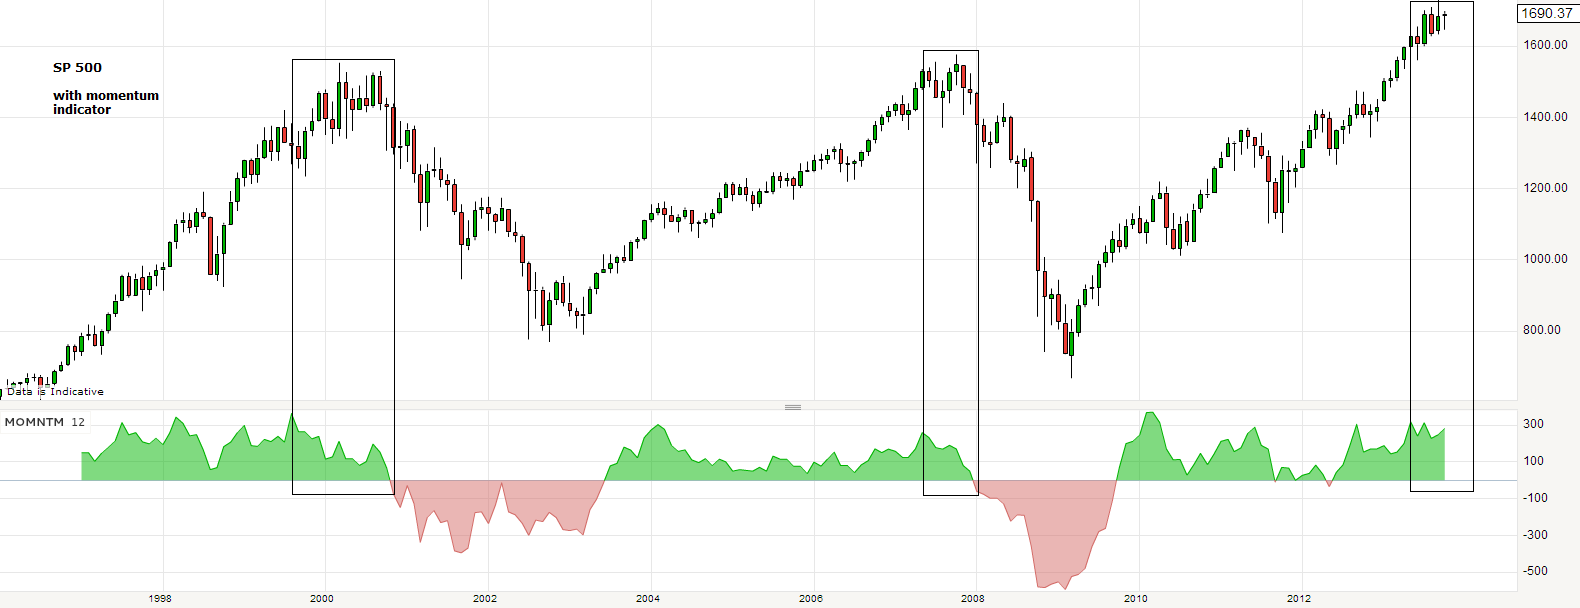
What I have found about the topping processes is that when the topping range began, there were precious few topping signals present – as if the stock market were as competent a leading indicator as any other. But when the topping range ended – the last push up – the majority of signals were clearly present. I have highlighted the 2000 (Mar-Aug) and 2007 (July-Oct) topping ranges on the charts below to show this.
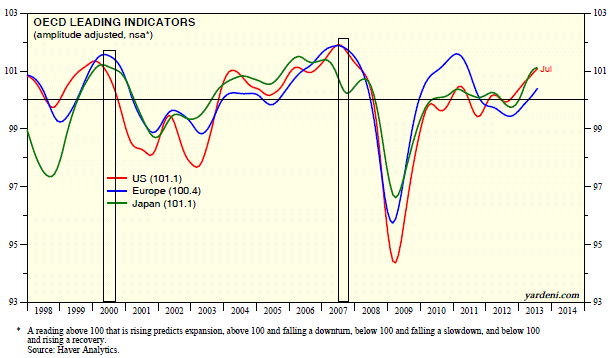
First, OECD leading indicators – downtrends in evidence by the end of the topping ranges

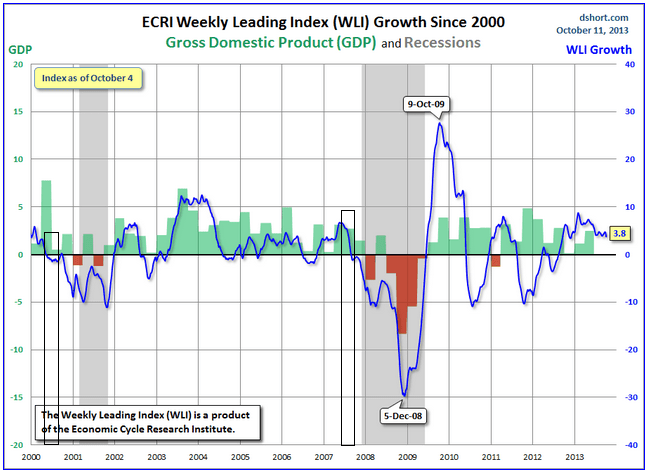
Second, ECRI leading indicators – by the end of the topping range had fallen through zero
Third, treasury yields – rising prior to the topping range, then falling once topping range in progress

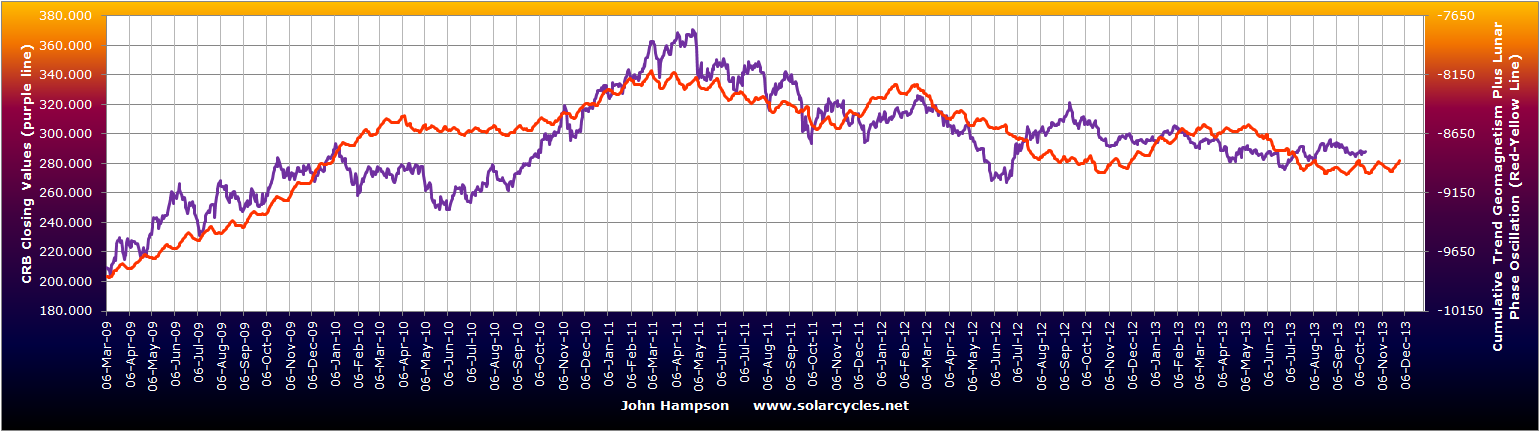
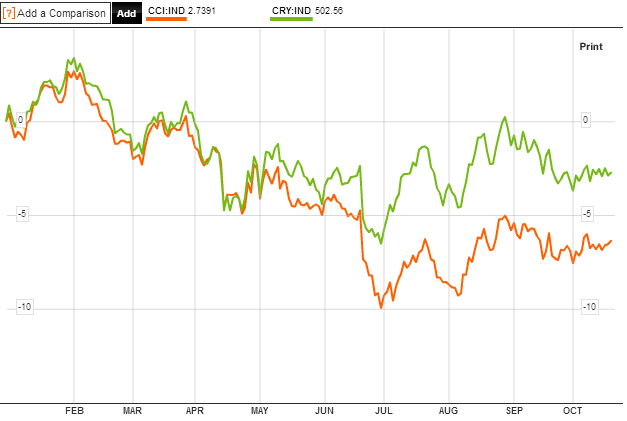
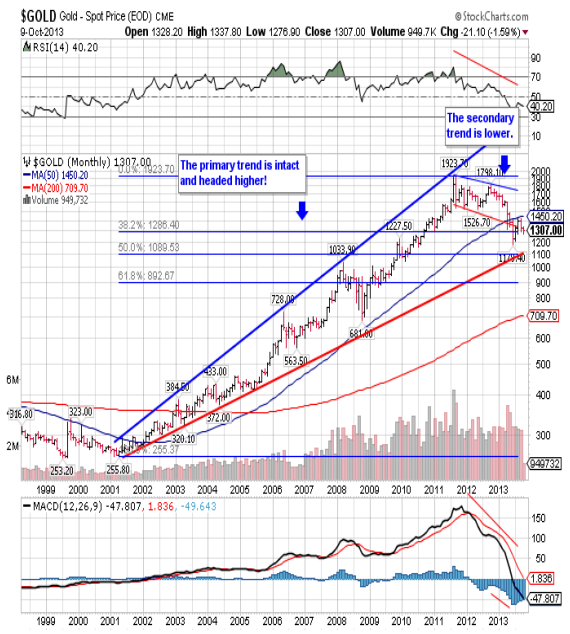
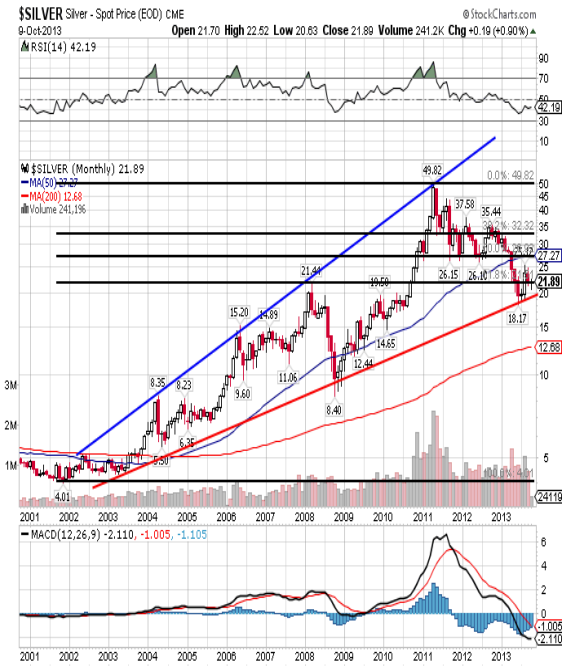
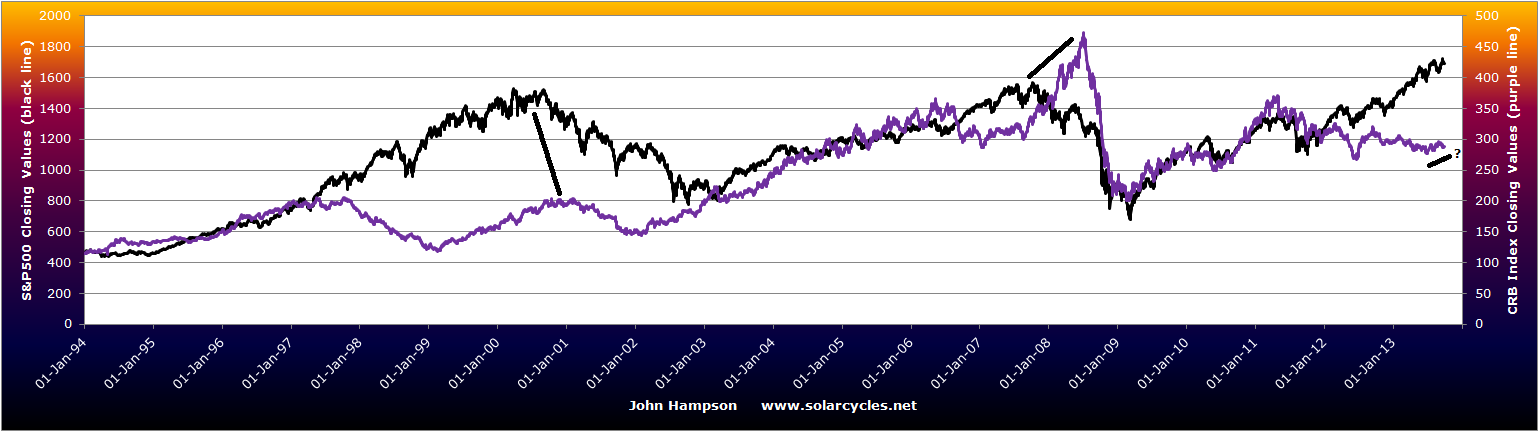
Next we see the topping ranges on the SP500, which if you zoom in, had different shapes in 2000 and 2007 but in both cases there was a last push up to the highs, with many topping signals present, before the bear began. I show here what happened with commodities – both times topping after the stock market. In 2007 commodities only took off once the equities topping process had begun, so there is the potential for that to occur now, but it has to happen without delay if this is a top.
Fifthly I show US housing, declining into the market tops. The recent drops in new home sales, related to the increasing mortgage rates, could be similar if it continues.
Sixth, US GDP – again clearly in a downtrend by the end of the topping ranges, so should look for the same this time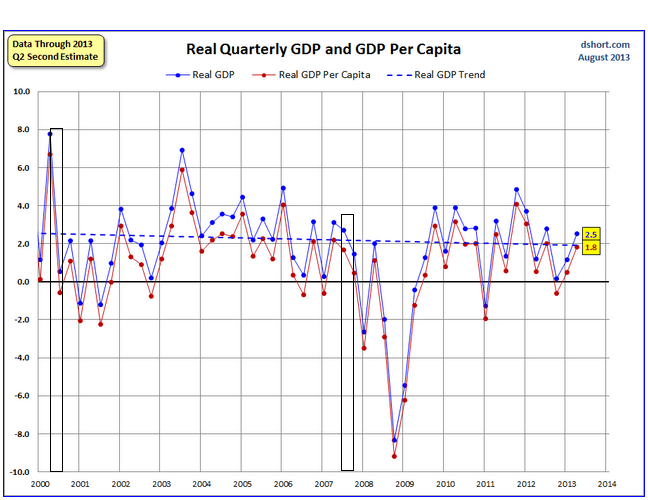 Seventh, margin debt. We see a similar overthrow rally in margin debt recently as per the 2000 and 2007 tops, and again margin debt was in a clear downtrend by the end of the topping ranges so should look for the same to occur
 In short my message is this. If this is a topping process in equities, then we should see a further leg up ahead where the bulk of these indicators have moved into clear downtrends. We have certain topping signals already in place, but the rest should fall into place ahead if this is a topping range. It means a golden opportunity to go short would be following a further leg up in stocks against the backdrop of these remaining indicators having turned. If this is not a top in equities, but a consolidation before further gains, then we should break free from the range, and the topping indicators in place one-by-one cease to be.
I want to end by commenting on the global disinflation in place currently. This to me is consistent with demographic trends, and is the threat to a commodities rally coming to pass. If commodities can’t rally as per historic topping order norms, then I would point to the unprecedented collective demographic deflationary trends in place now.
As inflation levels drop in the major indebted economies, the danger is that inflation drops below yields making the massive debt effectively grow bigger. Central banks would then need to intervene further to suppress rates or initiate inflation, perhaps by increasing QE. If, on the other hand, commodities become a speculative rally target here, then inflation will increase but the move would have detrimental impacts on the economy. Central banks would again be bringing out the toolkit. It’s the trap that I referred to before. Can instead the goldilocks scenario continue, of low growth, low inflation and equities rising, with the Fed able to slowly ease out of QE? I personally can’t see it, because it is such a fragile position. Rallying yields or rallying commodities or government pullback on stimulus/spending would likely tip the fragile economy over, and I believe one or more of those will happen in due course. It would take stronger growth to prevent this, and I don’t see it can occur against the demographics.


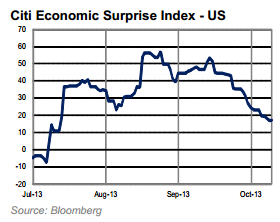
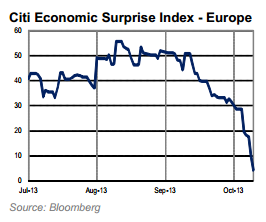
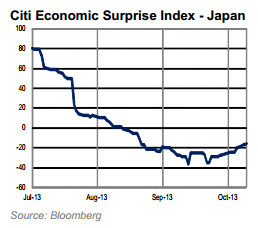
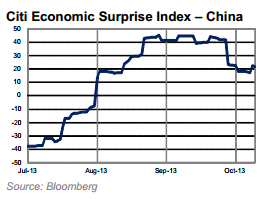 Leading indicators for the US falling:
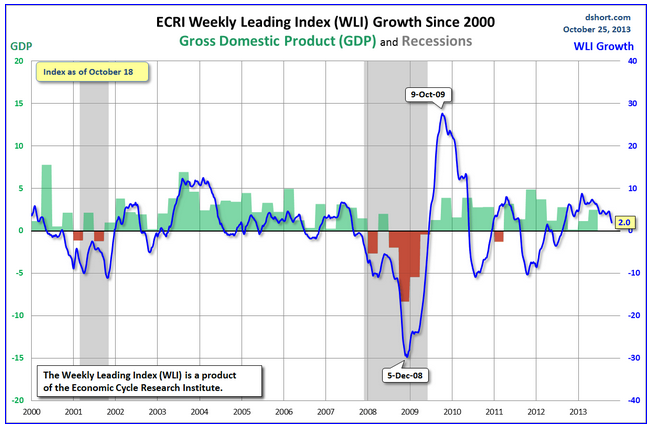


