

Here is the CCI commodity index and the CRY (Thomson Reuters) commodity index. All I can say is the combined picture for the two still remains unresolved.
 Source: Bloomberg
The possible breakout and end to the 2011-2013 bear market should be clear to see, but at this point it hasn’t done enough, and a breakdown beneath the horizotnal support could still come to pass. Looking at individual commodities within that things aren’t much clearer. Gold and silver could be basing currently, or it could be weak action before further falls. Crude oil dropped sharply on Wednesday, looking bearish for the commodity indices, and then rose sharply on Thursday, looking bullish: confusing action. Certain agri commodities have broken out of their downtrends, others not. Simply put, we’re just going to just have to wait longer to see which way the complex is heading.
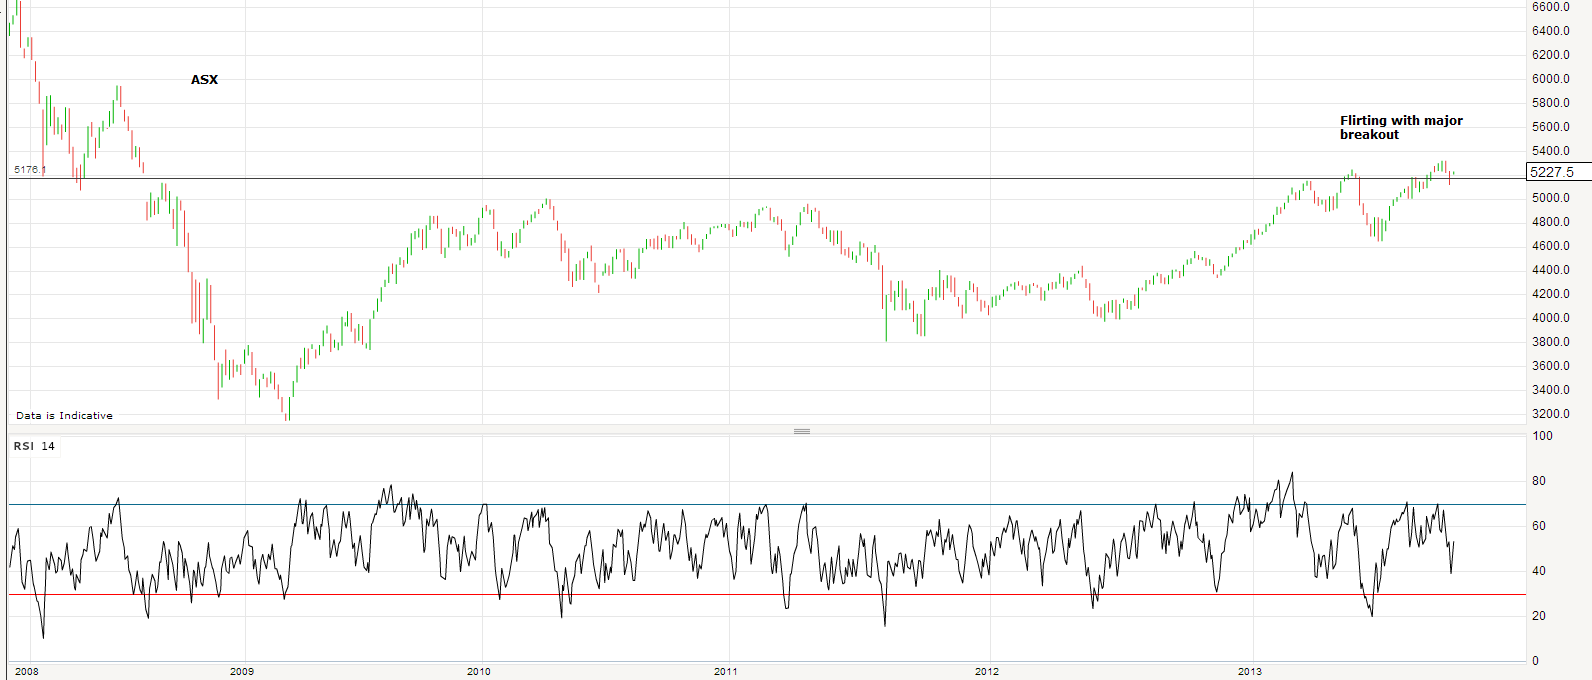
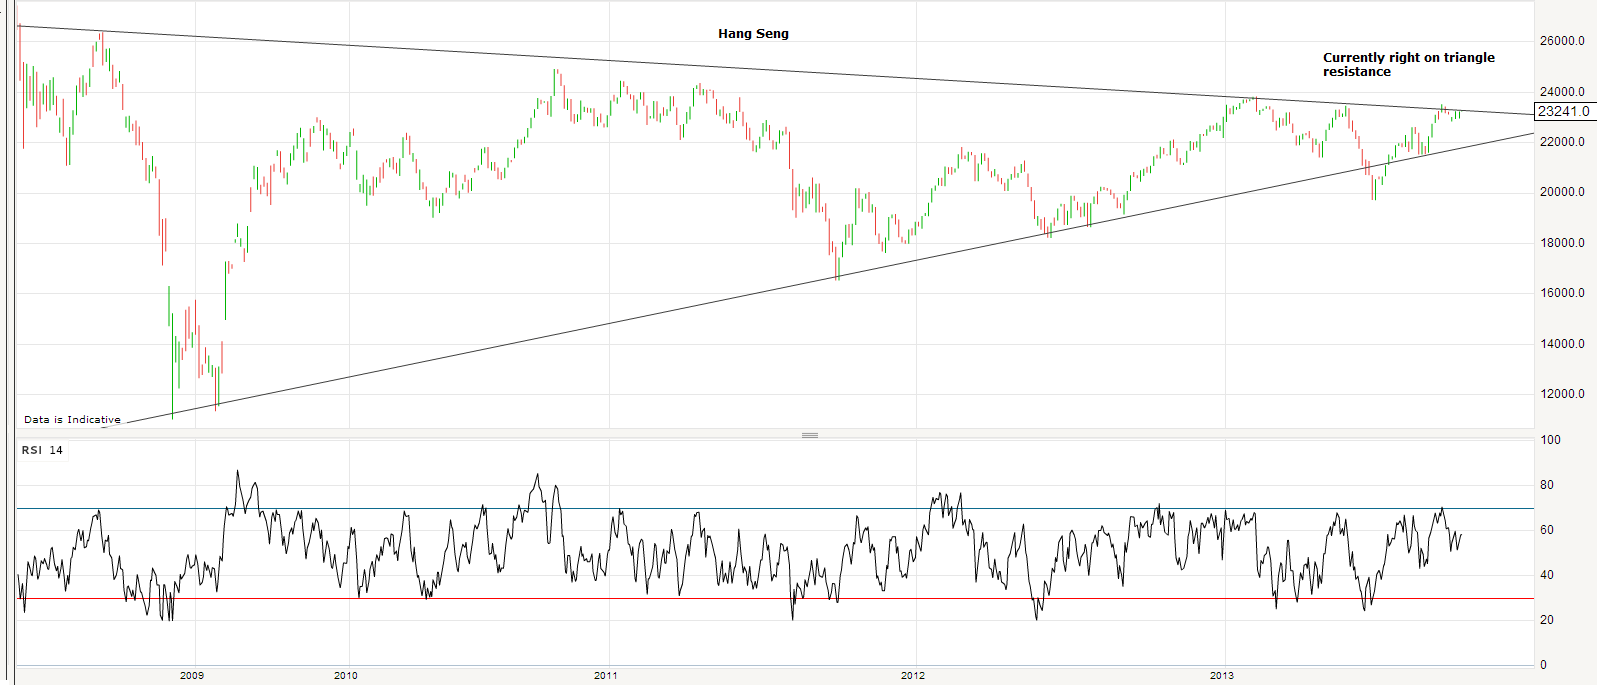
Turning to stocks, US equities have underperformed since the government shutdown, correcting more than other country stock indices. A sharp and broad reversal upwards yesterday made for what looks like a fake-out (failed breakdown) on the SP500 that is normally bullish, and puts the German Dax, Aussie ASX and Hong Kong Hang Seng (as examples) all back flirting with major breakouts:


 The 90% up-day in the US yesterday, together with the break back into the wedge is typically bullish, whilst acknowledging that nothing has been resolved on US shutdown or debt ceiling, and developments or non-developments in that arena can still buffet the market around. Nonetheless, the broader market action is still showing signs of a cyclical topping process: the volatile moves up and down since May, the divergence in breadth, the overthrow moves in nominal price and margin debt this year which echo 2000 and 2007. Here is the SP500 on a monthly view with a momentum indicator:
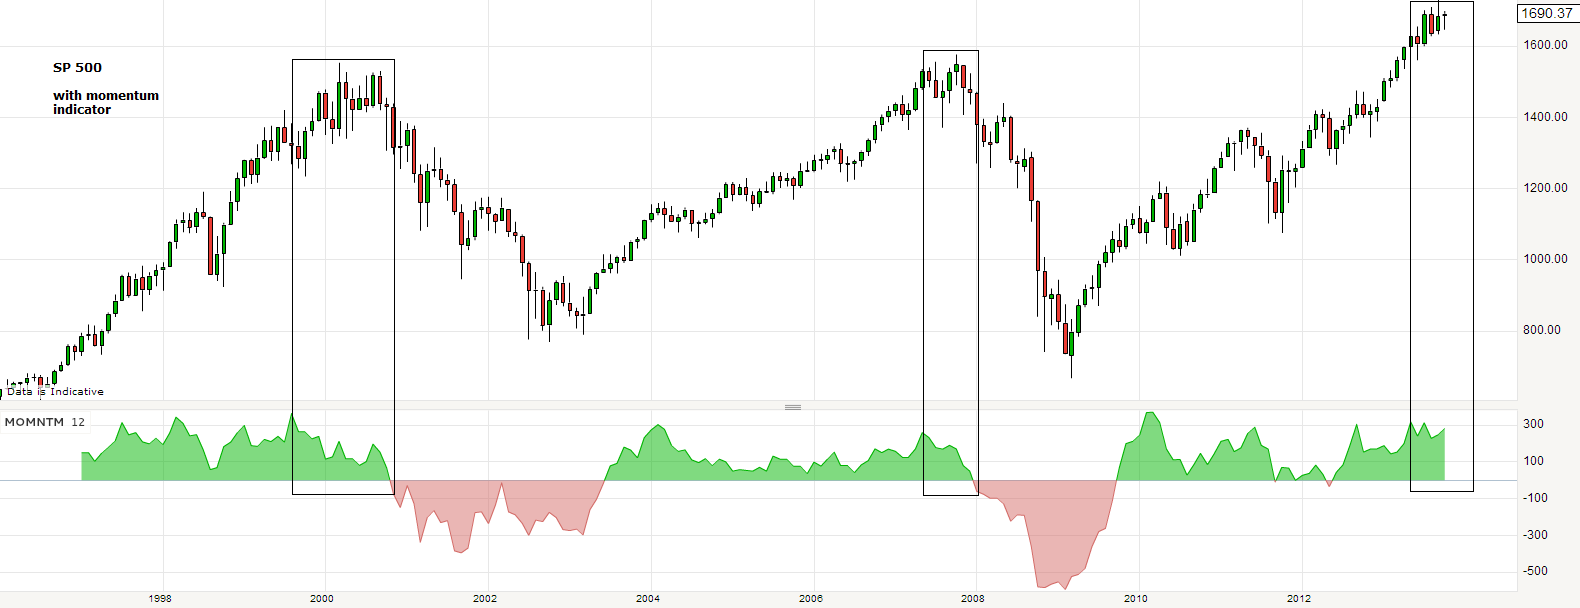 It is typical at the end of a cyclical bull for the market to lose momentum as buying is exhausted, with alternating and short up and down legs in a range at the top, before selling in earnest begins. The momentum indicator has made three lower highs since May. If this is a cyclical topping process then any further leg up should be weak, with more loss of momentum, more new percentage new lows, narrower market participation. If this is not a cyclical topping process then we should see the opposite: strong rallying with renewed momentum and broad participation, breaking away from the range in play since May. From a technical perspective, looking round major indices such as the Dax, ASX and Hang Seng, it should be clear how such strong rallying could erupt from collective major breakouts. However, I believe the weight of evidence instead supports a topping process unfolding, pending further developments, and as such believe the danger lies in long positions rather than short.
*Update*
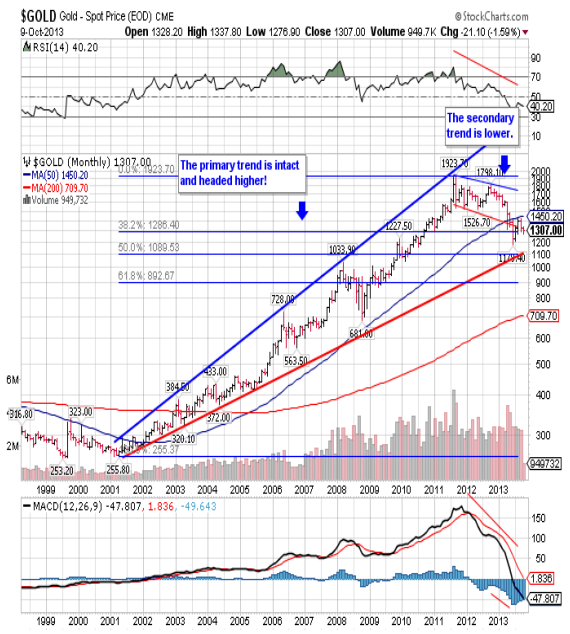
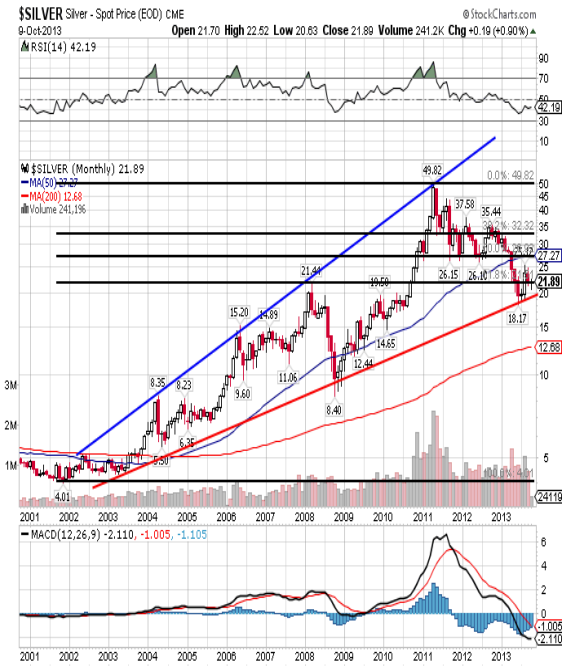
Below, gold and silver secular bull market charts (from Robert Williams, hat tip Roger Reynolds). Both have primary uptrend still in tact. Gold has corrected to the 38 fib, silver to the 61 fib (silver acting as a leveraged gold, both up and down). Gold could yet correct further to the 50 fib and meet the rising primary support, circa $1100. However, gold corrected around 33% in 2008 and then resumed the bull, and has corrected a similar percentage this time round. Drawing these factors together, we would appear to be at a key make-or-break point for precious metals, similar to (and playing into) the picture on the commodities indices.
 Source: Robert Williams / Stockcharts

John,
Question. QE has not increased. We have all this debt. How can commodities show improvement?
These would be my possibilities. Stocks top out, commodities rally last, in line with historic norms. Too weak economy, Fed steps away from tapering, commodities regain favour. Solar maximum ahead within next 6 months, commodities speculative rally. Geo-political and climate price-pushes remain wildcards.
However, I accept the possibility of demographic-deflationary forces leading to prolonged weakness in commodities, and a breakdown in the top chart above. I think the perception that QE would bring about massive inflation has been gradually killed, and its non-occurence I believe is due to the demographic downforces. So commodities have lost that reason-to-buy.
“…I think the perception that QE would bring about massive inflation has been gradually killed…”
I don’t understand – massive inflation has been occurring throughout the runups of gold prices. And if gold (assuming no bubbles) is a good measure of true value, then the relative $/G shows a good measure of true inflation.
The ‘official’ USG indices are further instances of geo-political badMath, another TBTF-corrupted product of Ivy-League economic non-science.
I have added gold and silver charts at the end of the above post.
More thoughts on gold and silver. Precious metals, based on my research, are the go-to default investment when other assets are not favoured (for different reasons, but often demographic). Hence precious metals perform for different ‘perceived’ reasons: hard money, safe haven, inflation hedge. By my work they are the anti-demographic, and around the 1970s they enjoyed just over a decade long ‘secular’ bull market (topping out with the solar max), which fits well with the collective demographic downtrend window for the major economies in that period (demographics turned down at the end of the 60s and back up again at the start of the 1980s).
In the current period we have a longer demographic downforce window, beginning with the USA turning down as of 2000, then Europe and China joining and collectively trending down through to 2020-2025, which is when solar cycle 25 maximum should hit. So, just speculation, but I would predict precious metals enjoy a longer bull market this time round: two solar cycles rather than one.
To tidy that up further, the current correction in precious metals since 2011 would then look like a ‘half-time’ breather similar to that of the mid-1070s:
LINK TO PIC
Here is the gold miners index (underlying source: Sharelynx) im which I’ve highlighted the same bull market window for that sector matching the collective demographic downtrend window of that period. If my idea above is correct (i.e. half way through 2 decade+ bull) then they should bounce here at the rising support, on their way to an eventual new high at the top of the channel – which again would suggest it’s a make-or-break point for PMs:
PIC HERE
Warren B takes a position in Goldman. Why is not he buying gold?
GLD broke out of the HS neckline downwards. Statistically 20% downside but who knows – just protect your downside. =)
Robert,
Not sure if your question is rhetorical or sincere but if sincere Mr. Buffett explains it here:
http://finance.fortune.cnn.com/2012/02/09/warren-buffett-berkshire-shareholder-letter/
I do not believe that Mr. Buffett gives precious metals (pm’s) their due respect as the ultimate ‘real basis’ of the financial system but I don’t think it matters either, as long as the system continues to function. He may lack vision in this area but his investing success obviously speaks for itself.
BTW, I appreciate your ‘follow the price’ approach to trading, if that adequately describes it. I first learned of this idea from Nadeem Walayat (the Market Oracle) which is also how I found this site.
Learning to trade as well as to invest has been amongst my biggest challenges. My parents taught me ‘investing’ (a la Mr. Buffett) and it worked very well for them in their time. Some years ago I realized that to achieve my goals I would need to trade as well as to invest. I am learning . . albeit slowly.
Many of my pm miner positions are investments by default, since they have declined since purchase to value not worth selling, these I set aside and worry not about. Other positions are investment by their nature and/or by my choice (e.g. GE), and I watch but do not worry about their decline (or advance). If my trading is not supplying adequate funds for my lifestyle then I look to investments with gains that I am willing to divest and set my price. Rarely do I sell below my price.
Anyway, thanks for your contributions on this great site,
geopark
Gold is the only commodity were the physical supply exceeds the demand by a factor of 100x or maybe it was 1000x. Need to check that one again. Yeah, funny money talk and physical money etc. But sorry, this will never work. Benjamin Graham wrote a very long essay like 50 years ago on the topic – you might want to check that out. I was in gold a very long time and rode it up and people laughed at me. Now everyone is talking about gold. Forget about it. Gold is the ultimate bubble as Soros says. How many loves of bread did gold buy in the Bible like 5000 years ago? A hell a lot of less then today. I was a gold bug, I concede that I was wrong. Gold is for people that are afraid and there are not many rich frightened people around… I am more for shorting gold unless we break old highs. There is a good article written by … can’t remember his name now. That crazy hedge fund guy that used pi or something to time the market that went to prison. His credential may be flawed or whatever. But often crazy people are more right in the markets than sane and he has a article about the problem of divesting out of the USD… it is not that easy… take people in Poland… were some of my family lives: they will never accept Chinese money, Russian etc. Maybe Swiss but otherwise USD and EUR with emphasis on USD. Gold maybe a bar or two at home but it is not practical. People just buy whatever they can during hyperinflation. Cigarettes, Vodka, chocolate is better hard currency so if you are afraid go long Philip Morris. =)
3-drive setup in SPX projected to complete in few days, which corresponds with the T-projection of Oct 14.
The premature breakdown this week failed, so the indexes will make tops or shoulders probably on Monday… a final budget/debt euphoria or something I guess 🙂
Looks like a cup with handle to me ;).
Do not think the markets will crash but do not have a clue. Holding many longs but many OTM puts as insurance.
The simple reason is that nothing new is happening.
http://www.bloomberg.com/news/2013-10-11/how-to-handle-a-debt-default-you-know-just-in-case-.html
And there is fear in the market and not euphoria. The market is rallying but on fear. If the consensus is that all is good then I think the bear case will be more valid. =). These are just my feelings and I do not trade on them =).
Heard something about t-bills acting like in 2008: any analysis on this one?
Nobody was talking about the default of Lehman until it actually happened… ;). Here we are already assuming the possibility. If there is ever a default it will be a prepacked negotiation with the Chinese or those aircraft carriers start moving…
I dont care if the market goes up because of fear or euphoria, or if the market thinks US will default. All of this cannot be measured, and are just opinions.
I think the market will go down, simply because it is an overdone bull-market, within a secular bear. And because we are at/near solar maximum. At overbought readings, like days above 200MA. And the cycles point down into Nov-Dec.
If we dont break down at this cycle, then the next in the winter 🙂
—-
In fact it may look like the market cannot go down until the issues in US are cleared. Everyone knows there will be positive news coming, before Oct 17… so no reason to sell before that.
I think it is not possible to measure that we are in an overdone bull-market, within a secular bear. That is also just an opinion based on too few observations =).
The market will eventually go down =).
I choose not to predict and be view-agnostic. I let the market decide and not my feelings that are looking for logic and reason to be expressed in the markets.
You do not know “everyone” =). Those are your feelings talking.
——————————————–
“From time to time I get questions whether I use other planetary cycles besides the moon. Astrologers tell me to watch out for the next opposition of Jupiter to Saturn, or warn me that Uranus will be going retrograde next week. What about the Bradley indicator? Or the solar cycle?
So let’s have a look at financial astrology and why I don’t use most of it.
The problem with most planetary cycles is a simple one: we don’t have enough stock market history to reliably test any cycles that are longer than a year. For example, the planet Jupiter takes about 11 years to complete one cycle around the sun. Since the start of the New York Stock Exchange the planet Jupiter has completed only about 20 cycles. How much statistical confidence can we have in whatever conclusions we might derive from these 20 observed cycles?
Maybe stocks have gone up when Jupiter was in Aries 14 times out of the observed 20. Should we then bet on the market going up again the next time Jupiter enters Aries?
Well, there are 12 different star signs, so it is completely normal that stocks will have been a bit more “lucky” when Jupiter was in one of those signs (could be in Aries or any other one). So, the answer is no because this can easily be the product of random chance.
Imagine you see a person toss a coin 10 times and get tails 7 times. Would you then bet that he will obtain tails again on his next try?
The statistical significance is just too weak when we have 20 or less observed cases.
But that’s not the only problem. Let’s say we continue to search and find some cycle that matches the stock market history in a way that is very unlikely to be the product of random variation, maybe at a 99% confidence level (see: p-value). That’s something we can use, right?
Well, not so fast.
We have now run into the “look-elsewhere effect“. We looked in all the different planets, we looked in combined cycles like Jupiter-Saturn conjunction cycle, we looked into different aspects, we looked into retrograde motion and heliocentric cycles, we looked into planetary nodes, and so on… until we found something that “worked”.
But if we look in a few hundred methods and cycles of different lengths it is completely normal to find a few that stand out at the 99% confidence level.
This is no different from continuing to toss coins until you manage to produce heads 7 times in a row. It will happen sooner or later.
So, apart from the problem that we don’t have enough market history to test most planetary cycles for stock market effects, we also have so many different astronomical cycles and astrological methods to test that we are guaranteed to find a few that seem to work very well over a given test period for a given financial instrument. Are we then looking at the hand of luck from the look-elsewhere effect, or is it a genuine market cycle?
In a second part I will present another take on long term planetary cycles, and a possible use.”, Lunatic Trader
I shoud have written “everyone”… because I do of course not know or say that everyone knows that all problems will be solved in the coming week… but the market seems to signal it with the last couple days of rally.
And all though they still havent found an agreement, “everyone” are saying that things MUST be solved… and the alternative is not an option. And common sense kind of says that US will find an solution before Oct 17… but how will the market react on a last hour solution…?
Here’s my first experience with the stock market. The market was going up after 3 years of falling. I saw this, but I assumed I am too ignorant, so started to read some professionals both in TA and fundamentals. They kept talking about levels, imminent correction, overbought conditions, still weak economic rebound and unjustified optimism. While they were doing their talk, the stock market didn’t give a damn about all they said and were arguing with precision. Some stocks went up to 2000 P/E as their earning only emerged from losses. The market kept going everyday higher for another 2 months and an ignorant like me could easily spot the market leaders, buy them and make up to 50% before the first correction started. Unfortunately, I was really ignorant so I didn’t know that a correction must come and how to react, even though I noticed the ‘strange’ pattern when stock index opened with a gap up and started to go down until the end of session.
All this ‘talk industry’ is for the masses, and rightfully so, because the main purpose of stocks is to allow the insiders to fleece the public.
RSM Tenon. Good numbers, good financial forecast, directors buying, but the price just cannot stop going down. The numbers get worse, directors are confident and ‘inside buying’, good forecasts, ‘it’s a temporary weakness’ due to economic conditions – the price doesn’t stop going down. Today insolvent RSM Tenon shares are suspended by administrators after a crash to near zero.
All those deflationistas and flashcrashistas keep pumping ‘inevitable’ to my ears. As much as inflationistas want me to buy coffee. Correctionistas have been drawing scientific numbers and lines all over the charts since January, through May and June. Earningstas want me to buy and hold like there is no tomorrow. One day they all will be right for a while. But most of the precious time they will be not. I prefer to sit on market’s back with a whip in my hand. If a correction starts, I will put on a red t-shirt.
SPX just scored a 3X bottom as it bounced off from the 5% mark above the 250 day EMA. It also broke the very short term down trend. No sell signal yet!. I see a possible strong year end rally coming.
In the 2nd quarter, with their call to sell gold, GS actually increased the holding of GLD by 540.66%. This is in public domain:
http://www.nasdaq.com/symbol/gld/institutional-holdings
Of course… =). But there is no way for you to know what strategy GS is using so that information is useless. Piggy backing investment backs is useless. The rationale for long and short in those organizations is more driven by politics than other things. They are not long term value investors… Disregard what they say and do completely. Find your own strategy.
Paulson & Co cut their stake by 50% and he almost took down GS in the financial crisis if it was not for Warren B stepping up and bailing GS out. They do not have a magic wand. Stop thinking GS has a magic wand.
Useless reply with excessive and redundant imagination.
TrioOfDoom: Yes. Let it all out. Show me a form. Let your feelings out. =).
Sunspots been rising last week
There was a 4 month tidal peak on the Sun on Sept ~10, and the correlation shows often a sunspot peak 30-40 days later, which is now. So sunspots should weaken from here and to December
Dont want to take away Johns readers… but anyone interested may register on my forum and check the weekly updates there 🙂
http://sibet.proboards.com/
Jan: The thing is if the US defaults that would be even more bullish for equities… If treasuries are not safe and USD is not safe then you got to buy something… And in the end you got to buy equities or commodities or something that is not cash =). This is not your regular crash logic. I see the crash more in hyper-inflationary terms i.e. people are protecting the left tail while you should be protecting the right tail =).
Upon research, we are in a crash window for asset markets as per Steve Puetz’s initial criteria concerning eclipses. Now most crashes do adhere to a general pattern, with one of those features being that the crash takes place after the solar eclipse. That said the current set of circumstances, with the solar eclipse yet to happen as well as other features, remain within the parameters. I don’t see headline indicess crashing but am very open to a 10 to 20% drop in the miners on the basis they sport similar internal configurations to May 2012 and May this year when they underwent sizeable declines.
Thanks