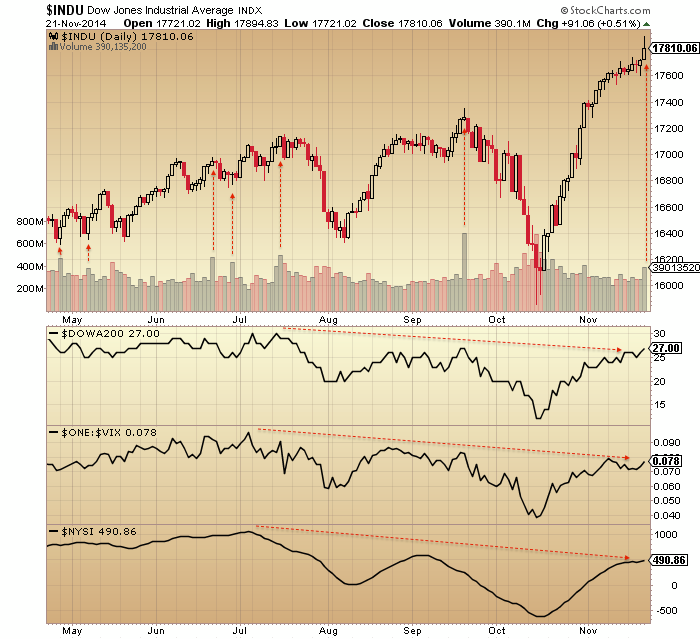
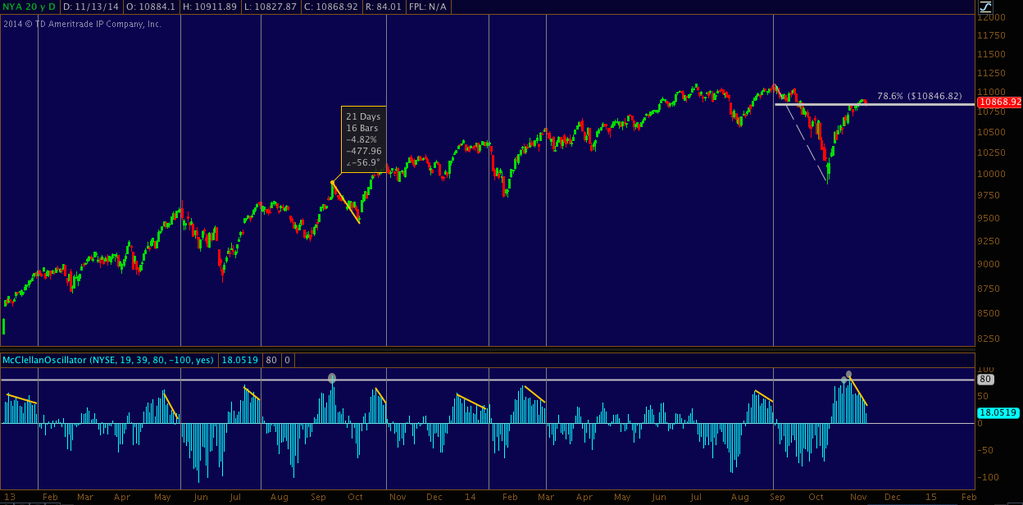
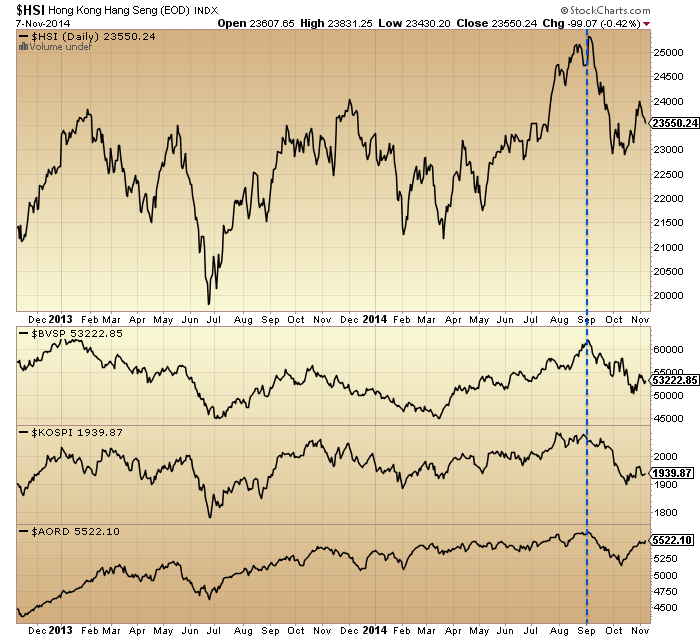
The 2 days either side of Thanksgiving are typically bullish so there are reasonable odds November ends as an up month, which would negate the October monthly hanging man candle. However, the last 3 daily candles, two black and one red, suggest a brewing reversal. Seasonality doesn’t always work, so let’s see how today and Friday play out.

Source: Stockcharts
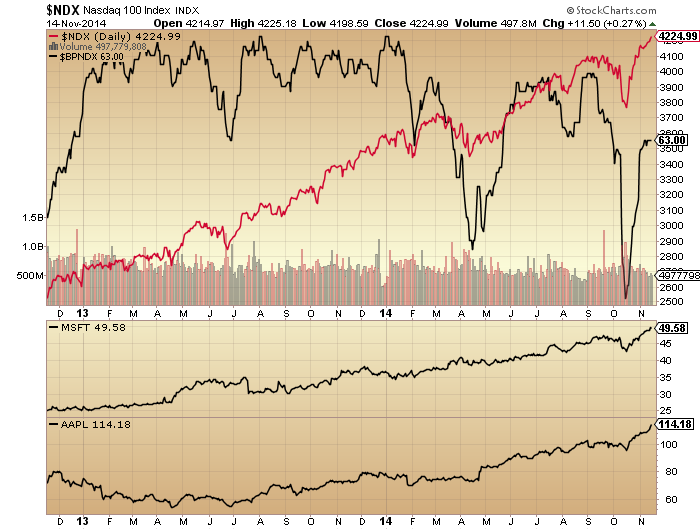
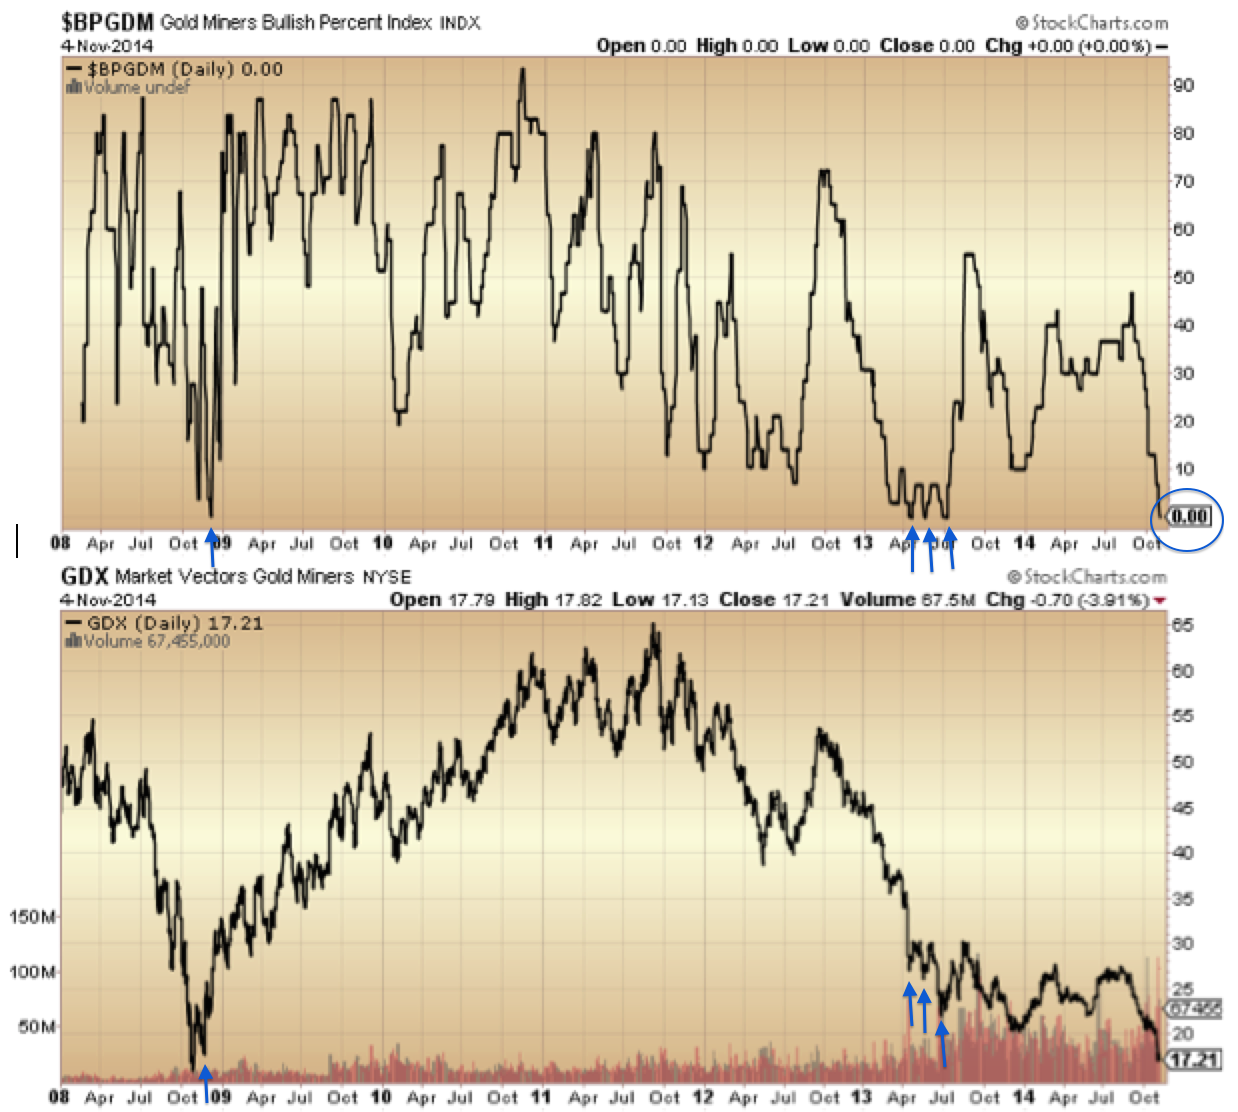
Apple made a notable intraday reversal and closed down yesterday, so I am now looking for follow through from this leader. Meanwhile, bonds and miners had strong up days yesterday, adding to the likelihood painted by other indicators of a turn in equities being close at hand.
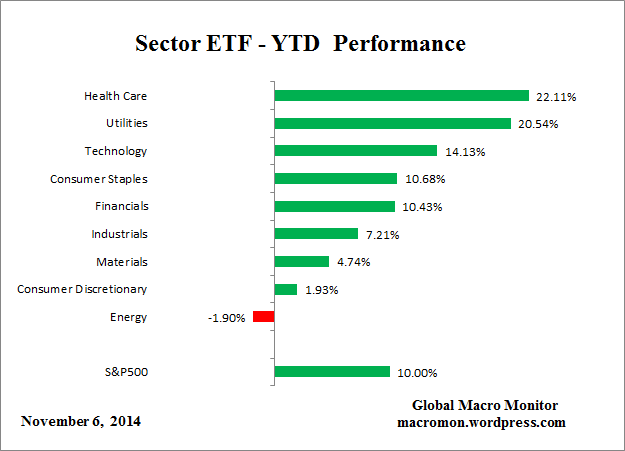
All year I have pointed out the outperformance of the defensive sectors normally associated with market tops. Below are highlighted previous years where defensive sectors made the top two rankings like 2014.

Source: Charlie Bilello
1990 finished the year down -6.56%, with a 20% drop within the year. 2000 ended down -10.14% and 2008 down -38.47%. 2011 finished exactly flat, but experienced an 18% drop within it. Yet 2014 is so far up +11.83%. How can we reconcile this?
One way is for 2014 to yet end much lower, with a steep down December. The other way is somehow ‘this time is different’.
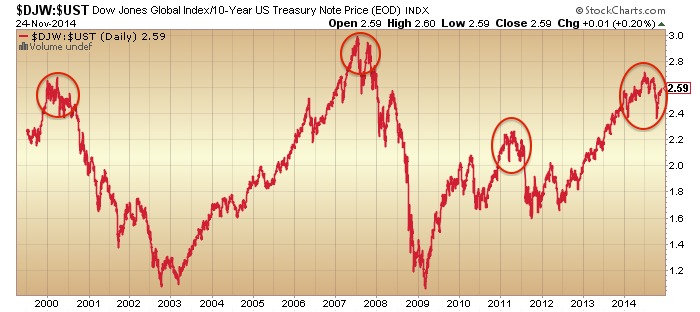
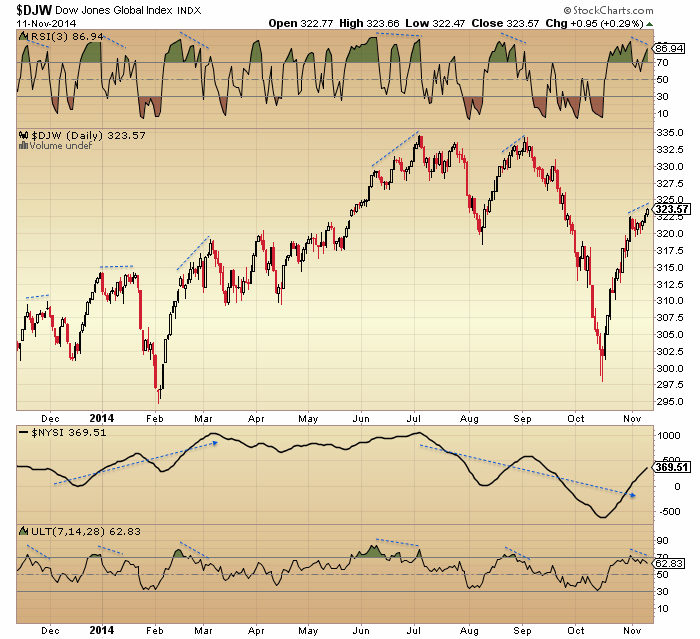
Here is the updated comparison of the topping processes of 2000 and 2014, using the Dow Jones World index. The timeline runs similar due to the solar maximum occurring at a similar time of year. In both cases the topping process began in January with divergences from that point in breadth and defensives. The solar maximum itself provided a second peak, followed by a double top in July/Sept to complete the topping process. The notable difference in 2014 is that the double top was higher than the previous two peaks and the subsequent rally back up in price stronger too.
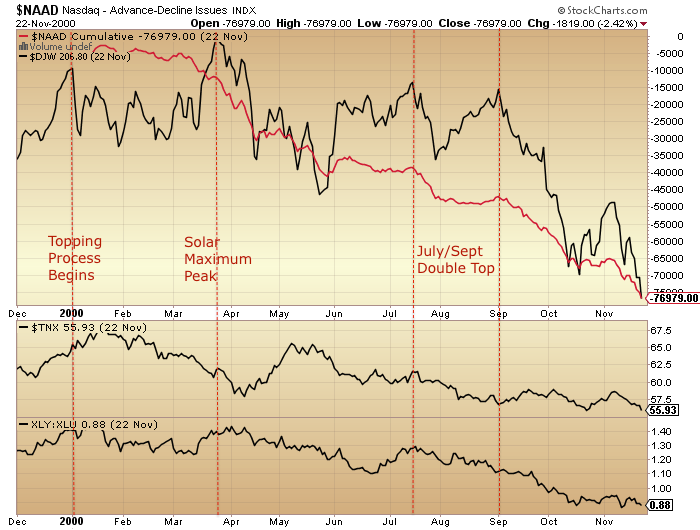
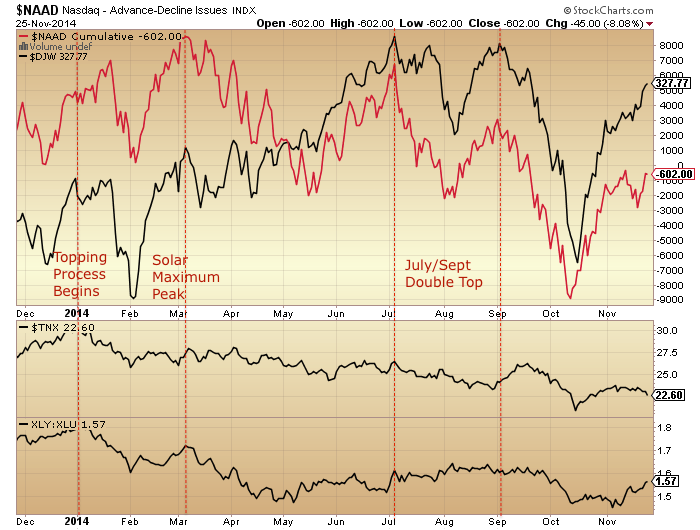
This fits with the picture painted by the defensive years shown further up, namely that the anomaly is in price action. Again, this could be resolved with a sharp crash late in 2014, with price belatedly converging with indicators. Or, option 2 again: somehow it’s different this time.
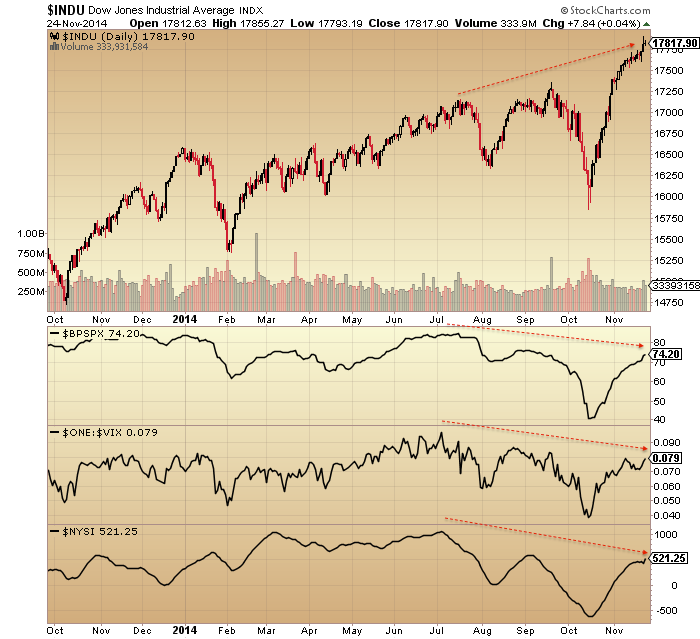
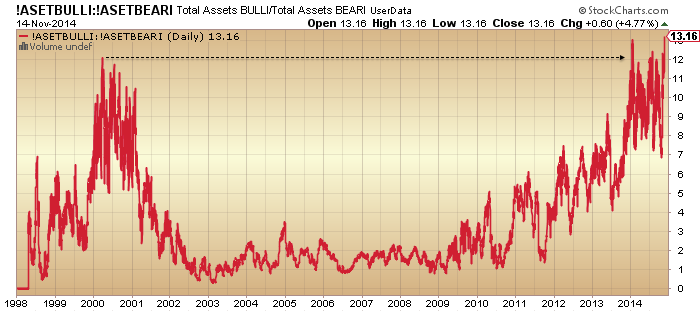
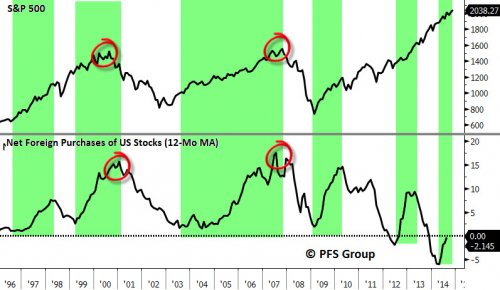
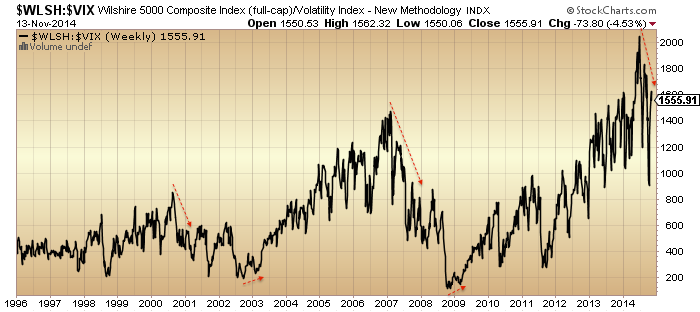
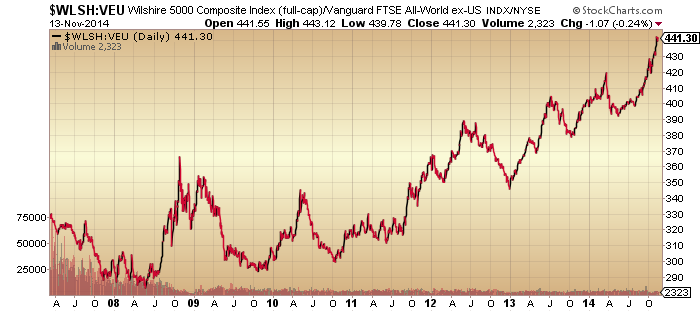
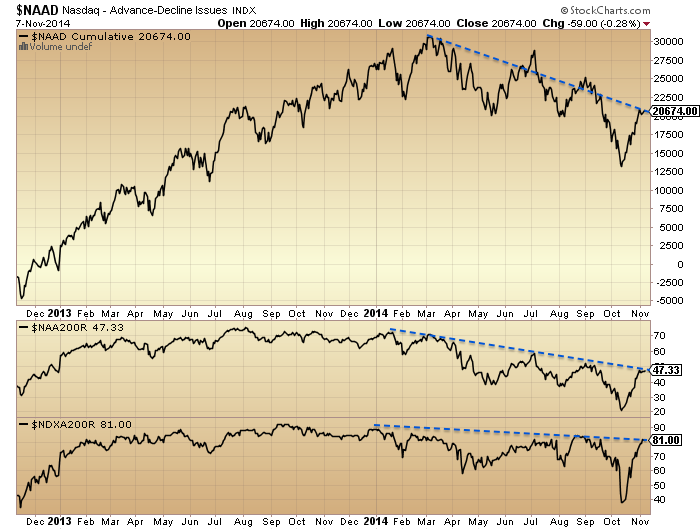
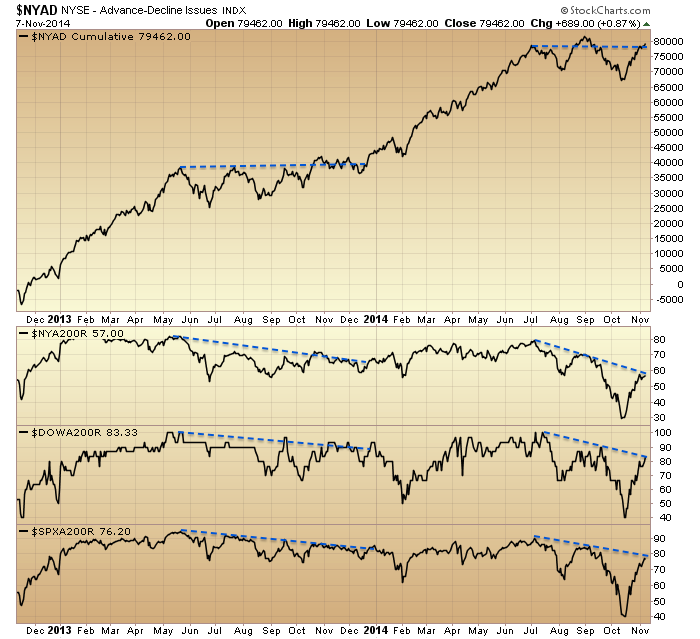
Another version of the 2000/2014 comparison is shown below, using the Wilshire 5000. In 2000 we saw notable divergences in sentiment/allocations (mania), volatility and breadth as of around July. Price then followed down. In 2014 we see similar divergences from a similar point, but price has so far gone the other way.


I suggest the same two options: a sharp crash is coming to rectify the anomaly, or this time is different.
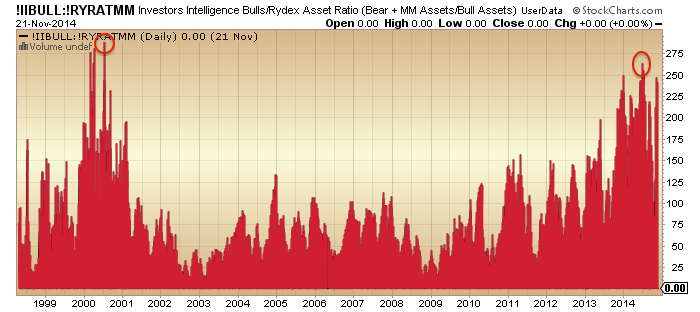
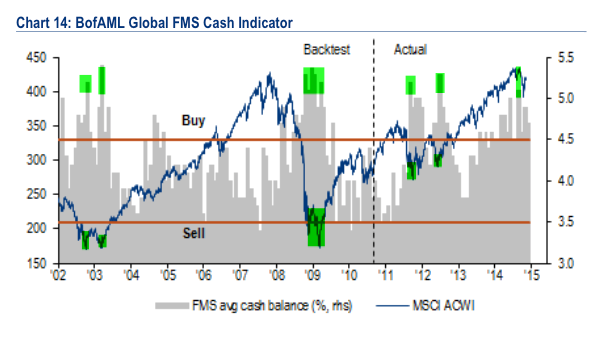
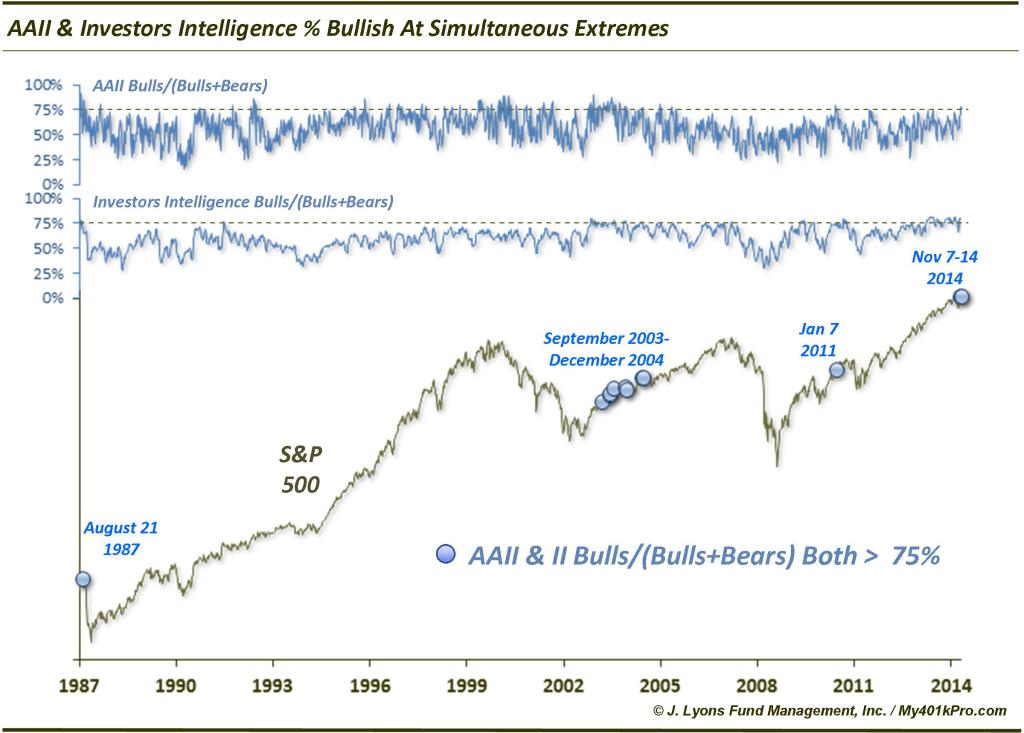
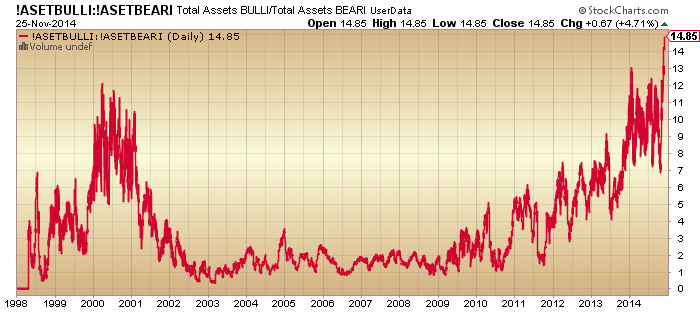
One way this time could be different is if these divergences are repaired, resetting the topping process. But with froth this extreme, is that realistic?:
Margin debt was released for October. A decline from September, keeping the peak-to-date still as February.
 Source: DShort
Net investor credit also declined, with its peak-to-date being August. Clearly the progression in margin debt looks a little different from the 2000 and 2007 peaks, but this again fits with the strong action in price. Nonetheless, the current peaks in both leverage measures fall either side of the expected smoothed solar maximum of April, which fits with the mania peaking around then, putting stocks on borrowed time.
Historically, manias saw (and needed) leverage rise into the peaks. With leveraged loans as well as margin debt having apparently peaked out, it suggests stocks really ought to snap or have snapped, which takes us back to the conundrum of price action, as US stocks are at all time highs here in November.
In the comments yesterday I shared the below comparison of final price thrusts into major peaks, with the rally since October in 2014 being similar in size and duration, although arguably with a little room for more of both:
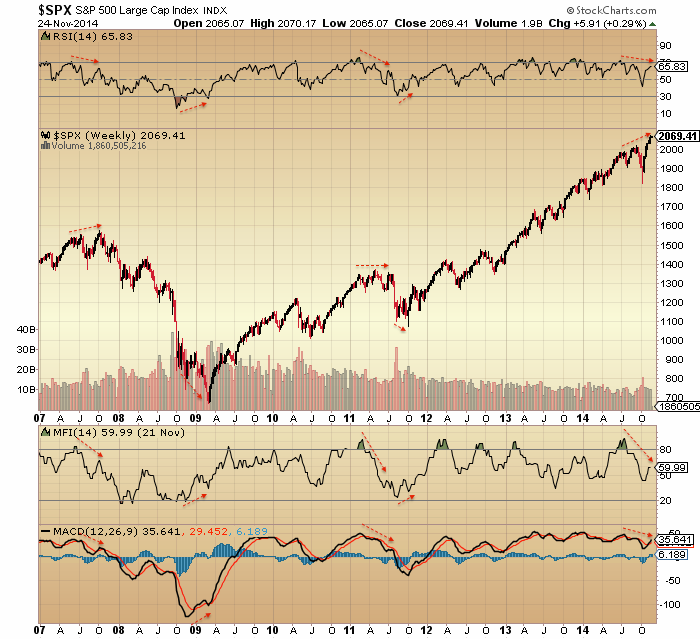
 All the evidence I have shared in recent posts points to this indeed being a final rally, the last peak in the topping process. If so, then we need to be aware of the way these rallies peaked in the past: sometimes with an inverted hammer candle (a strong intraday reversal), sometimes with a topping range whilst momentum diverged.
In other words, if the last 3 sessions have been markers of a change in trend and an end to this 14% rally completing around the new moon then we could see either a strong reversal and no revisit of the highs or we could see a sideways range lasting a couple of weeks as momentum diverges. That both options are possible doesn’t make it easy, so we will just have to take it day by day.