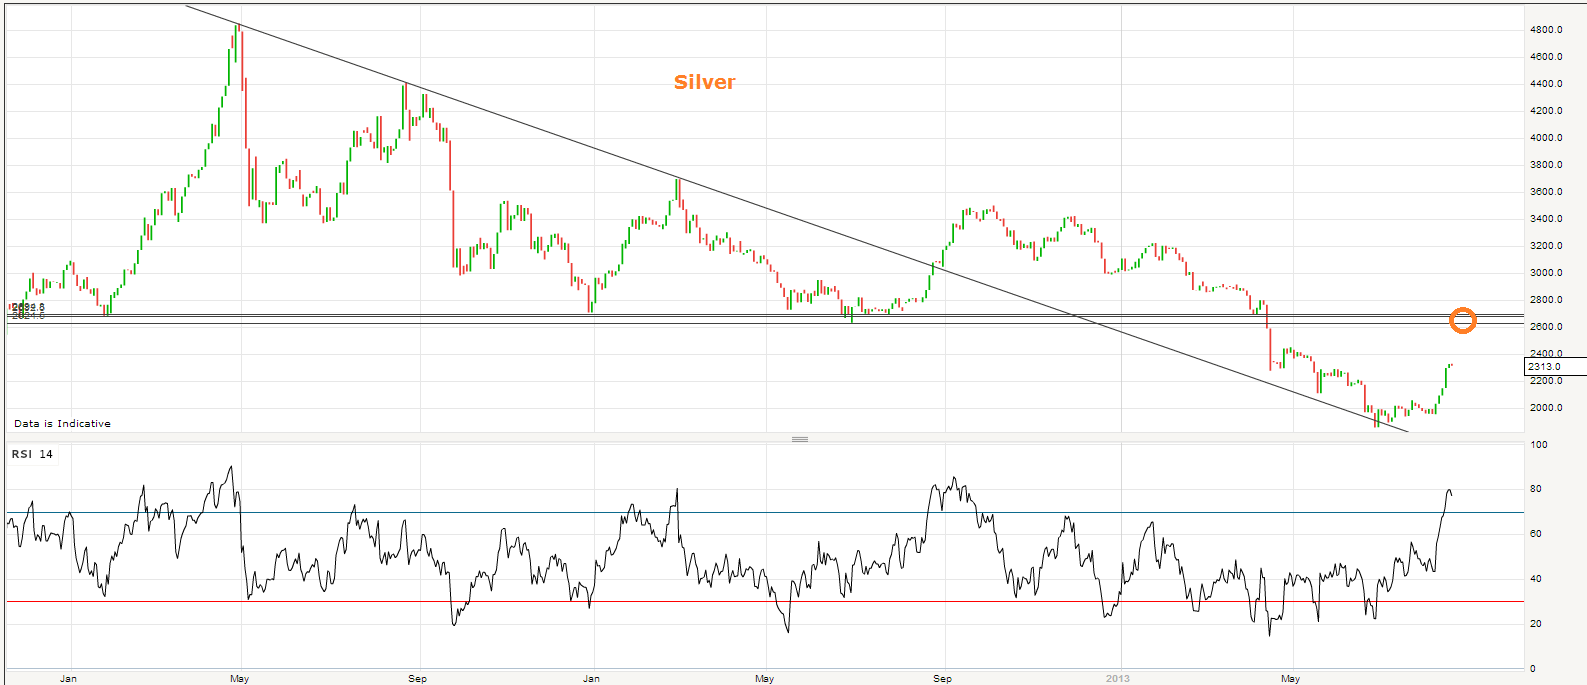
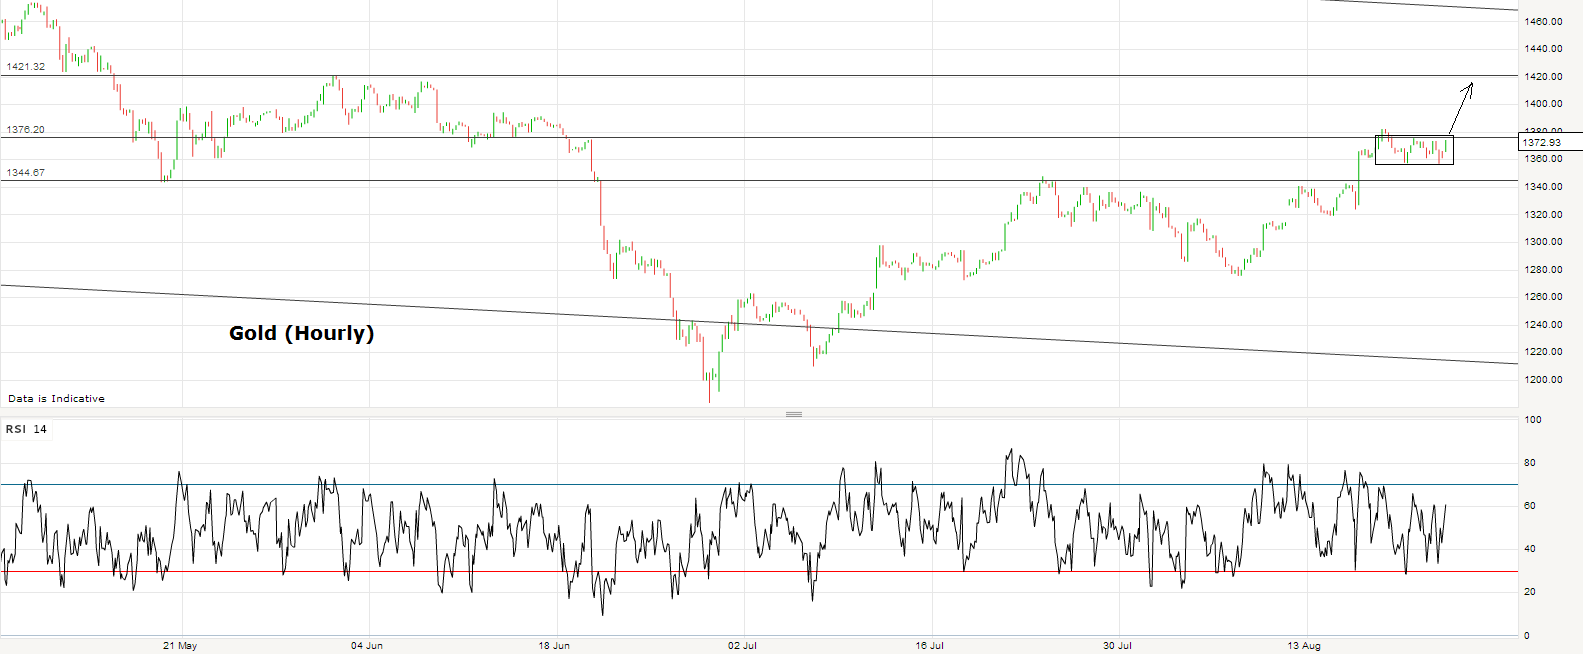
Dust settling on the FOMC meeting minutes. Will know by the end of today the true market reaction. But gold has consolidated beneath the next resistance level which I believe is promising for a breakout to the next level shown:
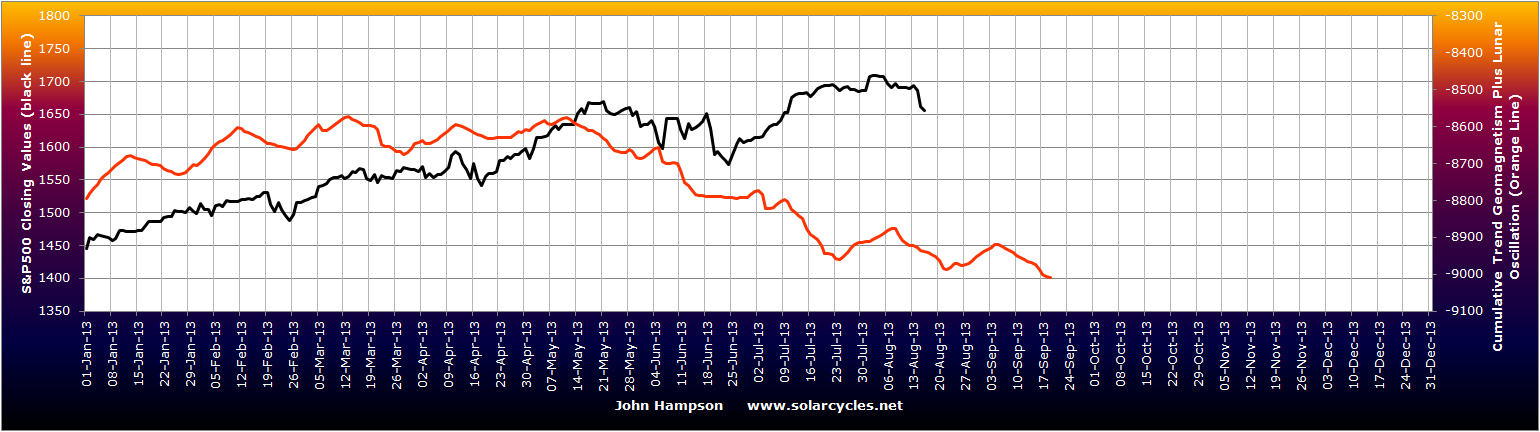
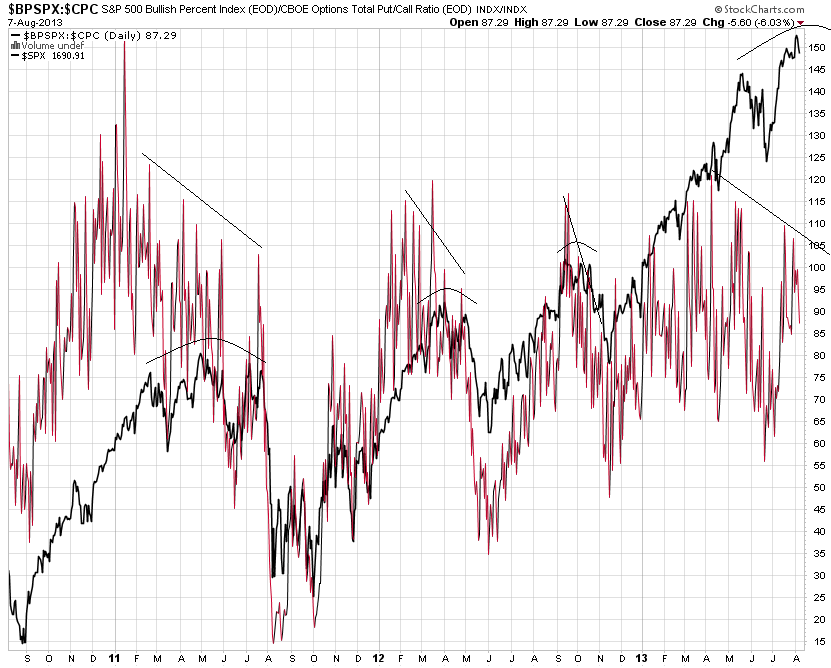
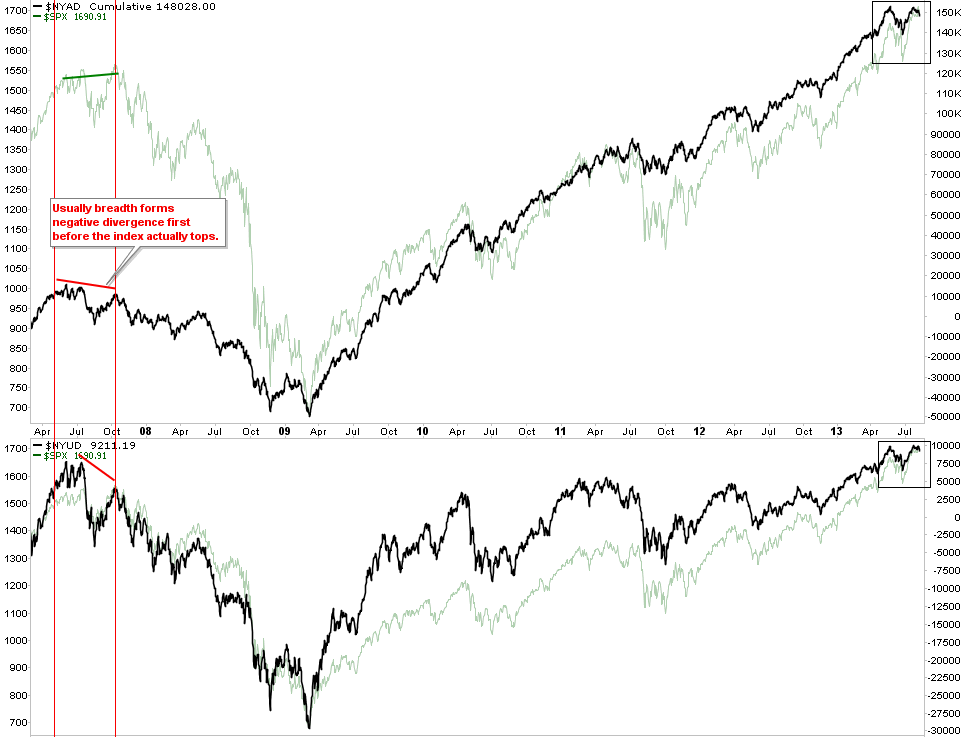
 Meanwhile I am unsure with US equities whether they can now rally as we move beyond the full moon and out of the lunar negative period, or whether the continued downtrend in geomagnetism together with a lack of bottoming out in sentiment and oversold (as suggested by Chris Puplava below) mean they have yet further to fall. If I could suggest a middle ground it would be that they muster a rally and then fall again in a kind of ABC correction.
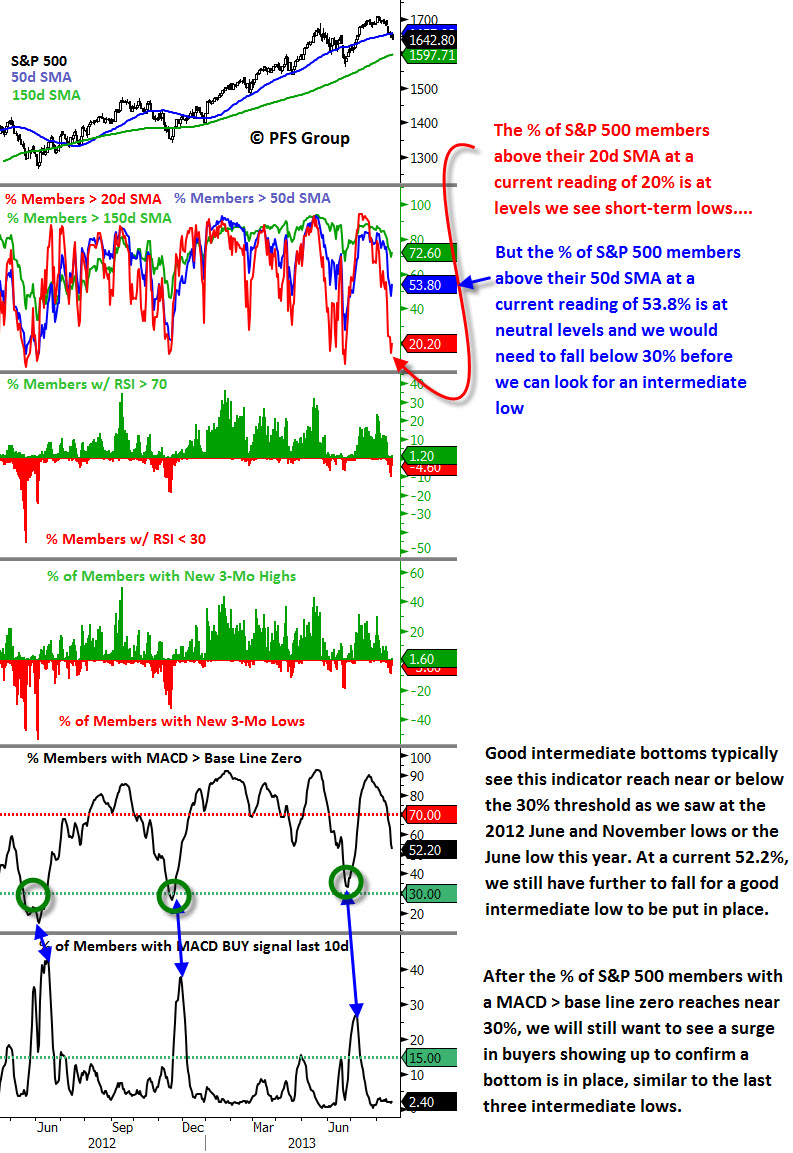 Source: PFS Group
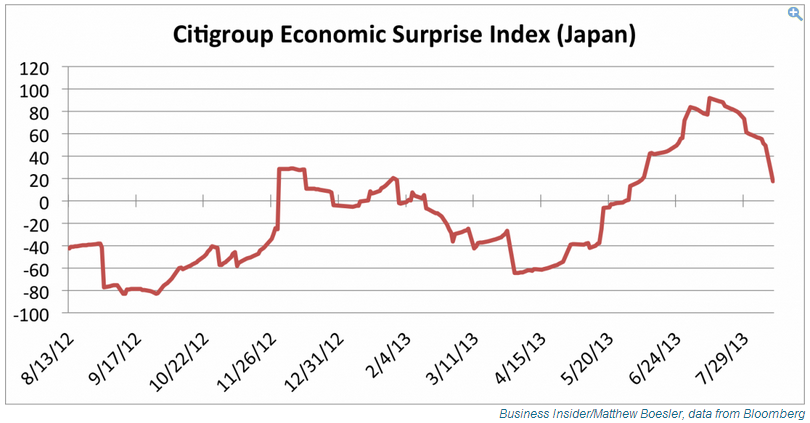
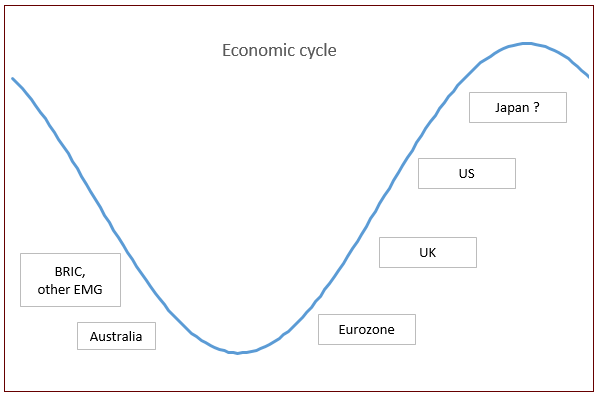
For Japanese equities, this is the picture:
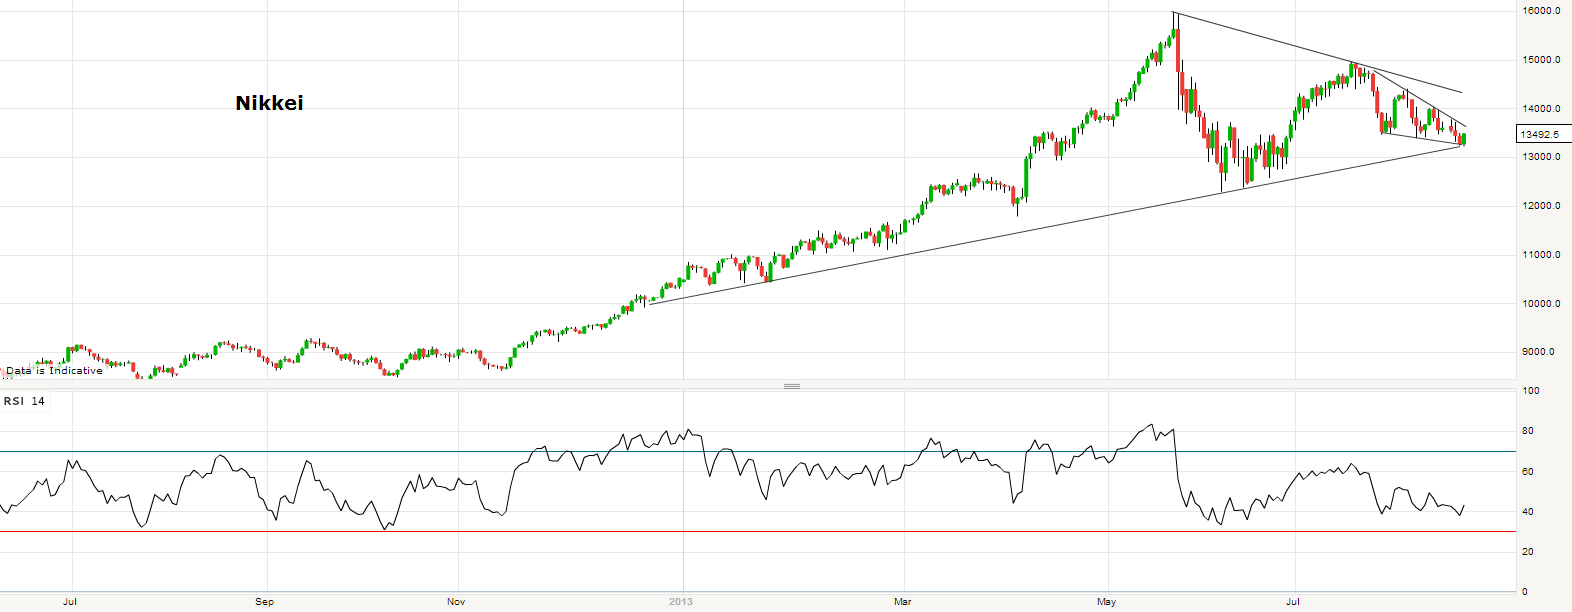
I suggest it is also unclear. Either equities could rally here out of the smaller descending wedge together with the longer term support, or they could break down lower than the June lows to make an overall ABC correction from the peak. I would feel more confident about the former option if leading and coincident data had not been so much worse this month than last. Still, I may yet act here, will see.
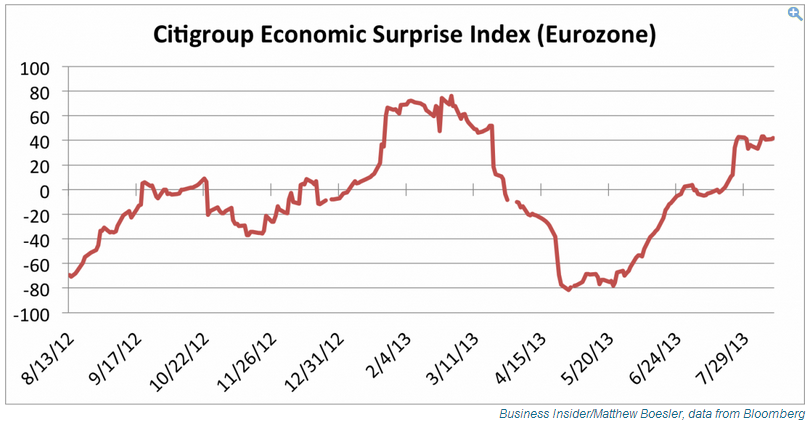
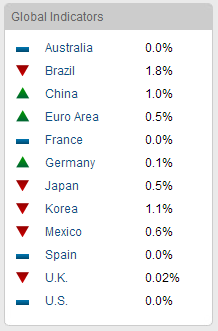
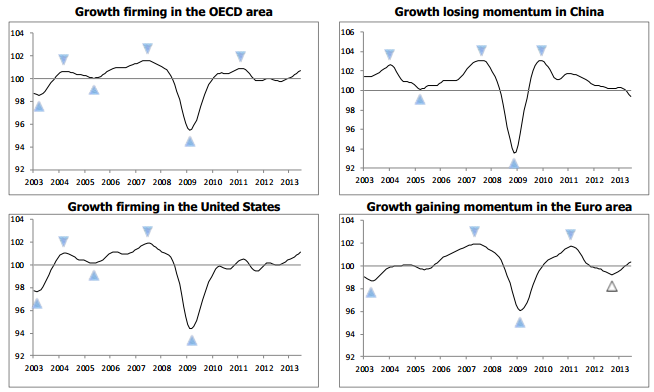
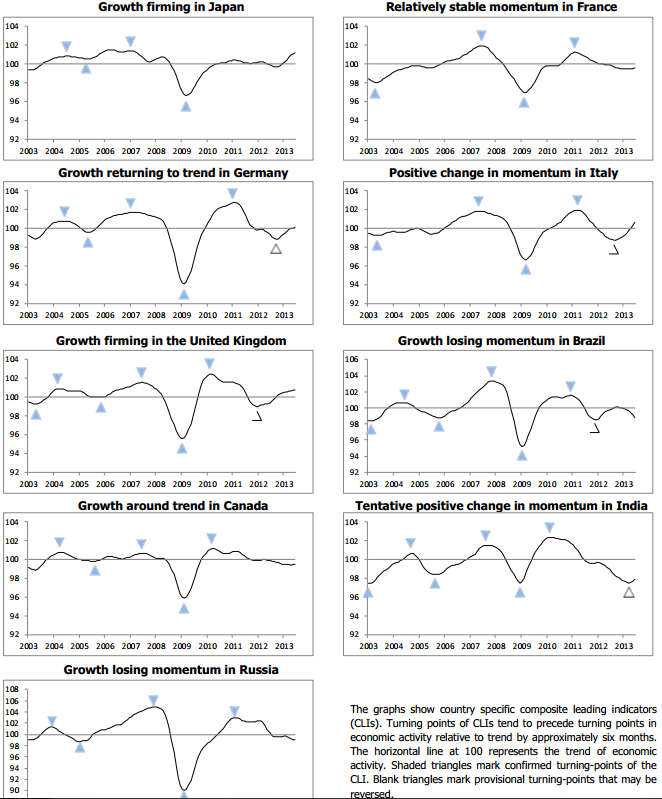
All the CB leading indicators are in for this month apart from Eurozone:
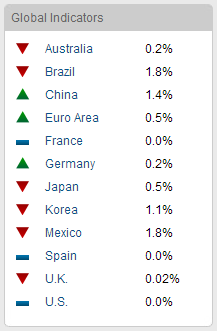
Source: Conference Board
But combining German, French and Spanish readings, the Eurozone number is likely to be weaker than last month’s 0.5 but still positive. The stand out is China, with a rise to 1.4%, and this is echoed in the latest flash PMI reading, a sharp improvement:
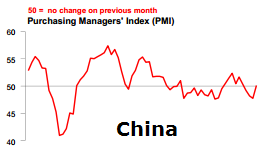 Source: Markit
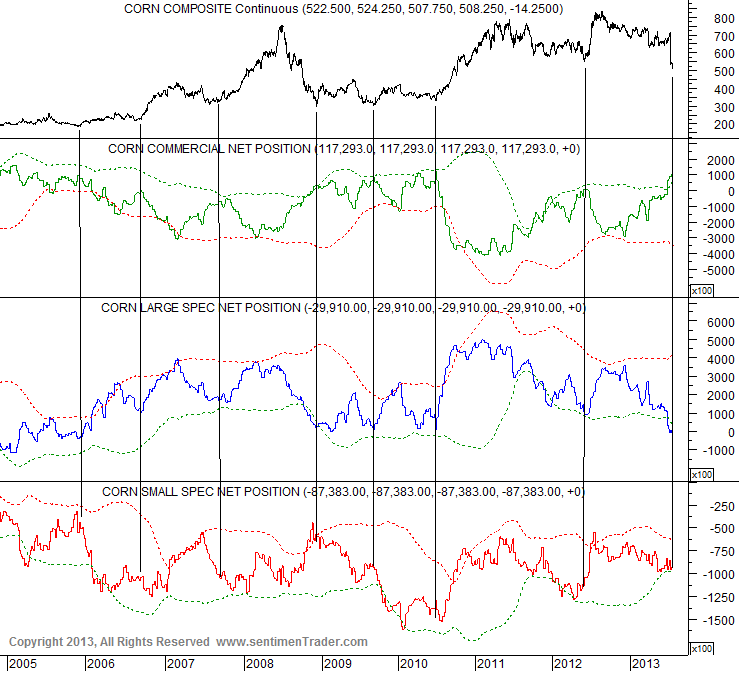
This bodes well for commodities.
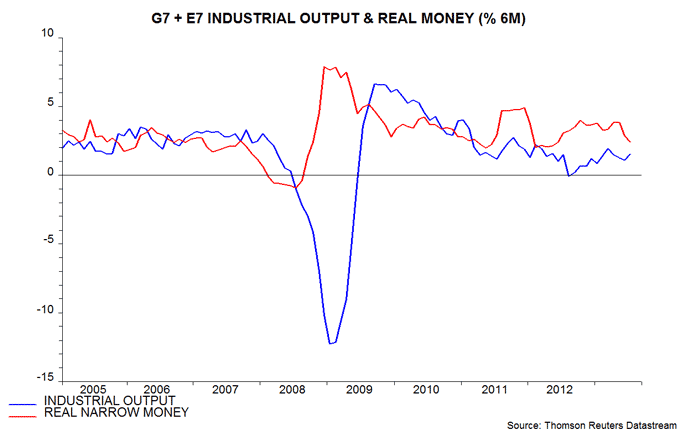
The latest picture for narrow real money as a leading indicator suggests that economic momentum will top out in October / November and begin to fade at end-2013, according to Simon Ward:
 Source: MoneyMovesMarkets
This would fit well with a scenario of stocks completing their topping process in the Autumn and commodities accelerating to a peak after stocks. It has been historically normal for stocks to peak ahead of the economy (once leading indicators are trending down) and for commodities to peak last once the economy has already dropped into a downtrend.
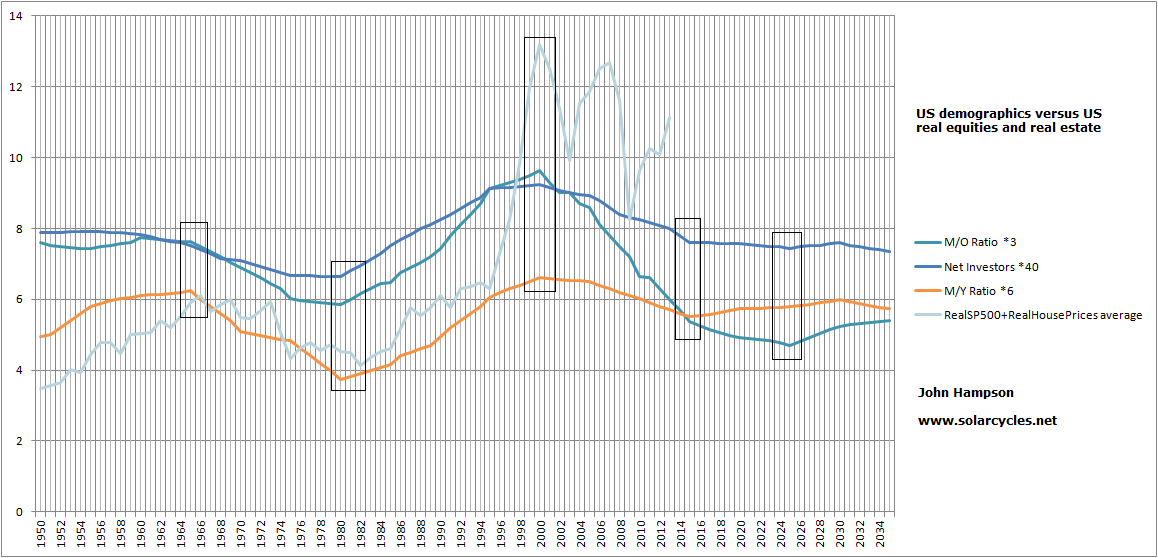
My last chart is courtesy of Megane Faber showing trends in CAPE valuations of all the major countries, to which I have added the text of the demographic peaks:
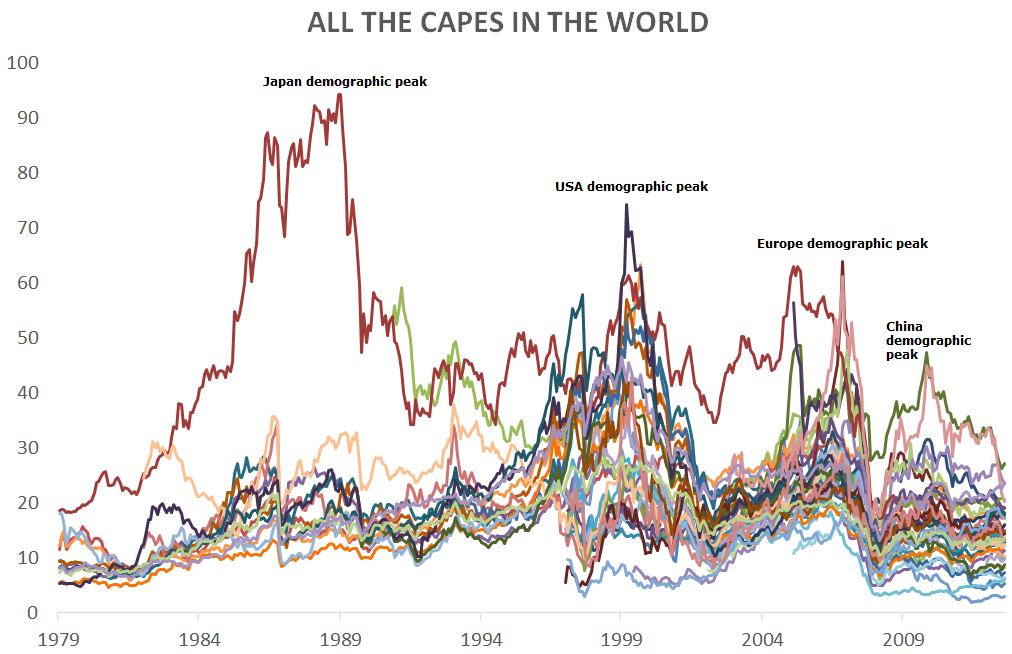 Underlying Source: Megane Faber
By my demographic work, CAPE and P/E valuations must be understood relative to demographics. A high valuation can and will go higher if the demographic trend is positive, and vice versa for low valuations. What we face now is an unprecedented downward pull in demographics from USA, China and Europe, i.e. a massive proportion of the world’s GDP. The obvious candidates for future CAPE spikes at this point would be Brazil and India, as they are both in the world’s top 10 biggest economies and have positive demographic trends. However, they would likely need to first grow into bigger more self-sustaining economies and, if that were possible, it will take time given it would take place against the collective downward pressure from the majors. In short, I don’t see a major CAPE spike on that chart coming for some time.