
This is the latest geomagnetism forecast versus the SP500. The forecast extends to the beginning of September and as can be seen has further transformed from a downtrend to a sideways/up trend.
 The SP500 notably diverged from the model throughout July, more so than other indices which have more closely tracked the model. The outperformance of the US stock indices has meant p/e valuation has now increased to make the US amongst the world’s more expensive:
 Source: FT
Is this justified? Not by demographics. Here once again is my real US equities plus real US house prices model versus 3 demographic ratios for the US:
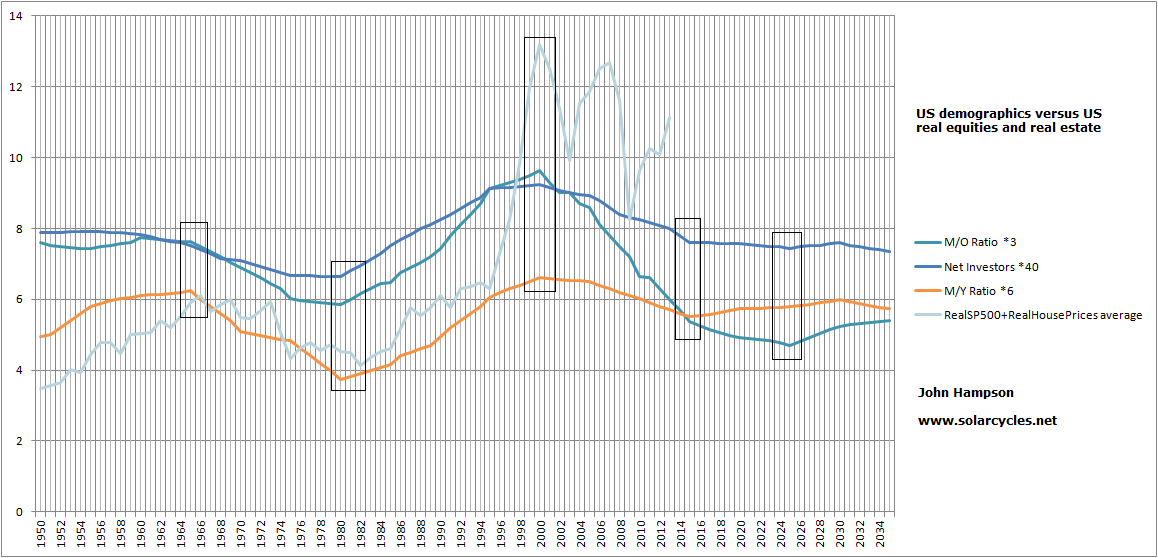 That model has edged further up now in mid-2013 as real equities are back at 2007 levels and real house prices have edged up a little more (though are still a long way from the real 2007 peak). Yet the 3 demographic trends call for the model to collapse once again, as in 2001 and 2008. What makes demographics more potent this time around is that China has joined Europe and the USA in an unprecedented collective downward demographic pressure.
If we take the best of the three demographic measures, middle to young, only, then this is how it looks:
 Source: PFS Group
Is it possible that the 2014-15 bottom is near enough and that stocks have taken off already? Well that p/e10 now stands at around 25, having bottomed in early 2009. That would mean p/es bottomed out around 5-6 years before the M/Y ratio, whereas in 2000 and 1982 the two peaked and troughed at very similar times. In the 1960s there was more of a gap, with demographics topping out a few years before p/es, but note it was demographics rather than p/es first, and this is echoed in my demographic work on Japan and UK, namely that if there is any lag it is demographics changing course first. In short, another cyclical bear in US stocks still looks the most likely course to me, and this is further cemented when we draw in all demographics measures, demographic pressures in China and Europe, and other US market valuations such as the Q ratio.
However, current leading indicator data is still largely positive for the USA at the moment (e.g. latest Markit PMI), and Europe is showing renewed strength (Markit PMIs, Conference Board). In fact it is the demographic-positive markets such as Brazil which are showing particular weakness. So what’s going on? I suggest commodities have played a key role in this. Lower input prices have boosted the developed economies and stocks. Commodity-economies such as Brazil have suffered. If commodities can rally again and make a historically-normal late-cyclical peak after stocks have peaked then I suggest the demographically-challenged major economies won’t be able to handle the renewed input price pressure. I believe the weak global recovery will topple over if commodities, particularly oil, rise in a meaningful way again.
Here is 30 year treasury yields with CCI comodities index, world equities index and Euro-USD. Euro-USD and commodities could be in a new uptrend that began in early July, IF they can make a higher low here.
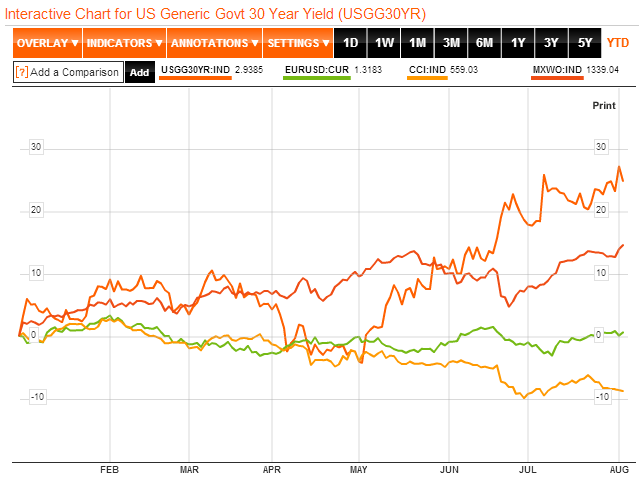 Source: Bloomberg
But too early to say anything more. For me, it remains a game of patience, waiting to see if commodities can start to outperform here. Gold and silver had a very up-and-down week last week. Oil has maintained its breakout but appears to be stalling.
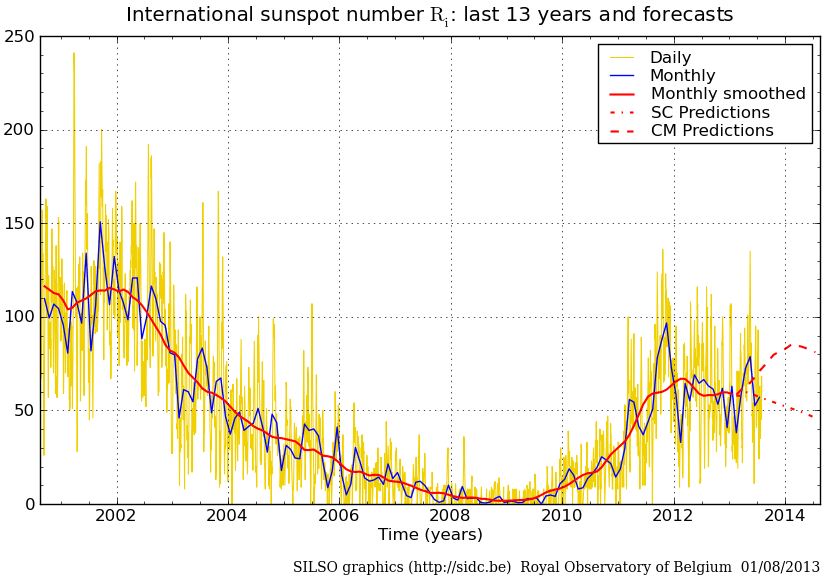
I believe the solar cycle still has a key role to play in the fortunes of commodities. Here is the latest SIDC update which continues to show two possibilities. If the solar max was Feb 2012 then I suggest commodities peaked out in 2011. If this were the case then I don’t believe a new secular bull market in stocks is underway because as per my work secular actually is demographic and the major economy demographics don’t support a new secular bull. I rather expect a deflationary recession to come to pass in due course. If the solar max is ahead as per the second SIDC option then I believe we will see the historically normal late outperformance of commodities from here into 2014 and that will tip the world into recession.

Source: SIDC
In the near term, I am looking at the window from tomorrow’s new moon through to Friday’s end-of-lunar-positive period to take profits on some equities longs and potentially add more short equities. I would like to see stocks advance further this week to do so.

tidal cycle made a low around July 18, and is rising into Sept 10.
Earlier in the sunsput cycle, the sunspots tended to lag about 40 CDs, suggesting a sunspot-top around late October.
Lately however, sunspots seem to be more in phase with tidal cycle, suggesting a sunspot-top around Sept 10.
This tidal top is very weak, the weakest in 4+ years. Could mean that is has very little impact, producing very little sunspots.
Right now sunspots are weak, so lets see if they can grow to Sept 10, and/or the 40 days thereafter.
To me it looks like this sunspot cycle is dead, and the topping platou about to break down. However we have the strongest tidal top of the cycle in January, so have to see what happens there first
JAn 🙂
Thanks Jan
Hi John 🙂
Norway has gone sideways for 3 weeks, and has the difficult consolidation OR flat top-situation. Break up or down of the range?
The range looks like a 3-drive top, also in SPX – allthough a bit hidden.
Norway has not tested 20MA in this range so far, and since 2009 only 3 cases broke up without testing 20MA (Nov 09, March 10 and Sept 10).
And the AD data, 1month cycle and Lunar cycle suggest we break down and make a low in 1-2 weeks.
For SPX I have a bunch of projections suggesting downside, however some also allow breaking up.
-top on extreme momentum i May suggested a higher top 50-60TDs later, then a deeper correction. And we are now at 50+ days
-closing above upper bollinger 17 days ago. The common pattern is either a pullback and upswing, or grinding up ~3 weeks and then pullback. SPX has done the latter, and should pullback from here
-Laundry T-projection has top Aug ~7. Most often it tops some days earlier
-extreme divergence between SPX and tick moneyflow suggest pump before dump, and at least the need for a downswing to close some of the divergence
So my conclusion is looking for a downswing, a flat top, and a possible low in 1-2 weeks.
SPX is ~180 days above 200MA and soon needs to reset that. The scenario for secondary top 50-60 days after the first could suggest that SPX will go to ~1550 next weeks.
However my 6 month cycle doesnt favor any breakdown before Sept ~1
So most probable a pullback 1-2 weeks, and another high in September
JAn 🙂
Looks like a reversal on yesterday’s full moon. Now let’s see if further downside follows as that would add to the topping process ‘look’ as the marginal higher high would be cemented (in US indices). Weaker breadth supports such a pullback (e.g. advance-declines and mclellan summation). Yet fundamentally for the US, PMI data, economic surprises and earnings have all turned in strong.
John, the Blue sky index discussed on multiple sites recently. Would be interesting to have your thoughts in relation to commodities. Cheers.
Have seen that. There are several other indicators flashing as per 2000 and 2007, or in the highest historic percentiles of risk. But then price is clearly back at those kind of levels, so we would expect some. Maybe they will all turn out to be valid warning flags but as always the timing is the issue.
Epiphany on POT, potash that is! 2008 and 2011 looked like major tops in commodities. The break down in potash made me realize the bigger picture in which that fits. Gold and silver broke down. Uranium, rare earth, base metals, aluminum, steel, and coal have all broken down as well as Potash now. The inflation play is a disaster. What is happening? They are printing money like crazy and stocks, RE, and oil are the only markets holding up. Bonds are showing weakness, possibly a deflation play squeeze. I looked to see if a last gasp rally were possible per Gann Master Time Factor and sunspot cycle would happen. It looked like a rally in the softs, grains, and bear rallies in other commodities were the best chance for that. Now the grains have probably broken down as well. The chances for a big rally are possible but seems unlikely considering all the bears running around. Gann is calling Aug 11 as the low for soybeans and Oct 9 for the their commodity average. Other commodity averages topped in1951 corresponding with 2011 for the Master Time Factor aspect. The Master Time Factor is the 60 year cycle. Virtually no one says we are in a commodity bear market, giving a lot of credence to that is why so many are going down.
The USD has been weakening for a month now but commodities haven’t really caught a bid bar crude. That’s a concern. But if crude can continue to rise as a late cyclical most agri should eventually join. We shall see.
Hi! Very good job/site!
About first chart – there must be inverse correlation between SP500 and geomagnetism? In plain words – geomagnetism projecting correction near the august end or i something don1t understand? 🙂
Thank you!
P.S, About commodities – really one commodity that can rally now I think is oil ( if there will be problems in Middle East somewhere). China don`t support rally in others, because there will be growth slowing ahead ( change in economic model from investment to consumptions. And it will require rebalancing and not so fast economy 🙂 ).
So – if economy will accelerate – no big top in equities in near and may be medium term. If not accelerate – don`t see causes for commodities rally – institutionals can`t do this rally ( big), no inflation problem around now, sooo…
And sorry for my bad english 🙂
Thanks Stas. Yes, the geomagnetism is inverted in the chart. And yes, if the economy weakens then it would be hard for commodities to rally, unless we see a combinatoin of geopolitical (oil), climate (agri) and a return to gold as the economy weakens again.
sun’s magnetic field set for a flip in next 3 to 4 months which usually coincides with solar max: http://news.yahoo.com/sun-s-magnetic-field–is-about-to-flip—warns-nasa-131005894.html
Thanks Greg. Anyone know if that normally coincides tightly with the smoothed solar max?
I suppose not, because otherwise nasa would not struggle to predict solar max. The sun’s magnetic field can be monitored fairly accurately. The magnetic field flip generally comes near the middle of the 4 year topping plateau, but the eventual ssn max can always come early or late in that plateau phase.
So far this year there have been only a handful of geomagnetic storms that made it above the Ap > 29 threshold that was used in the Krivelyova study. So. geomagnetism remains a non-factor in the market at the moment. That may change of course, as geomagnetic storms typically peak a few years after solar max.
If early 2012 was the solar max for this cycle, then the geomagnetism max is supposed to be starting now.
There is a correlation between number of geomagnetic storms and the sunspot peak in the next solar cycle. So, very few geomagnetic storms is an indication that the next solar will be very weak. Average year has seen ~35 geomagnetic storms (Ap>29), and we remain well below that average.
Thanks Danny
Thanks Niels. This link appears to suggest the relevant flip already happened cementing the Feb 2012 solar max:
http://beforeitsnews.com/space/2013/08/the-suns-polar-magnetic-fields-have-reversed-and-will-soon-completely-flip-magnetic-polarity-2464064.html
Hi John,
In the bottom of that article is another link – solar polar fields, with graph, where is written this: “The development of the solar polar field strength throughout a solar sunspot cycle can be used to predict the magnitude of the next cycle and the peak of the current cycle. Polar field reversals typically occur within a year of sunspot maximum”
I suppose, that is important. If polar field reversal should occur within 3-4 months, as is predicted right now, than solar maximum in february 2012 is definitely not “within a year” of polar field reversal – it doesnt fit at all.
And you can see on the graf, that solar maximum 1980 and also 2000 both occured AFTER polar field reversal – within a year.
Solar maximum could be still ahead, and occur shortly or within a year AFTER polar reversal will occur.
OK, thanks Peter
Funds are sitting on a record short position in corn, wheat and bean oil. The crop is 3 weeks late. Any frost in Spetember adn we can lose a good portion of these crops. With funds record short could be fun. I also see the USD posed to break down could be a perfect set up
Thanks Tom