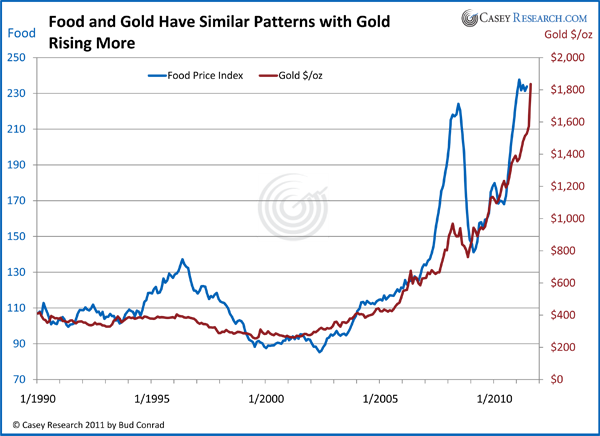
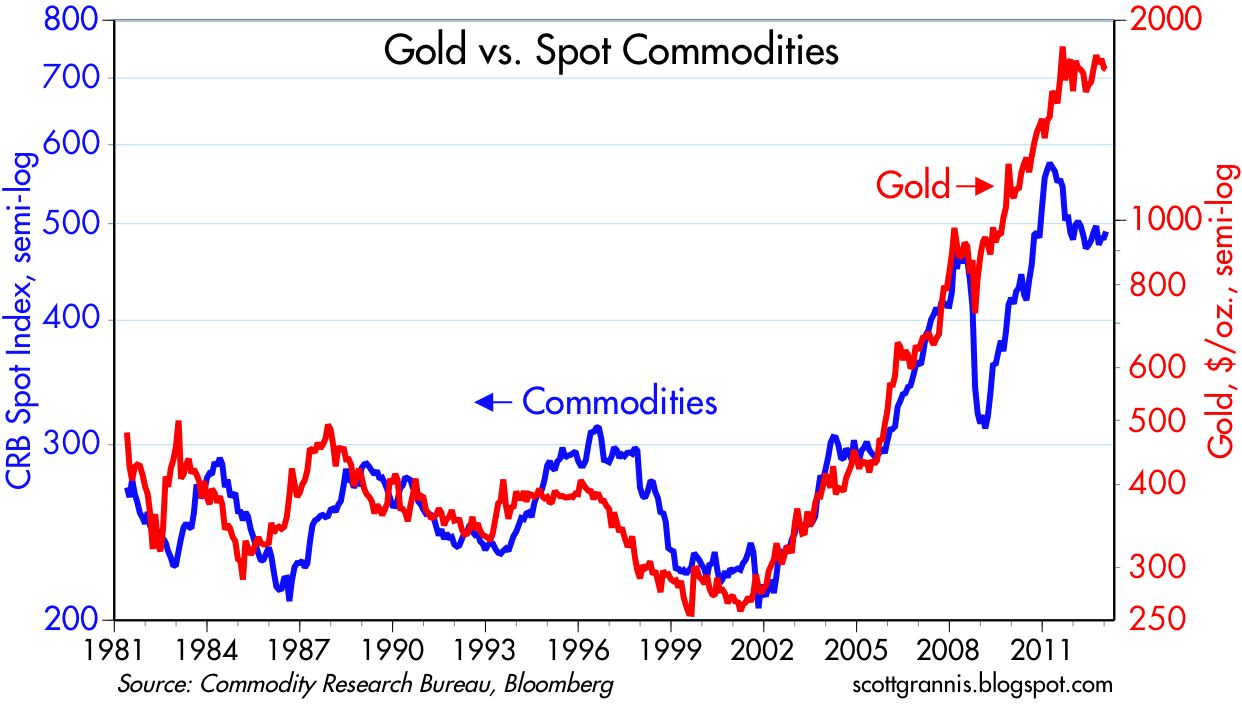
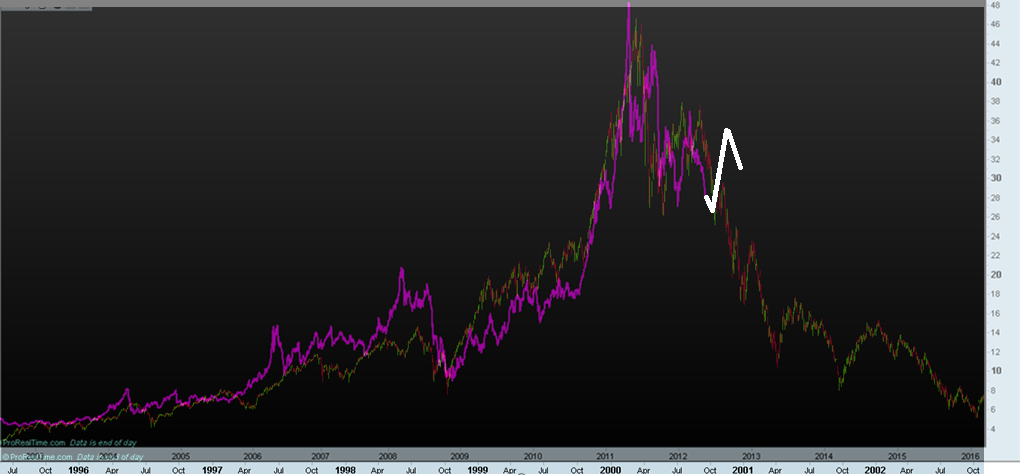
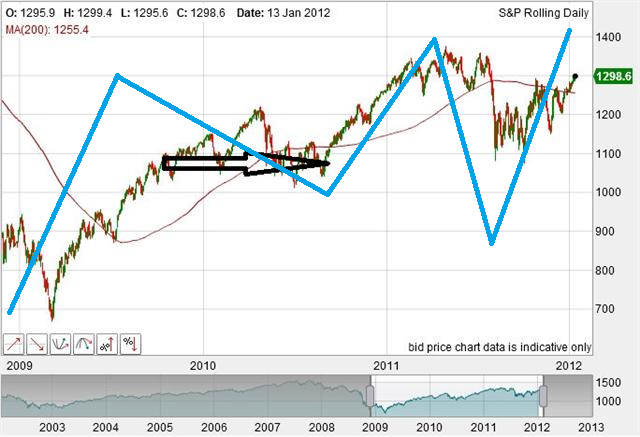
What if commodities already made their secular peak in 2011, as potentially shown by the equally weighted commodities index?
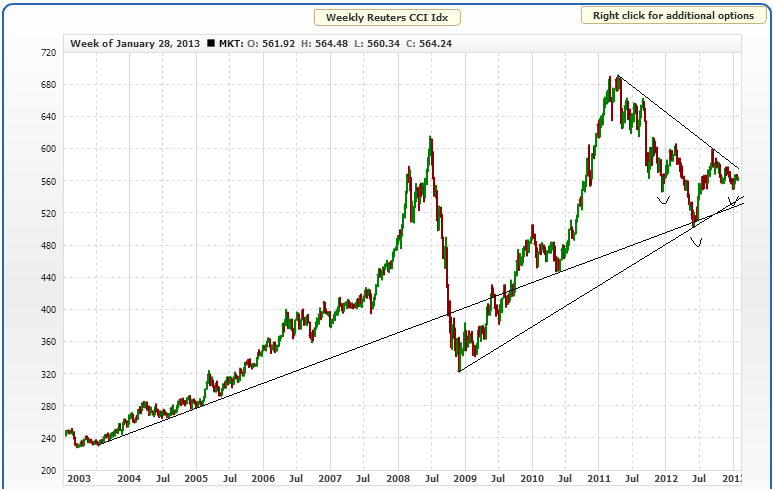 Source: MRCI
If they did, then what should lay ahead (by solar/secular history) is an ‘echo’ bounce, whereby commodities rise again but fail to make a higher high. Barry Bannister modelled it so:
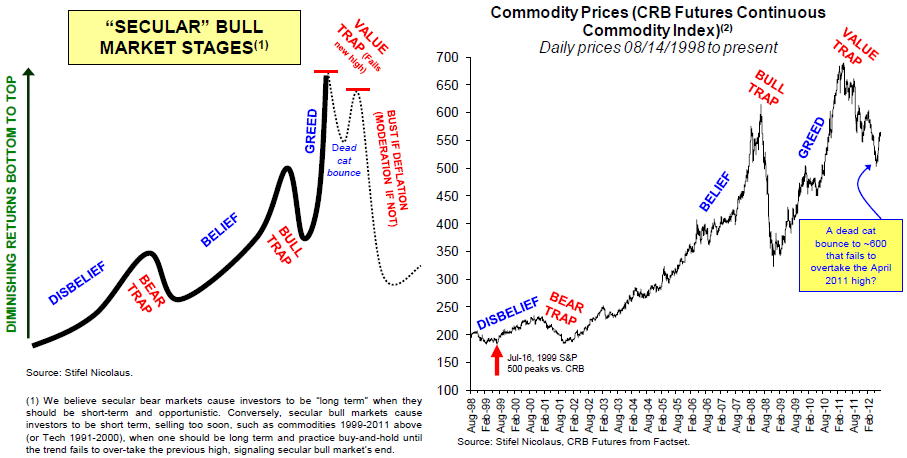 Source: Barry Bannister
If this is a K-winter and the leading commodity class is precious metals, then silver fulfilled its remit to deliver a secular parabolic finale with a subsequent collapse down the other side in 2011:
 Source: Trading Charts
By solar cycles, this could be an acceptable scenario if sunspots already peaked, as per the ‘SM predictions’ alternative shown by SIDC below:

Source: SIDC
It would mean a solar peak occurred at the turn of 2011 into 2012, and that would make a 2011 secular commodities peak within a historically normal close time range.
The Dow-gold ratio has not hit the extreme of the last secular commodities peak (circa 1980), but could be considered to have reached low enough for a secular conclusion: out of the green band below. The low to date was reached in 2011, which fits the scenario I am outlining.
 Source: Sharelynx
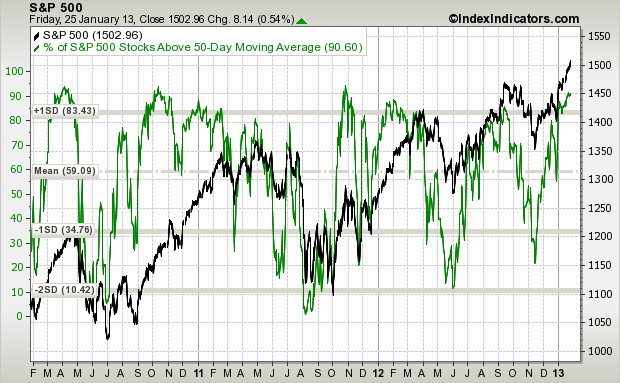
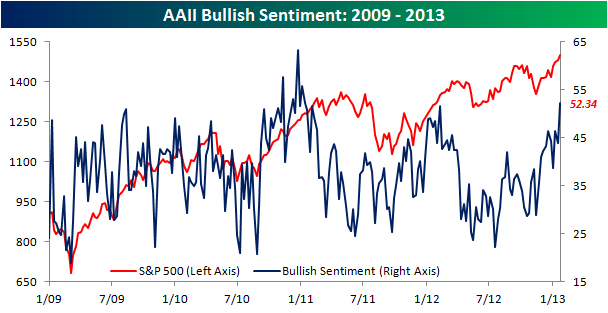
If commodities already made their secular peak back in 2011, then we should be in a new secular stocks bull. So what if the final cyclical bear (with the secular bear) and secular p/e low valuations already occurred and is not ahead?
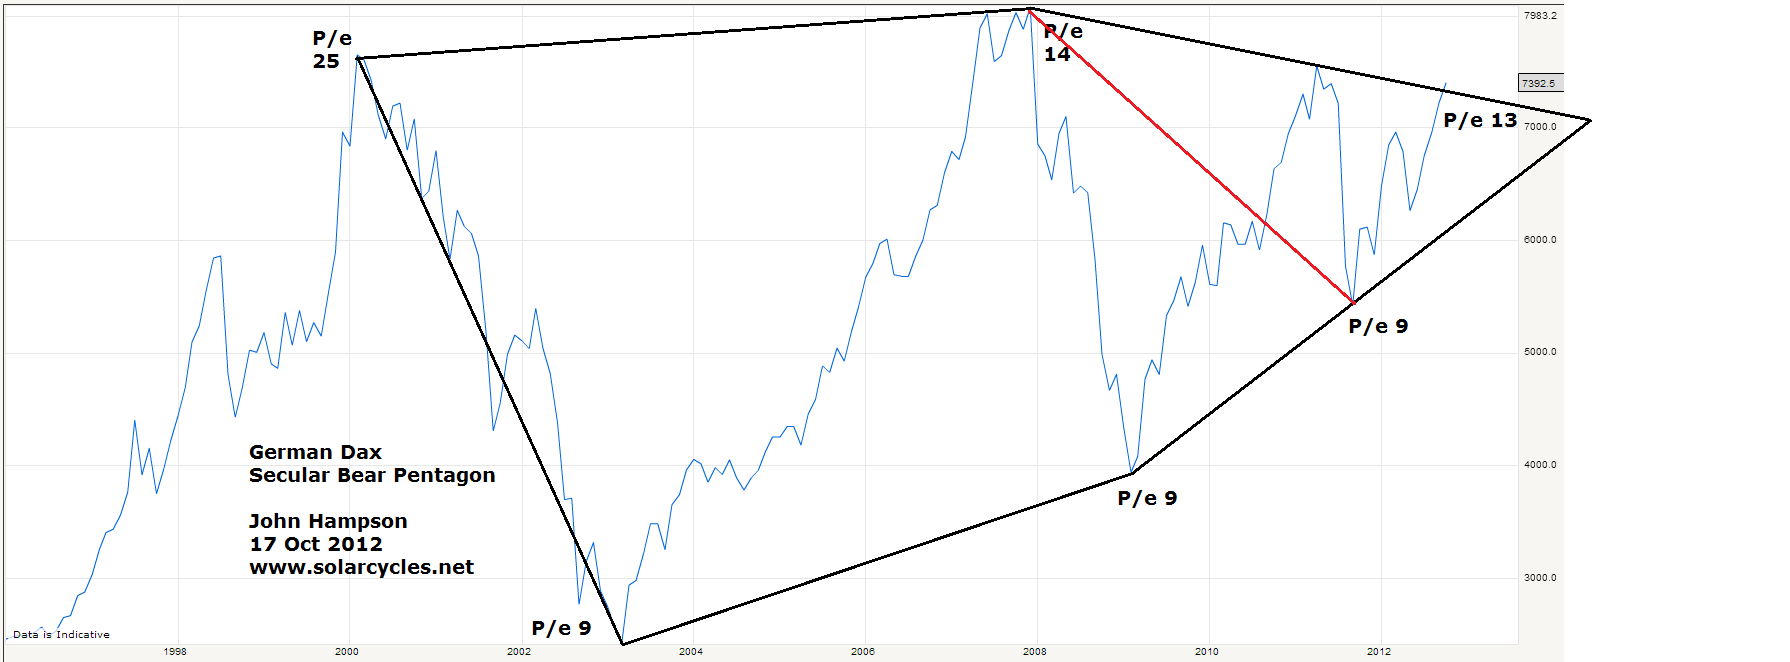
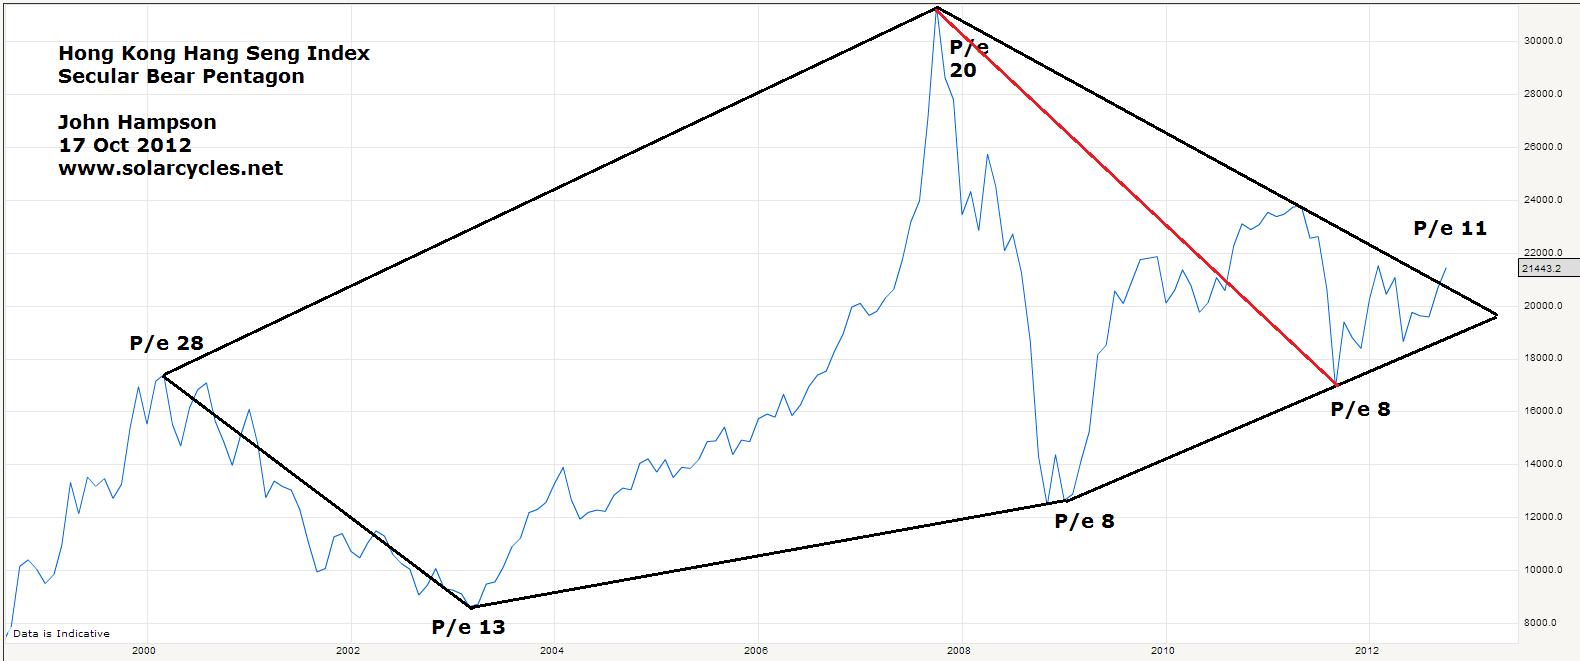
A couple of charts from October last year showing how that could be so. What if the secular bear pentagon for the Dax needs redrawing as per the red line – that the market broke out in 2011 then retested the nose level of the pentagon later that year (in a final cyclical bear at that time), reaching a final single digit p/e valuation of 9?
Ditto for the Hang Seng here, ending with a p/e of 8:
 Clearly p/es of 8 and 9 fit the remit for a secular bear single digit p/e cheapness conclusion. But what about the SP500? It only reached a p/e of 13 at that point. Well, at the end of the last secular stocks bear (circa 1980), although multiple country stock indices reached single digit p/es, not all did. The Nikkei bottomed at a p/e of 20.
Furthermore, if we widen to consider CAPE valuations, Greece hit the lowest ever seen of around 2 last year, i.e. a secular cheapness extreme never before reached (Thailand held the record with 3 during the Asian financial crisis). If we consider price to book valuations, Japan reached below 1 and Russia also. So again, if we are looking for evidence that the secular bear washed out equities sufficiently, then we can make a case.
If the sharp falls in equities in 2011 represented the last cyclical bear of the secular stocks bear, then there should be some telltale pointers. For it to be a cyclical bear, it should take at least 20% off prices. For multiple indices this was so, with both the Dax and the Hang Seng dropping 30%. That cyclical bear should precede a recession, and such a recession occurred in Europe and Japan, amongst others, in 2012 (in a ‘double dip’). That cyclical stocks bear should have begun from a situation of excessive rising rates and inflation. We saw both sharply rising European yields in 2011 and a rise in inflation because of commodity prices.
If this alternative scenario is correct, then the implications would be significant. It would mean that the point at which to load up on equities already occurred in late 2011, and that what we are seeing currently is new secular bull momentum. It would mean that commodities, as a whole, should now make a lower high in a last chance to sell out of them before they are mired in a secular bear. It would imply that the current pick up in global growth is the real deal, and that growth will now sustain going forward, with central banks unwinding their support.
So what are the problems with this alternative scenario?
1. The consensus between Nasa, Sibet and SIDC (CM) is for a solar peak ahead later in 2013, so I rate a peak in the past as lower probability.
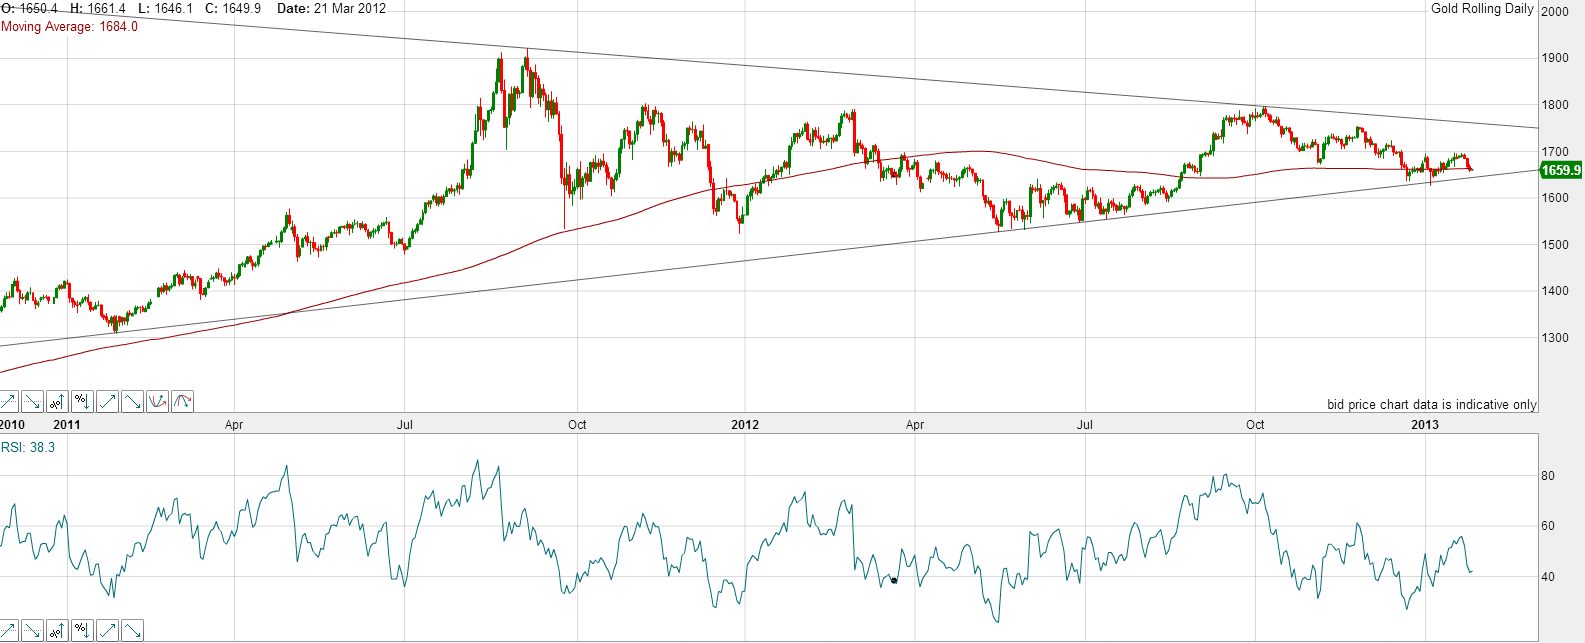
2. Although silver achieved the parabolic and the collapse in 2011, gold appears to have coiled near the highs in a more measured fashion which does not look like a secular top.
3. In the post-gold-standard world, a lower secular finale dow-gold ratio than 7 might be expected.
4. There has perhaps not been wide enough falls into secular cheap CAPE and p/e valuations, not enough country indices outside of Europe. Ditto the Q-ratio valuation for the US market.
5. Although we did see rates and inflation up in 2011, bond yields outside of Europe were conversely ultra low, and inflation did not exceed the 2008 peak.
There are a couple of ways we can judge the validity of this alternative scenario going forward. If sunspots suddenly make a sustained rally to a new high then we are likely still rising to a peak. Conversely, if stocks continue to outperform commodities and we don’t see a reversal in leadership then we are more likely in a new secular stocks bull, which would be confirmed if commodities top out at a lower high.
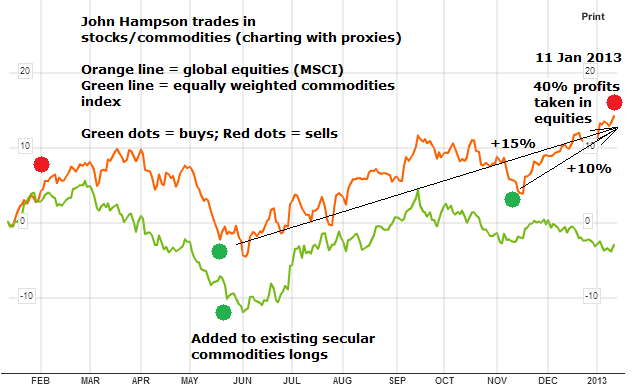
Kent raised a version of this scenario 12 months ago, and Barry Bannister clearly has also considered it. It is frustrating that 12 months later both this scenario and my primary scenario (solar peak and secular commodities peak ahead) are both still in play, with no clear winner, but therefore important to stay cautious. For my positioning – which is long equities but significantly longer commodities – it makes me a little nervous about the latter. If the primary scenario turns out correct then that ample commodities exposure should produce bumper profits, but if the alternative scenario is correct, the key is to identify the top of the ‘echo bounce’ or lower high in commodities, and not get stuck with tumbling positions that are unlikely to recover for a long time.
Would be interested in your input on this. If you have additional evidence for one scenario or the other, I’m all ears.