

There is downward pressure into this coming weekend’s full moon, and we see what look like topping formations on the Dax and Nikkei. However the US indices (bar the Nasdaq) have broken out on good internals, and the environment for stocks continues to be supportive, so I don’t believe we see a cyclical top here, but still believe this could be the start of such a process that lasts the whole of H1 2013. Treasury yields have pulled back a little and their trend is unclear. Commodities as a whole remain on the cusp of a breakout but equally this would be a suitable point to pull back.
More leading indicator updates came in from CB and the current picture is this:
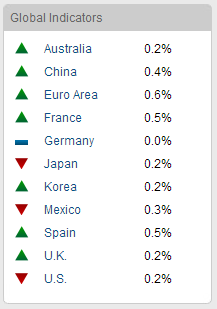
Source: Conference Board
In short, weak global growth ahead, nothing too impressive, but no threat to pro-risk currently. To add to that, in the wider environment we do not yet see frothy inflation, overheating commodity prices or particular tightening of yields. They would all usually mark cyclical tops.
Economic surprises for the US have tumbled however and have just slipped negative. When a trend reversal occurred in this indicator in the past, the market made a swing top either imminently or within a few months.
 Source: Ed Yardeni
Sentiment has also moved up into the top quarter on both II and AAII surveys. Historically this has often been both a sign of strength but of a top ahead, i.e. not a major top right away but perhaps a pullback then a push up again, before topping. That would fit the June final top I have referred to, if so. Here is the bullish percent over call/put sentiment measure:
 Source: Stockcharts
Note how this measure oscillated in the high zone before previous notable tops in this cyclical bull market, suggesting we might be at the start of that process rather than at the end – particularly as I am expecting a cyclical bull top rather than a swing high.
Sentiment on many commodities has much further to run currently, so it is set up for commodities to outperform stocks for a period. But this remains theory until it occurs. A critical test will be how commodities perform if stocks do now pull back for a time. Supporting such a pullback in equities, a Demark buy exhaustion count has been reached this week. Plus there should be typical weakness around the full moon. However the geomagnetism forecast remains tame for the next 3 weeks, which could provide more positive pressure for pro-risk once we are through the full moon period. You can see this and all other updated models on my regular pages.

On a travelling note, we left Borneo for Sri Lanka. Having experienced Colombo we are now in coastal Galle for a few nights.
Hi John
FYI…..We are still at a discount to my modelled price.
OK, thanks Will
A fundamental scenario laid out by Felix Zulauf in Barron’s that ties nicely into John’s call for a mid-year top:
http://www.thereformedbroker.com/2013/01/21/felix-zulauf-growls/
Thanks Gary
John,
Some Charles Nenner predictions according to weblink
http://fundmanagernews.com/charles-nenner-2013
Stocks in an up cycle into mid February 2013 but not certain if it is a long term cycle high or a short term cycle high.
Gold has already bottomed around $1685.
Bearish about bonds having taken a long term position in TBT. He expects yields to rise for the next 30 years.
Oil up until May 2014 maybe all the way up to the old highs because of war.
Jack
Thanks Jack
I think we will rally with minor setback in feb until summer. Commodities start to move in feb and continue to rally all year. Stocks slump at sunspot peak after summer and we have some military conflict. Before slump we push well above old highs in S&P as mom and pop return to the party and bonds get dumped and thrown onto the fire. Statistically in sept-oct. Financials, autos and RIM will go strong until that time. Happy about our Jan 2014 call options strike 25-35 acquired for 10 cents last year. 12x so far. After the slump we have one of the greatest stock rallies in history not to short of a hyper-inflationary scenario. Good luck!
Thanks Robert. I’m not too far from that.
Hey John, what is a Demark buy exhaustion? Kind regards
Tom DeMark’s bar counting signals:
Robert,
Tom Demark is an increasingly well-known and popular developer of market timing tools. His approach is to search for points of trend exhaustion based on (essentially) consecutive closes in the same direction, thus, ‘9’ would represent nine consecutive closes either higher or lower. There’s MUCH more to the methodology, of course, the important point being DeMark has had an almost uncanny ability to call important turning points in markets. Information on him and his approach can be found on the web.
Two important points about his methodology: one, it requires a price “flip” in the opposite direction of the trend that is exhausting itself to confirm a reversal and two, the signals have greater import when one sees trend exhaustion across different time frames, e.g., daily, weekly and even monthly. As John mentions above, we have a daily/weekly exhaustion sell signal in several equity markets, and now await the price flip. Caveat: as Paul Tudor Jones once said, when the signals don’t work, they REALLY don’t work.
Gar
I would agree with the last point you made. I first started using Demark about 10 years ago and, at first, was fascinated by it. It certainly has some qualities that make it a worthwhile input to one’s bag of tricks but the definitive nature of the signals combined with the ability of a signal to change so quickly makes it not suitable for an inexperienced trader. When I say definitive nature of the signals I mean, because of the numbering system novice traders feel it is ” a system” – and it isn’t – it is a tool!
Hi, John. Really like your web-site. You are doing great analysis. Just want to share with you some interesting staff from McClellan financial publications on correlation between oil performance in the past and stock market(US) performance in the future.
http://www.mcoscillator.com/learning_center/weekly_chart/oil_predicts_stock_market_dip/
The basic idea is that Dow Jones today follows the price behavior of crude oil 10 years from now, which means we are going to have an important low this autumn(2013) or next year. And then the bull market is going to last till 2018!! In 2018/2019 we may have a massive sell-off as crude oil price collapsed in 2008. But again, once that sell-off is done, another big rally in 2019-2021.
John, what you think about it?
Thanks Vlad. I have seen that Mclellan correlation before, and I think it’s misleading. Generally speaking a secular stocks peak can occur one solar cycle after a secular commodities peak, approx 11 years, so we see that alternation. This is what’s underlying I believe, rather than that crude can ‘predict’ stocks 10 years in advance, so I don’t expect stocks to follow historic oil’s twists and turns, only the general similar secular path. The problem with a lot of his work is he doesn’t look for explanation, only correlation, and therfore produces as many red herrings as valid relations, IMO.
Blue in Winter? Blame the moon…
A good read, thanks Gary