Still the bulls have the ball, and still we can’t say for sure whether we are in a bear or a bull market.
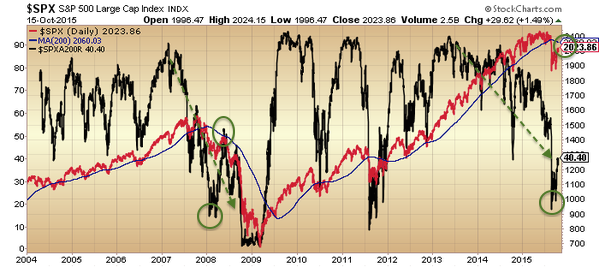
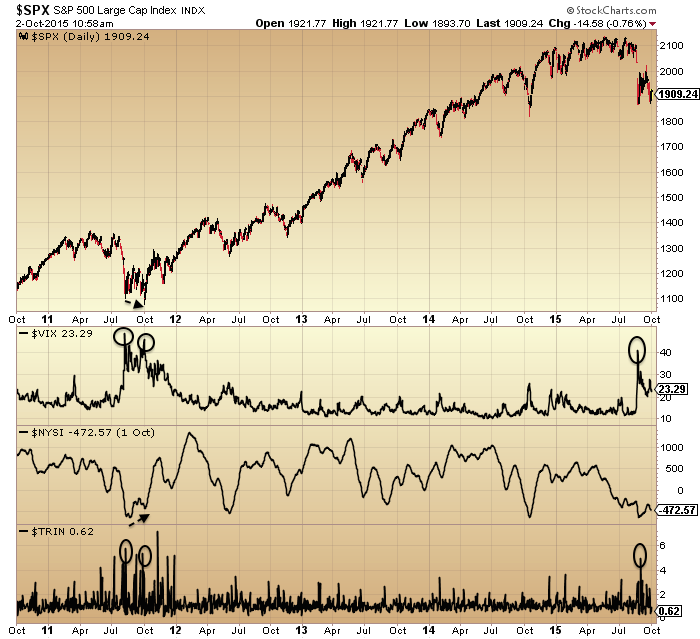
Bullish percent, volatility and breadth still make this look like a bear market rally. The SP500 is at the 200MA. If this is a bear then it would be normal to be repelled here, making this the ideal second chance peak to short. If this is a bull then we might still expect a pullback like in 2011 before breaking back above the 200MA again.

If instead equities power directly upwards back to the highs, then it would be another thrust like in October 2014.
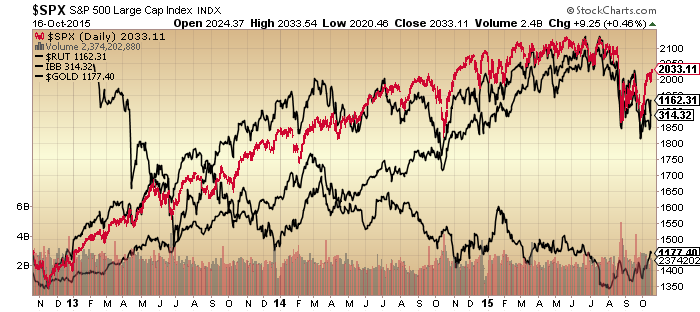
Here we see that it is US large caps which are looking particularly bullish, whereas US small caps, junk bonds and the FTSE (and most other indices) all look more bearish.

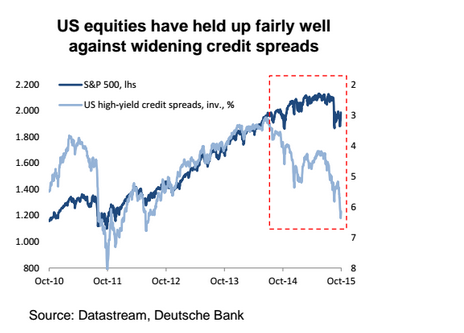
However, note how in Q4 2014 junk bonds and leveraged loans diverged negatively but turned out to be a false signal as they ultimately recovered once stocks were more cemented in new highs.

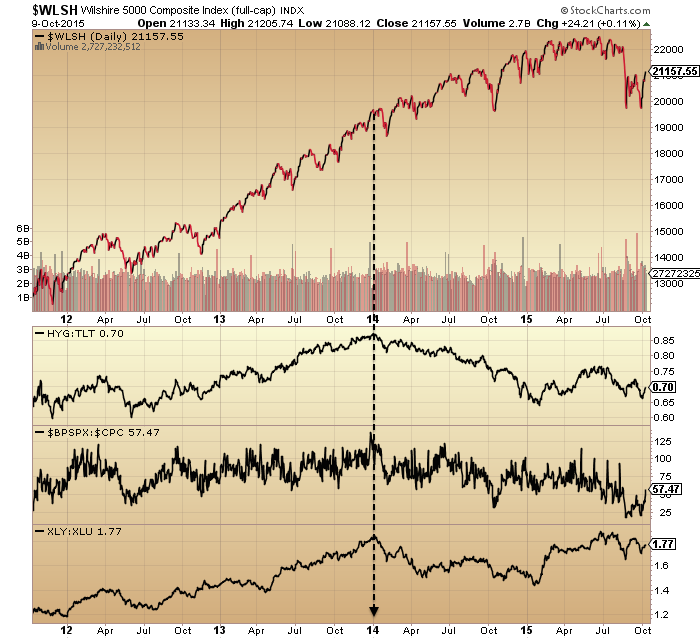
That chart also shows that the rally this Oct has not been as impulsive as last Oct, with the RSI showing a negative divergence and not being stuck in the green.
Additionally, the chart shows the 6 month range of 2015 (boxed). Anyone who bought in that period is underwater and this should create supply from above with price now back at the bottom of that range.
Here we see NAAIM manager exposure. Typically this has been a smart indicator, diverging before important peaks. The current reading is particularly low. This and other low indicators (e.g. II sentiment, Rydex) are bearish unless they reverse. If they start to reverse strongly higher then they become a tailwind.

And then there is gold and miners. A relief rally was due once bullish percent was at zero again around August. But is this the start of something bigger?
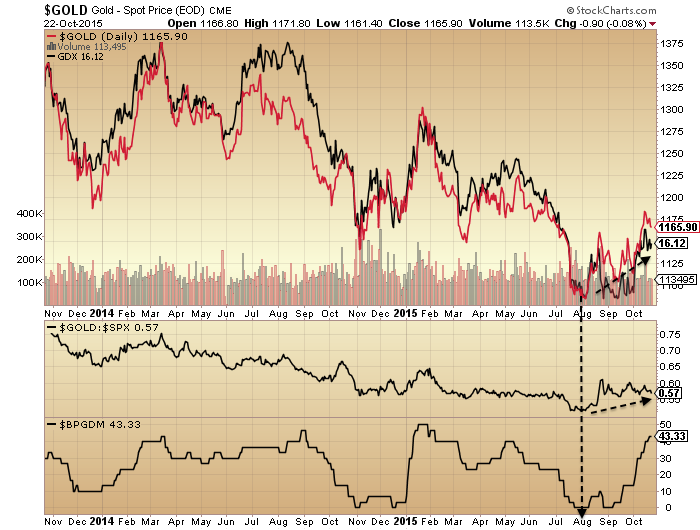
So, there are various tests here. If we are indeed in a bear market (my belief) then we should see (1) stocks repelled from around the 200MA (2) continued weakness in small caps, junk bonds and other riskier assets, no catch up with large caps (3) gold maintaining outperformance relative to stocks.
As things stand, US earnings have exceeded expectations but expectations were low. Currently, Q3 blended earnings are -3.3%, revenue -3.9%. Q4 forecast blended earnings -1.2%, revenue -1.4%. If we take out energy then these turn positive. So that takes us back to the question of whether oil has been a leading indicator deflationary recession here, or whether low energy prices can be a tailwind. But either way, current earnings cast doubt on the renewed bull scenario.
ECRI leading indicators are negative whilst Conference Board leading indicators are positive, but one key difference is that CB use the yield curve whilst ECRI doesn’t. The yield curve can’t turn negative under ZIRP so that creates some artificial levitation in the CB LEI.
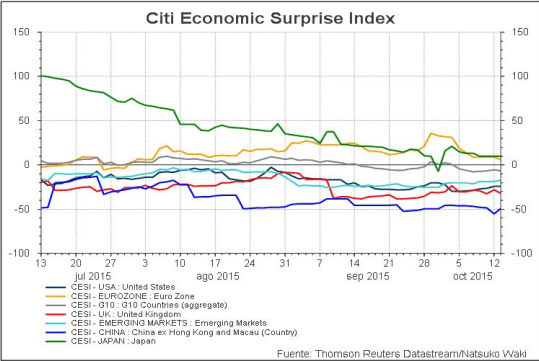
The global picture is one of a world economy on the edge. The question remains whether we are seeing an unstoppable negative feedback looping or just another soft patch, and this will become clearer as time passes. ECB dovishness and a China rate cut both produced positive market reactions – as has been the norm in the last couple of years – but neither ECB QE nor China rate cuts have worked so far and the question is whether central banks are fairly impotent in reality.
The world stock index looks like this:
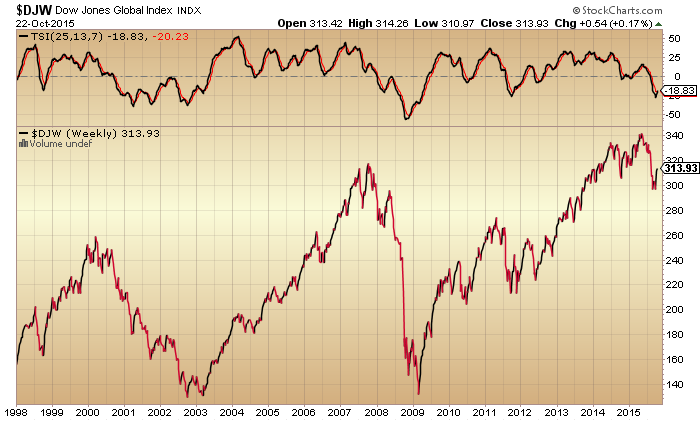
More in keeping with the bearish scenario than the bull.
So, can US large caps lead everything back up again, or are they the last point of strength in a succession of roll overs (oil, emerging markets, China, small caps, Biotech)? Just got to wait and see here, but we are closing on some key checkpoints.
There were lots of people bearish down at the Aug and Sept lows who are now bullish at the Oct highs. Perhaps goes without saying but that’s trading the wrong way round. If you were bullish and bought around the lows, then now may be the ideal time to lighten up as we hit the 200MA and the overhead supply zone. If you side with indicators of a bear market then now is perhaps the ideal price area to be adding or entering short. Turning long from short here or building long at this point is rather unlikely to bear fruit. Never investment advice of course, but we all see these common errors made as people are sucked into the waves of sentiment.
I maintain the likelihood is of a pullback next (historical analogs, RSI divergence, overhead supply and 200MA), from which point the bull/bear balance should start to tip decisively one way.