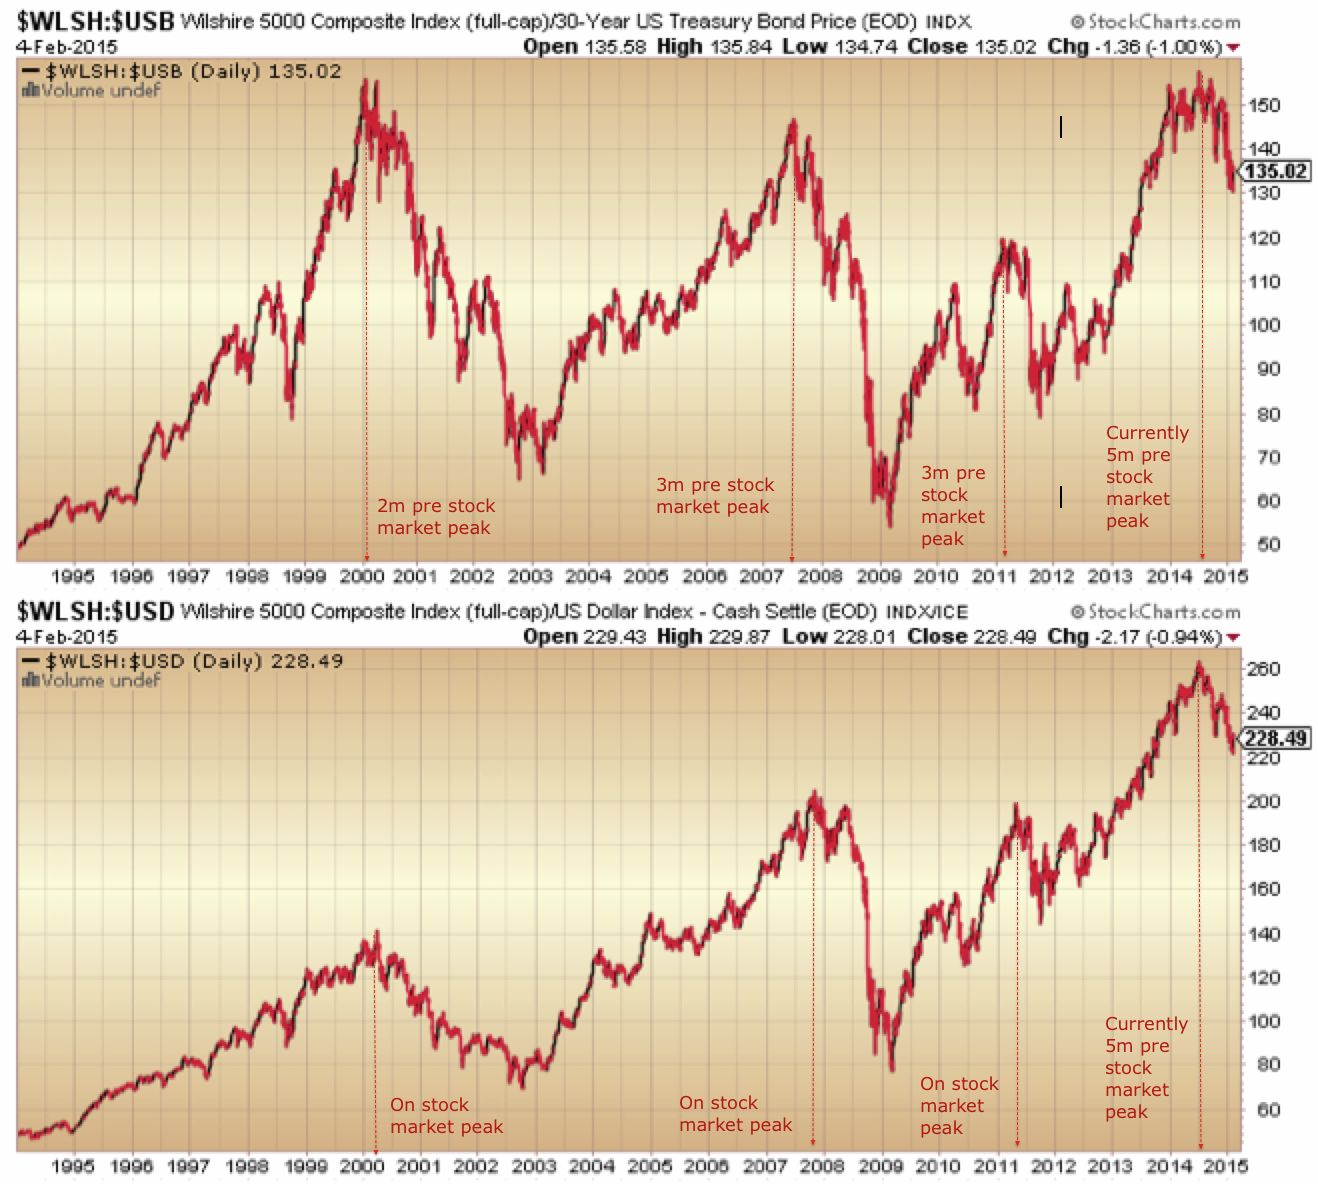
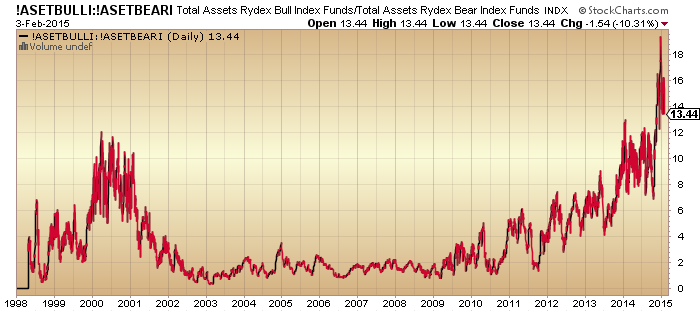
1. US stocks to bonds and to dollar ratios continue to show a clear top mid-2014:
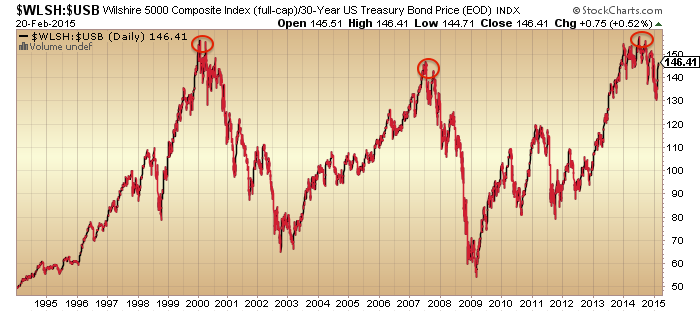
 Source: Stockcharts
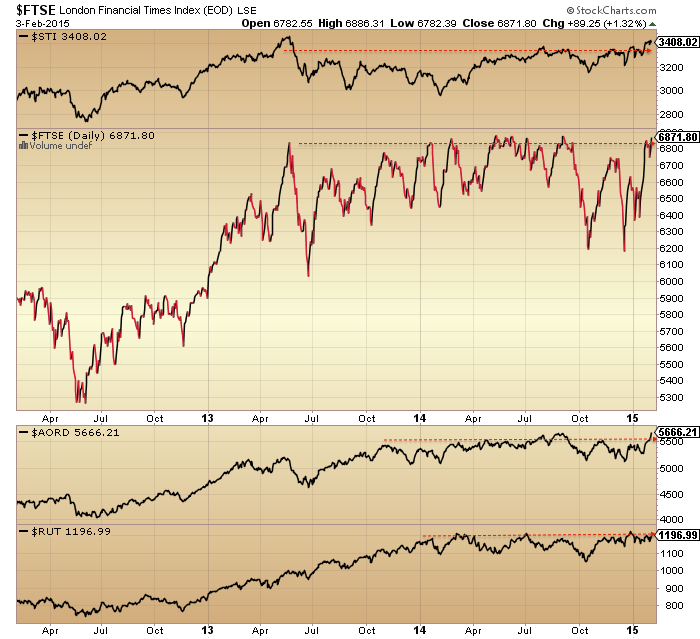
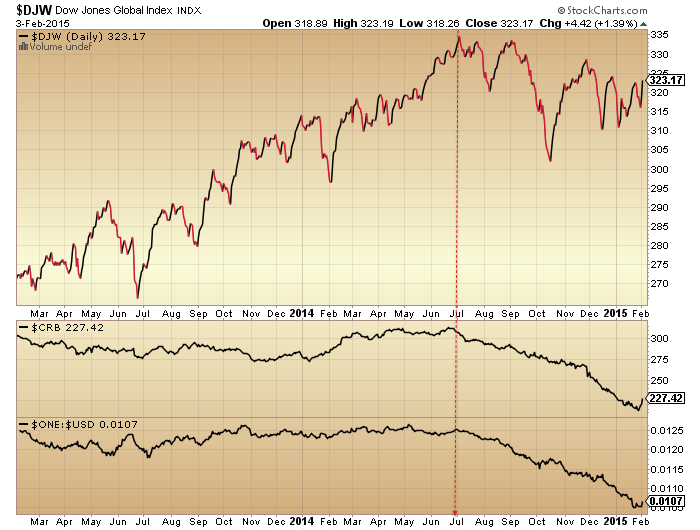
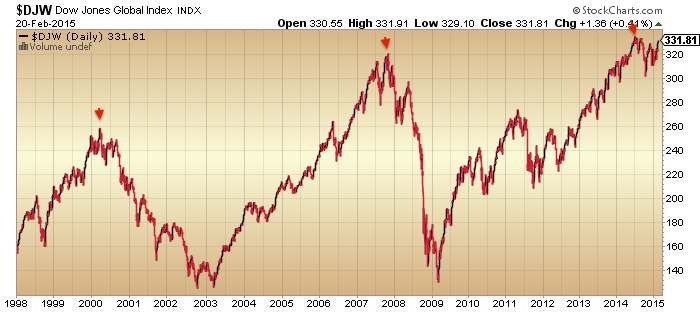
2. Dow Jones World stock index shows a peak the same as the above, but that peak may be under threat:
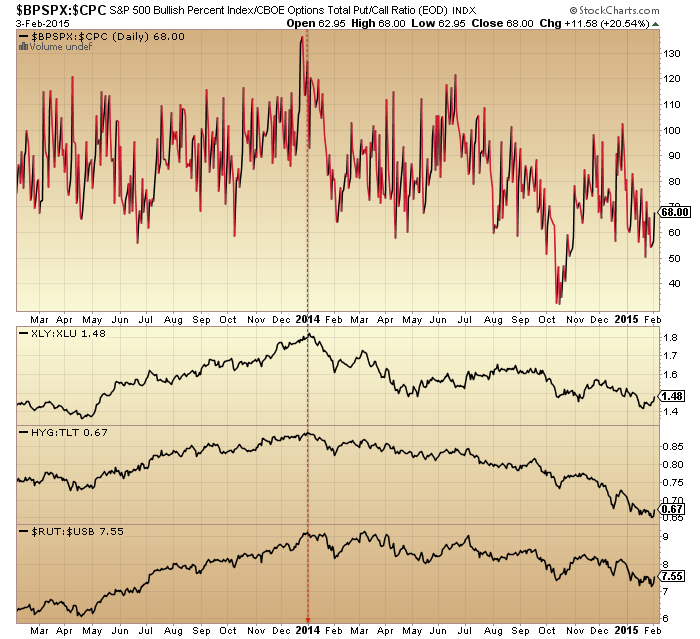
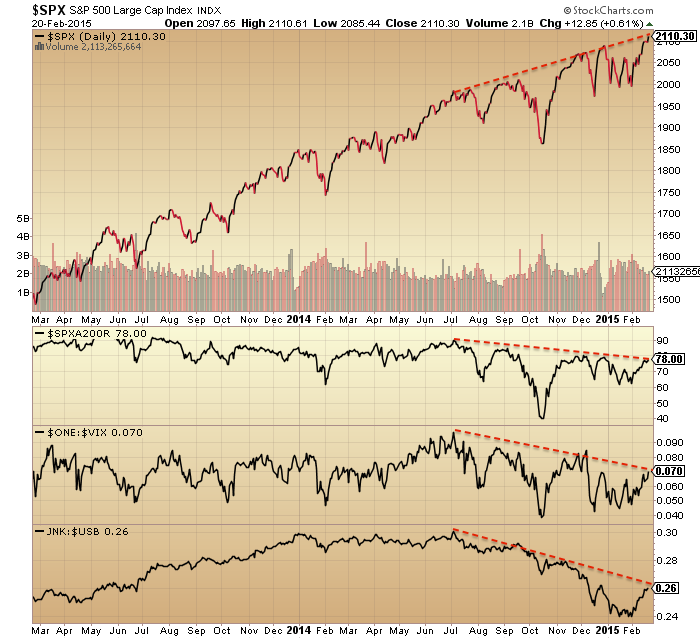
 3. The SP500 has broken upwards to new highs but breadth, volatility and junk bonds continue to show divergences. The resistance levels in all four are now being tested.
4. Various risk measures remain in downtrends since the turn of 2014, though the cyclical to defensive sector ratio has repaired the most in recent weeks.
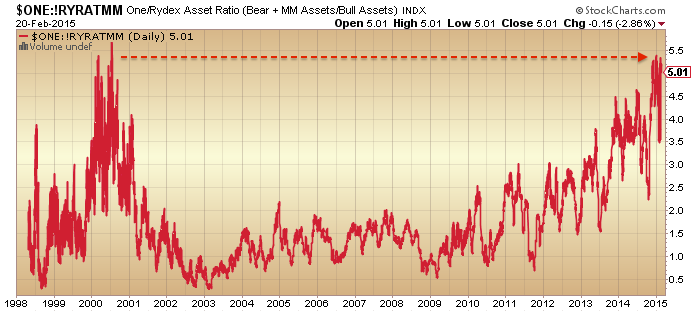
 5. Sentiment and allocations remain at extremes like previous major peaks. Here fund managers and Rydex:
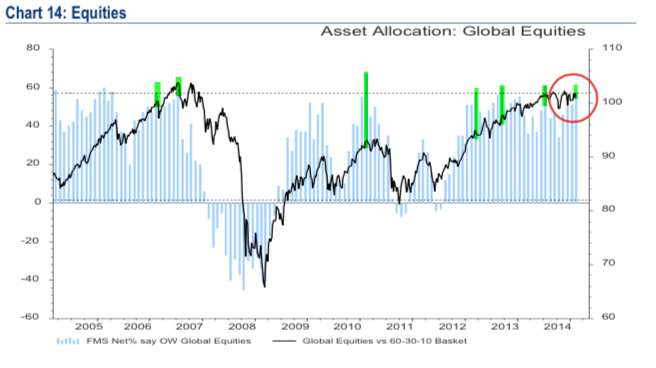
Source: Fat-Pitch
6. Buybacks and mergers have pulled back from their peaks:
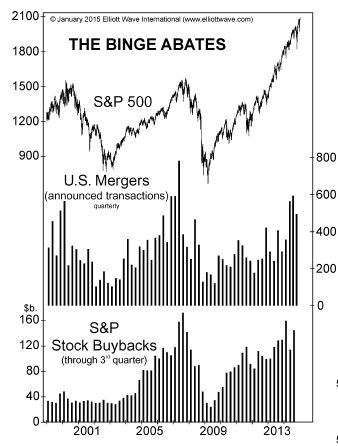
Source: Elliott Wave
7. Bloomberg financial conditions remain in a downtrend since mid-2014:

Source: Bloomberg
8. Earnings growth forecasts have turned down, mirroring the 2007 peak, but price has yet to conform:
 Source: Factset
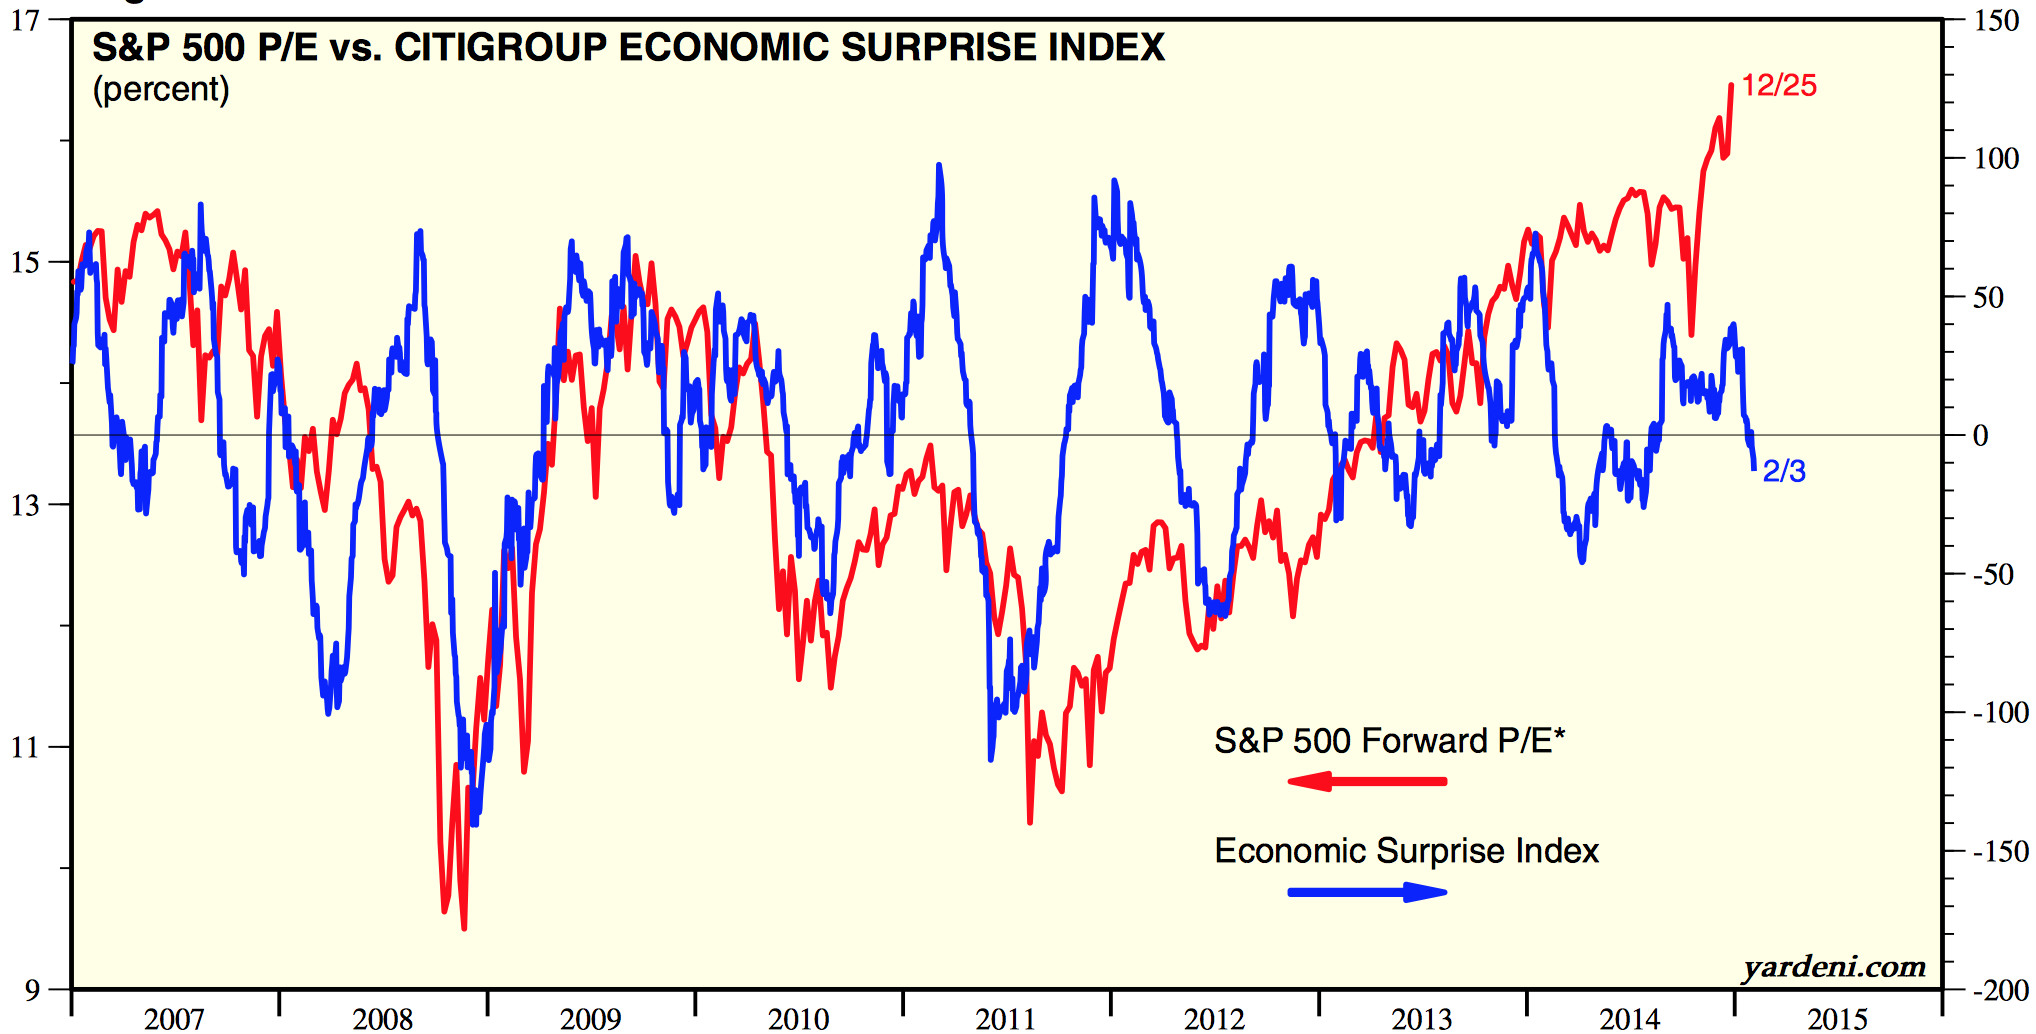
9. The rise in share prices contrasts sharply with current trends in earnings and economic surprises, captured here:

10. The economy is showing signs of recession as evidenced here in wholesale inventories versus sales:
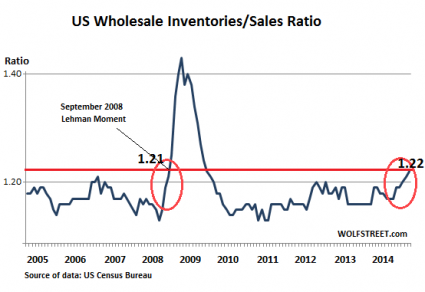
Source: TheEconomicCollapseBlog
11. And leading indicators remain in negative growth and in the big picture continue to show a secular bear market:

Source: Dshort / Ecri
12. Money has been pouring steadily into bonds, with the stocks:bonds ratio in decline since mid-2014.

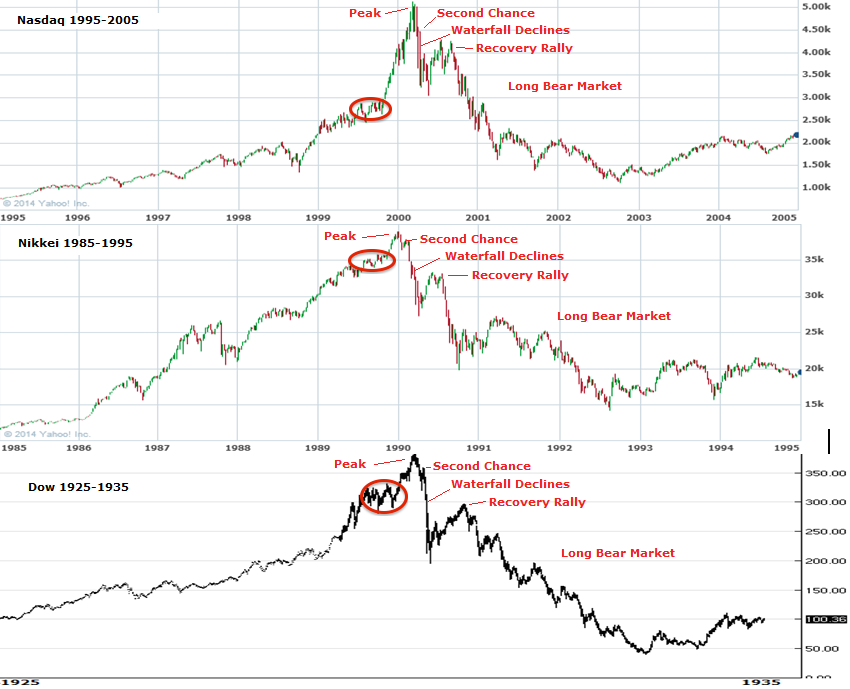
In summary, we see a hallmark, typical, run-of-the-mill major topping process, that fits with the smoothed solar maximum of April 2014. Firstly, the mania and excess is evident in valuations, sentiment and allocations. Secondly, between the start of 2014 and mid-2014 various indices, ratios and indicators made their telltale breakdowns and divergences. Thirdly, leading indicators, economic surprises and earnings have all turned down. Fourthly, buybacks, mergers, margin debt and leveraged loans have all stalled or declined. YET, despite all this, price has not conformed, so there is something missing from the analysis.
I don’t subscribe to the view that the solar maximum is producing an extended mania like in 1929. We see in the charts above that a typical underlying topping process has occurred centred around last April’s smoothed solar maximum. It all fits as expected. But something is keeping nominal prices rising. So what’s different this time? By a process of elimination we do get to the influence of dark pools and primary dealers against the backdrop of QE and ZIRP.
The dominance of the dark pools over the main exchanges the last couple of years is shown here:
 Plus the leakage from the primary dealers (from who the central banks buy bonds with their QE money) into the stock market. 80% of QE money may be parked as excess reserves but correlations and reports suggest some of the rest finds its way into the stock market.

It’s not easy to quantify either influence accurately. However, all historic manias saw leverage rising right into the peak. ZIRP enables the leverage here, but it’s not increasing through margin debt or leveraged loans. Speculation, as measured traditionally, peaked out with the solar maximum mid-2014. All things considered, it would make a lot of sense if, as BC said, several of these major players are driving price and using increasing leverage to do so, as that then explains the anomaly. It would mean the stock market has gone from being fair game governed by natural forces, to one in which – temporarily at least – a few large hands are controlling price to some degree.
If so, it doesn’t change the situation with earnings or economy which are moving the opposite way. It doesn’t stop the bulk of market players behaving as normally post solar/speculation peak, as shown in the charts. I don’t believe it changes the outcome, only delays, the crash. If the bull market has become highly concentrated in a few major hands using dark pools and leverage, playing a game of chicken in the face of valuations, earnings, concurrent and leading indicators, then it would take a broad improvement in all those to sustain it, otherwise the risk is the market collapses at any time as one or more players reverse, in self-interest.
We ended the week cementing the breakout in stocks, and I keep my options the same. Either stocks reverse down from the current marginal new highs, heading for seasonal March/April lows and maintaining the real stock market peak as July 2014 – or – stocks move higher in a final mania that extends to the summer. If the latter looks to be transpiring I won’t be playing the long side. I consider it far too dangerous as a collapse could occur any moment. Rather I would bide my time and short again when the pop looks to be occurring. I continue to watch gold for evidence of a renewed (and associated) move to safety, plus the extremes in sentiment and positioning pro-dollar and anti-euro look set for reversal at any time, which would likely fit with reversals in stocks and gold.
For the time being I will only be posting at the weekend. I have engaged in new projects during the week whilst the irrationality of the markets persist. But I remain poised to attack once they finally break, continuing to monitor each day and read your contributions on the board.