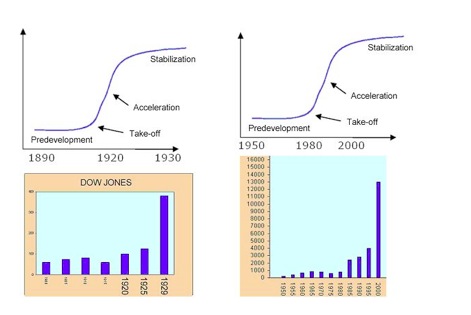
Wim Grommen argues there have been 3 industrial revolutions: 1780-1850, 1870-1930 and 1940-2000. They terminated with major peaks in the stock market and then gave way to degeneration phases.

Source: Wim Grommen
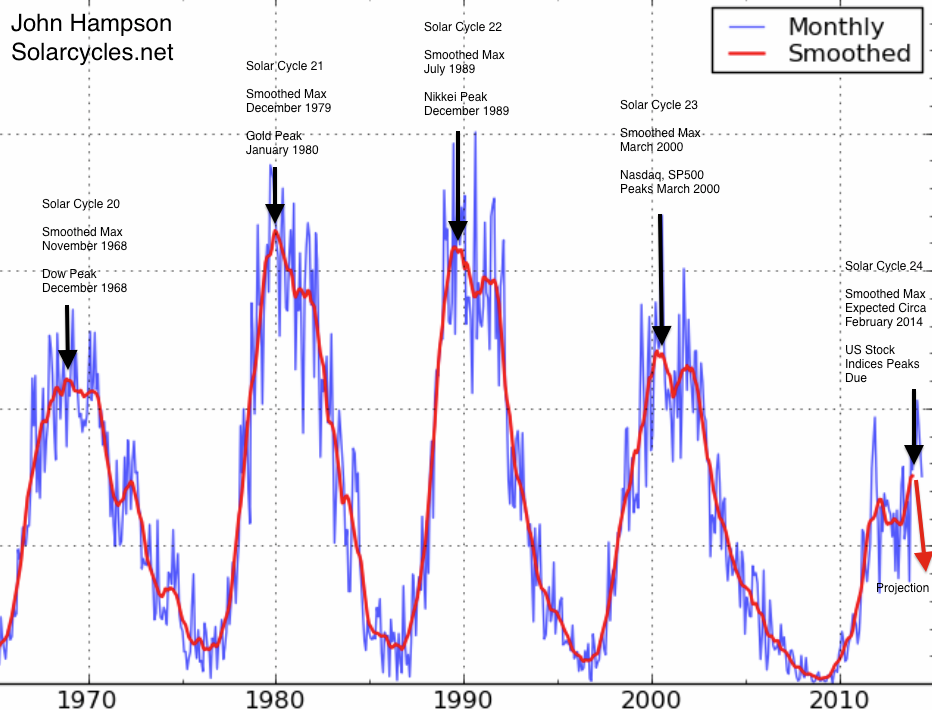
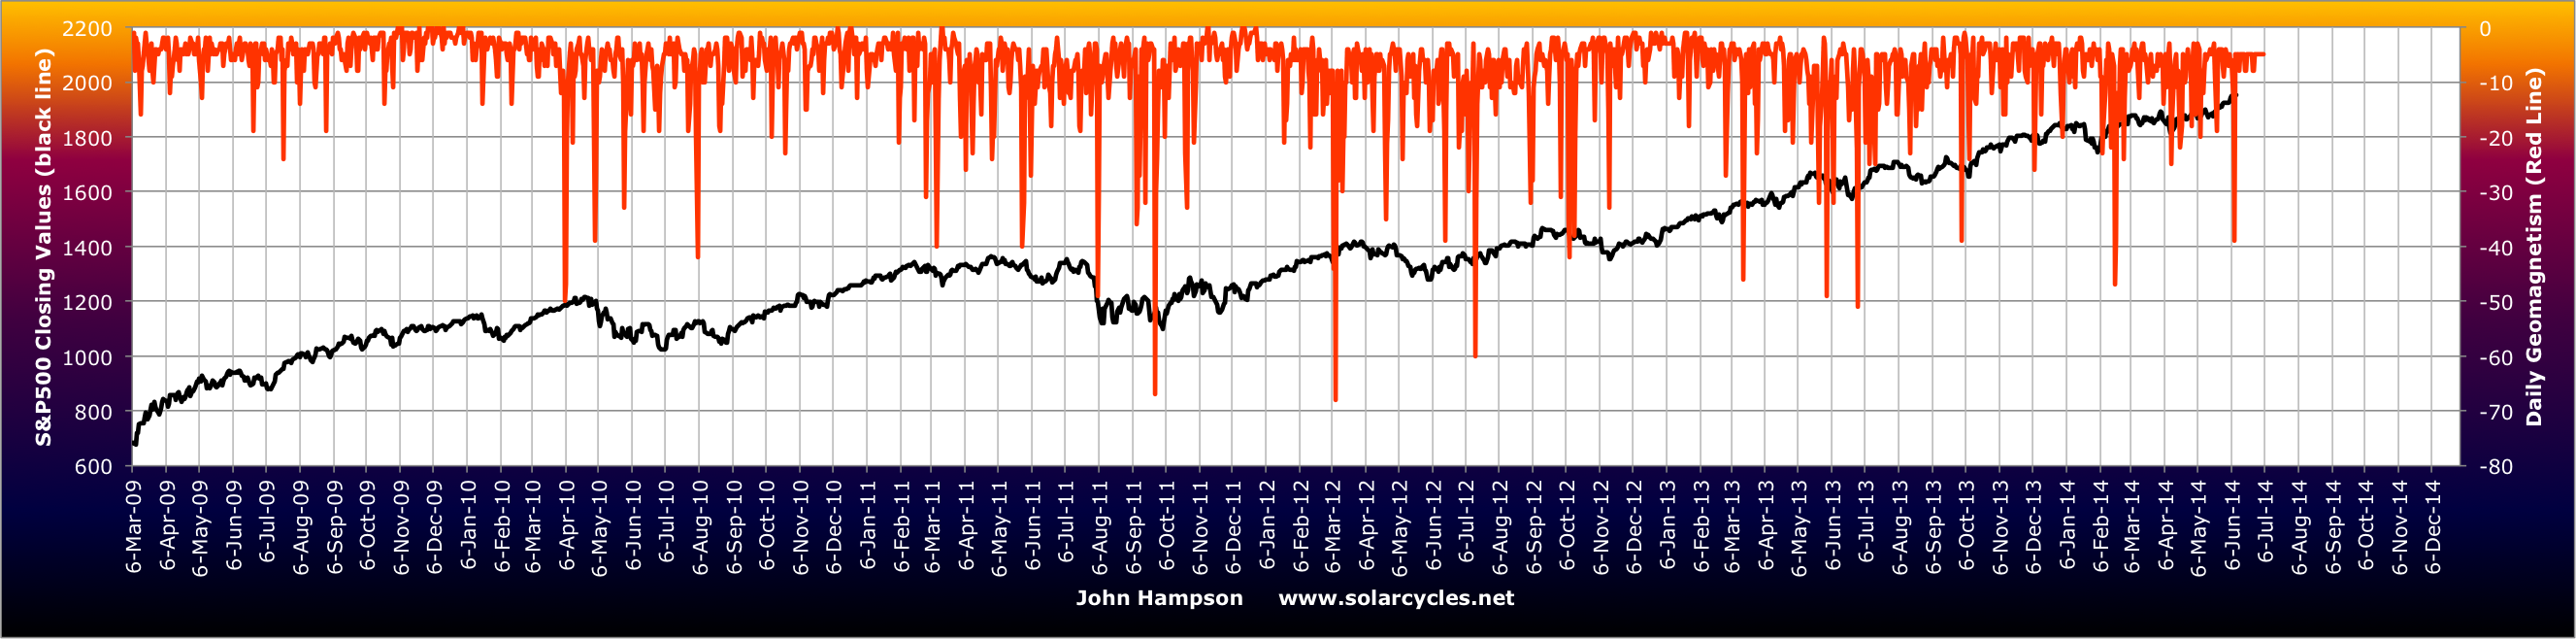
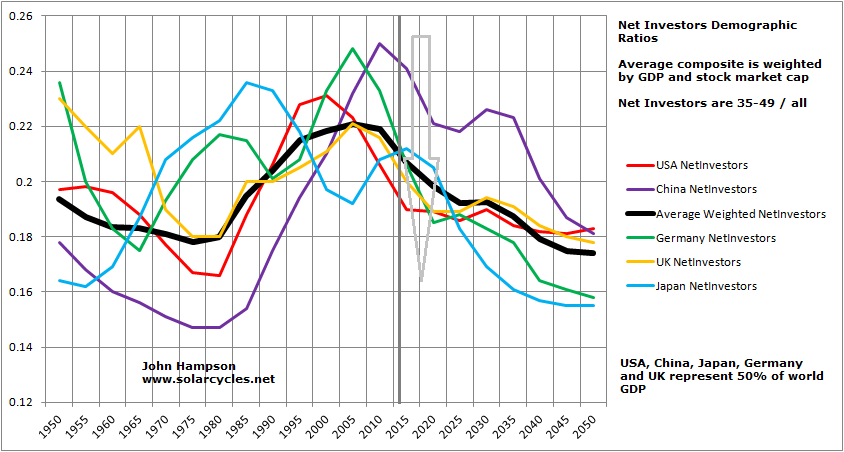
My perspective is demographic booms in the 1920s and in 1980-2000 made for economic and stock market booms, culminating in mania peaks at solar cycle maxima, and then giving way to prolonged economic downturns and secular bear markets once demographics turned.
A third perspective is that both episodes in history were based on a major run up in debt, or prosperity taken from the future:

In short, the two periods rhyme. Parallels have been drawn between the Great Depression and the Great Repression in terms of severity of crisis, slowness of jobs recovery and bank failure risks. Similarly, central bank intervention became a dominant factor, with ZIRP and emergency spending programmes being required.
However, the Great Depression was much worse in impact when we consider number of failed banks, level of economic decline, drop in prices, and this despite the 2000 asset boom being a more extreme mania than 1929. One key reason for that was the aggressiveness of central bank response this time round, with more flexibility and conviction to draw down harder and faster on prosperity from the future.
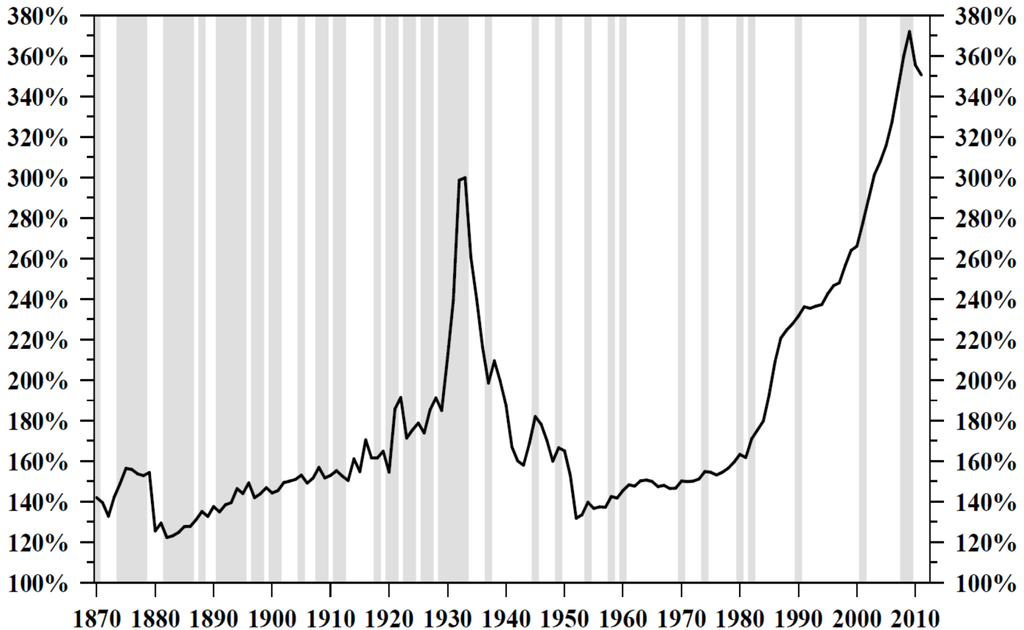
Central banks cannot overcome demographic trends and post-mania busts, but they can postpone their full impacts if they are prepared to pay for it, helping stop the devastation being so front-loaded. So, the bear market from 1929 to 1932 was totally devastating and took valuations straight to bottoming levels (shown at -56% below), whilst the 2000-2003 bear was halted at still expensive valuations. 2009 then washed out valuations lower, and I believe we are on the cusp of another bear which will wash out properly. In other words, central banks have succeeded only in phasing the devastation, and the next leg down ought to be the worse: more of a deflationary depression.
 Source: DShort
That projection can be cross-referenced with the demographic trends chart further up the page, and is further strengthened at a global perspective by similar demographic trends in Europe and China.
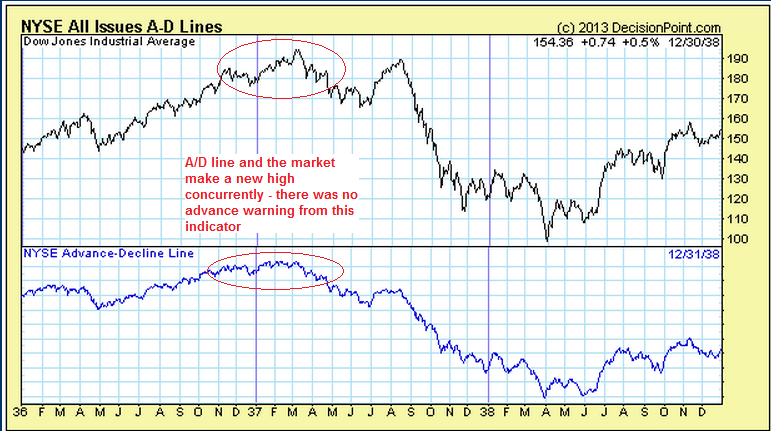
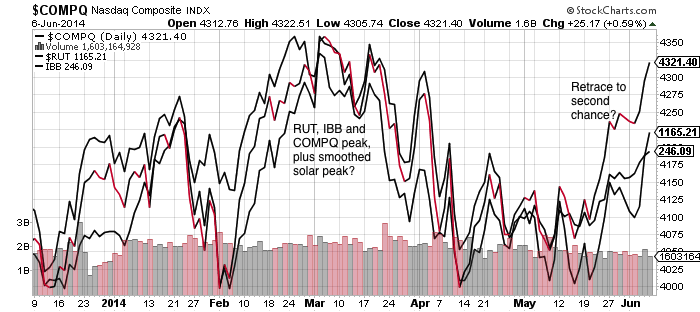
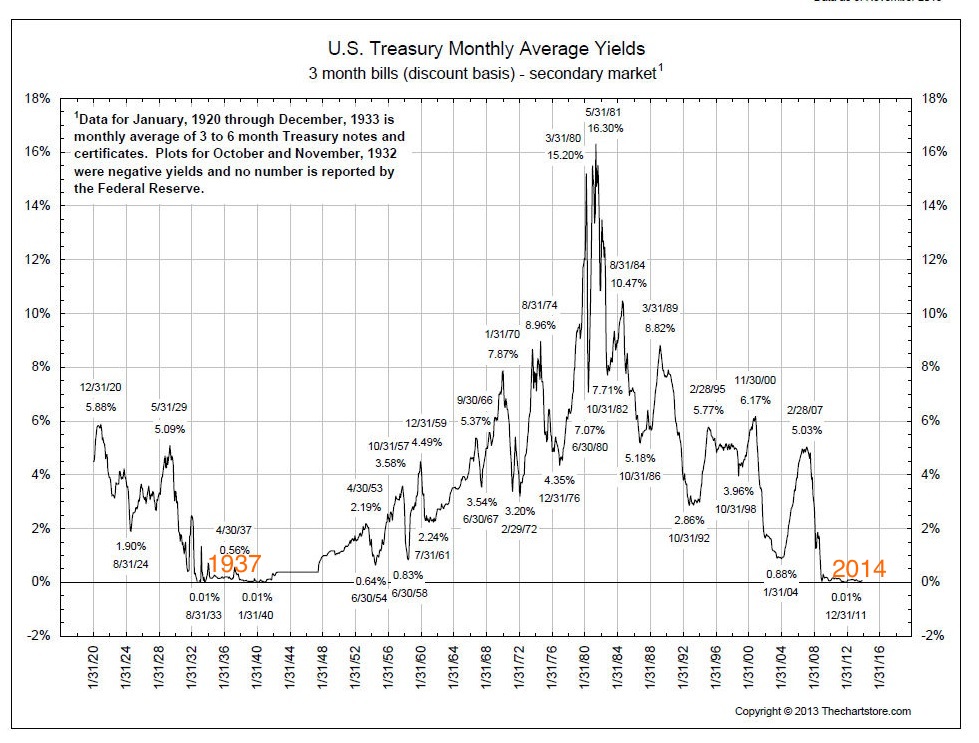
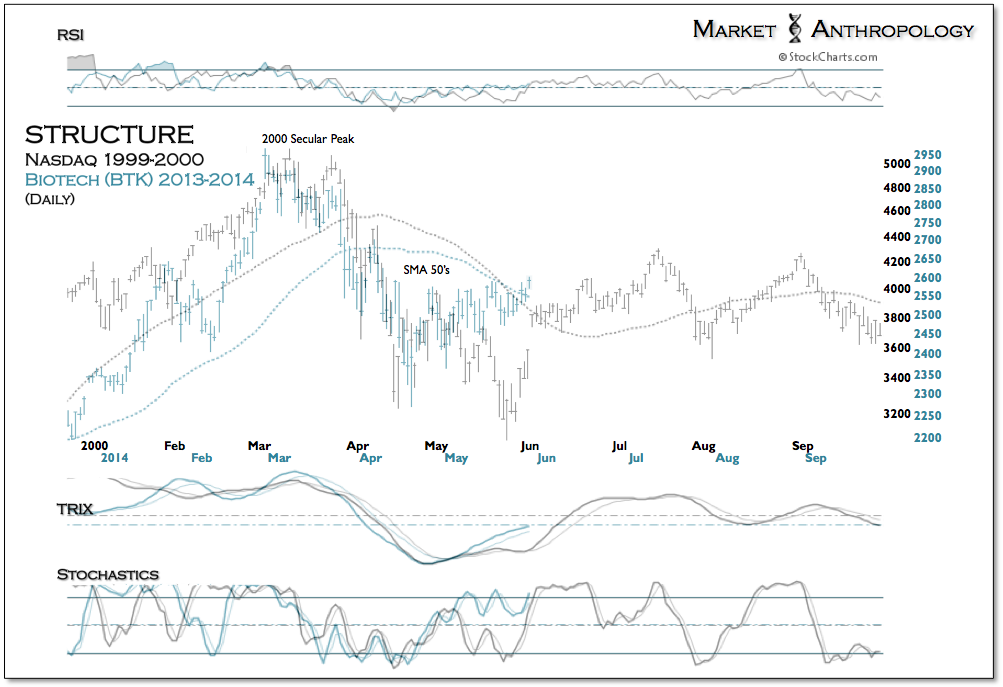
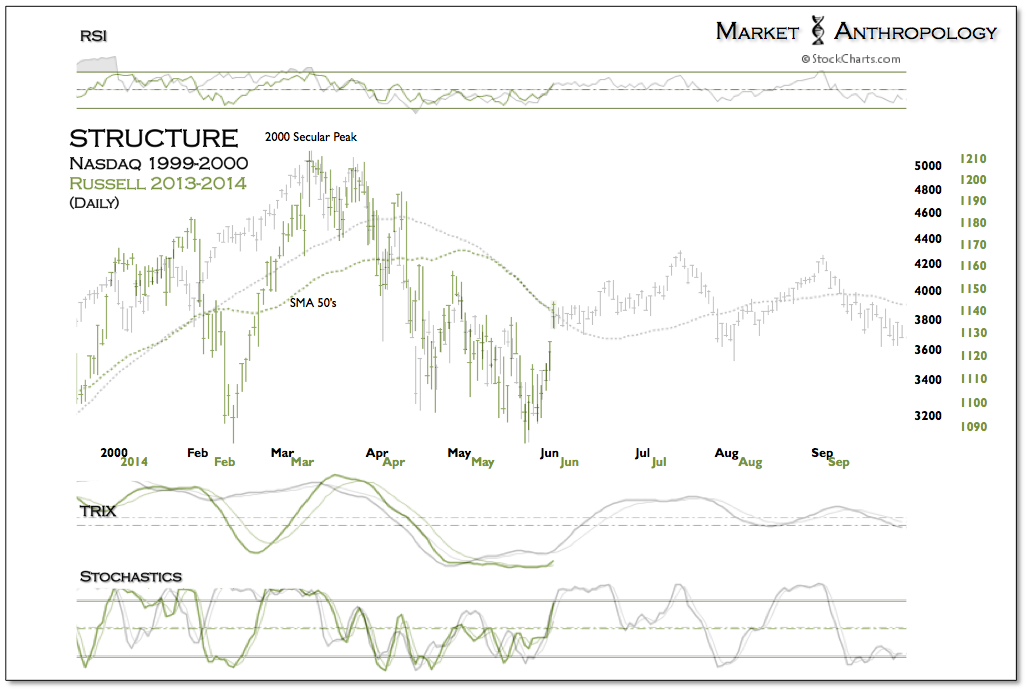
Between 1932 and 1937 a cyclical bull market erupted with distinct similarities to today (see post here). There was one solar cycle between the 1929 and 1937 peaks, and one between 2000 and 2014 (shown above). The 32-37 bull topped out along with the solar maximum in Spring 1937 with no divergence in cumulative advance-declines, which I believe will mirror today: an all-in peak at extremes in valuation, sentiment, leverage and complacency.
 Source: DecisionPoint
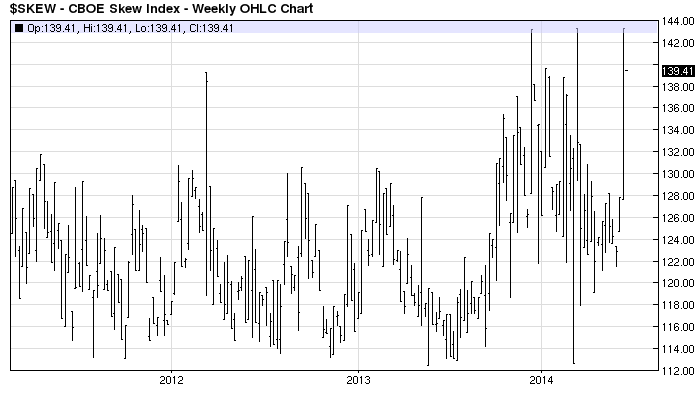
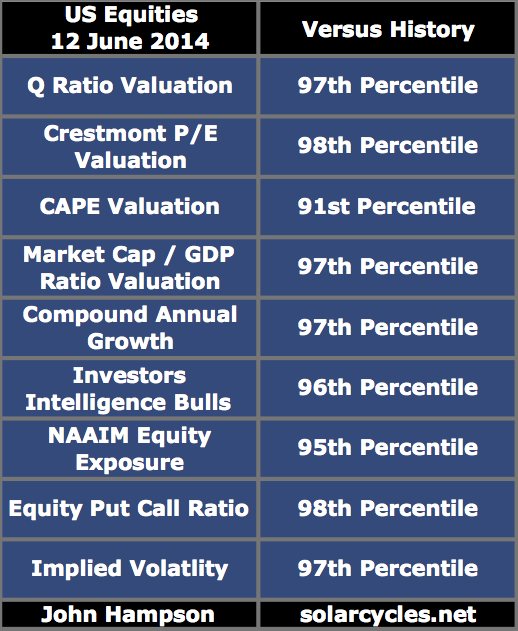
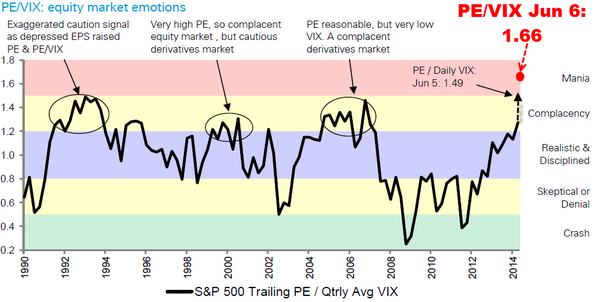
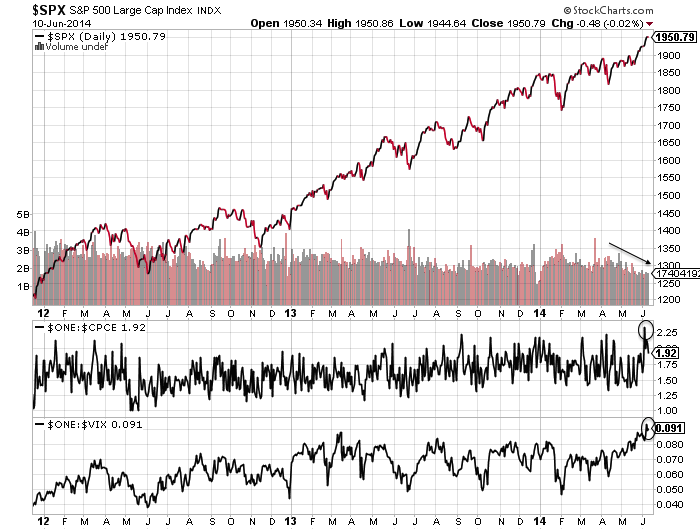
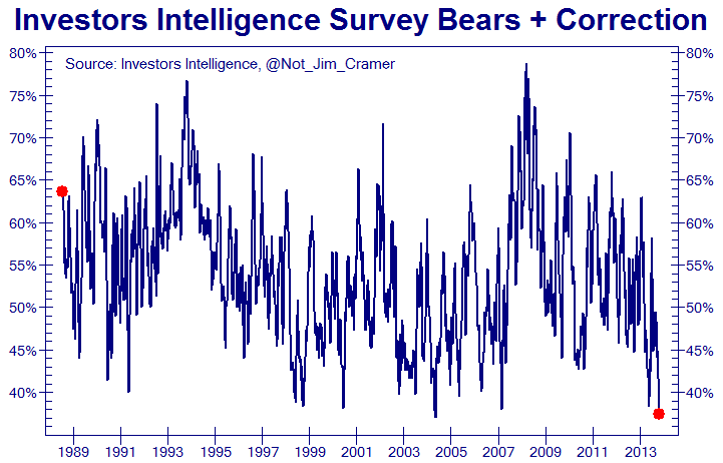
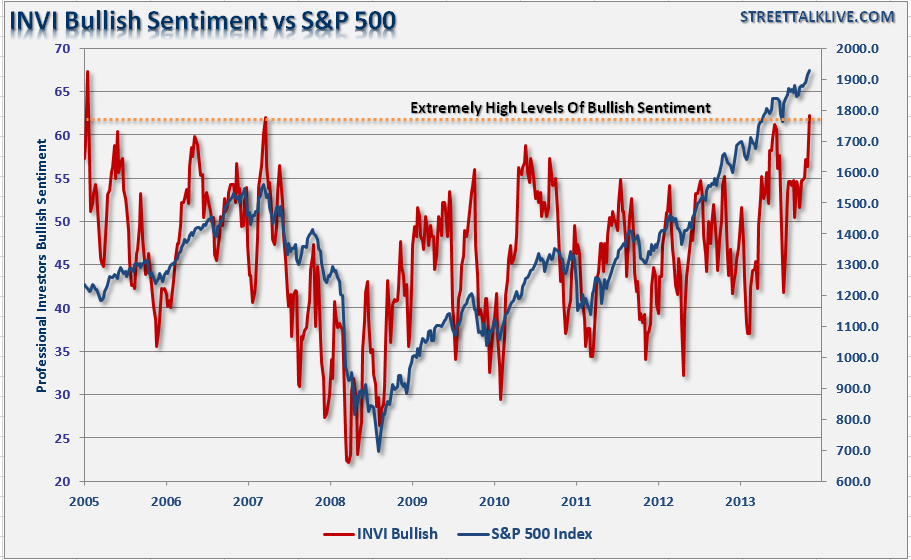
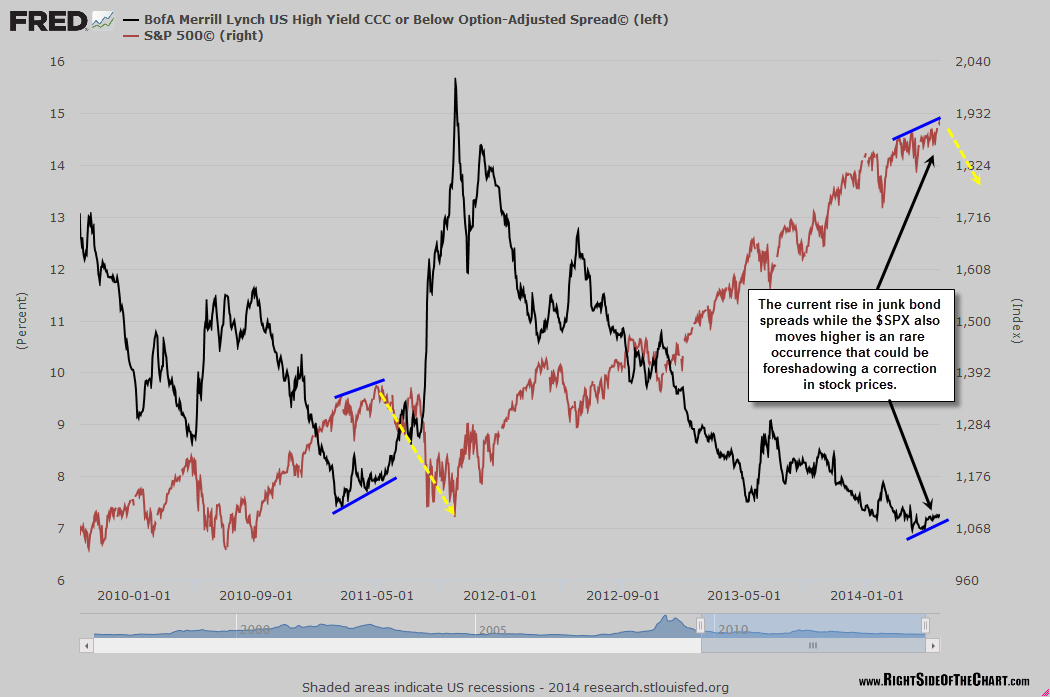
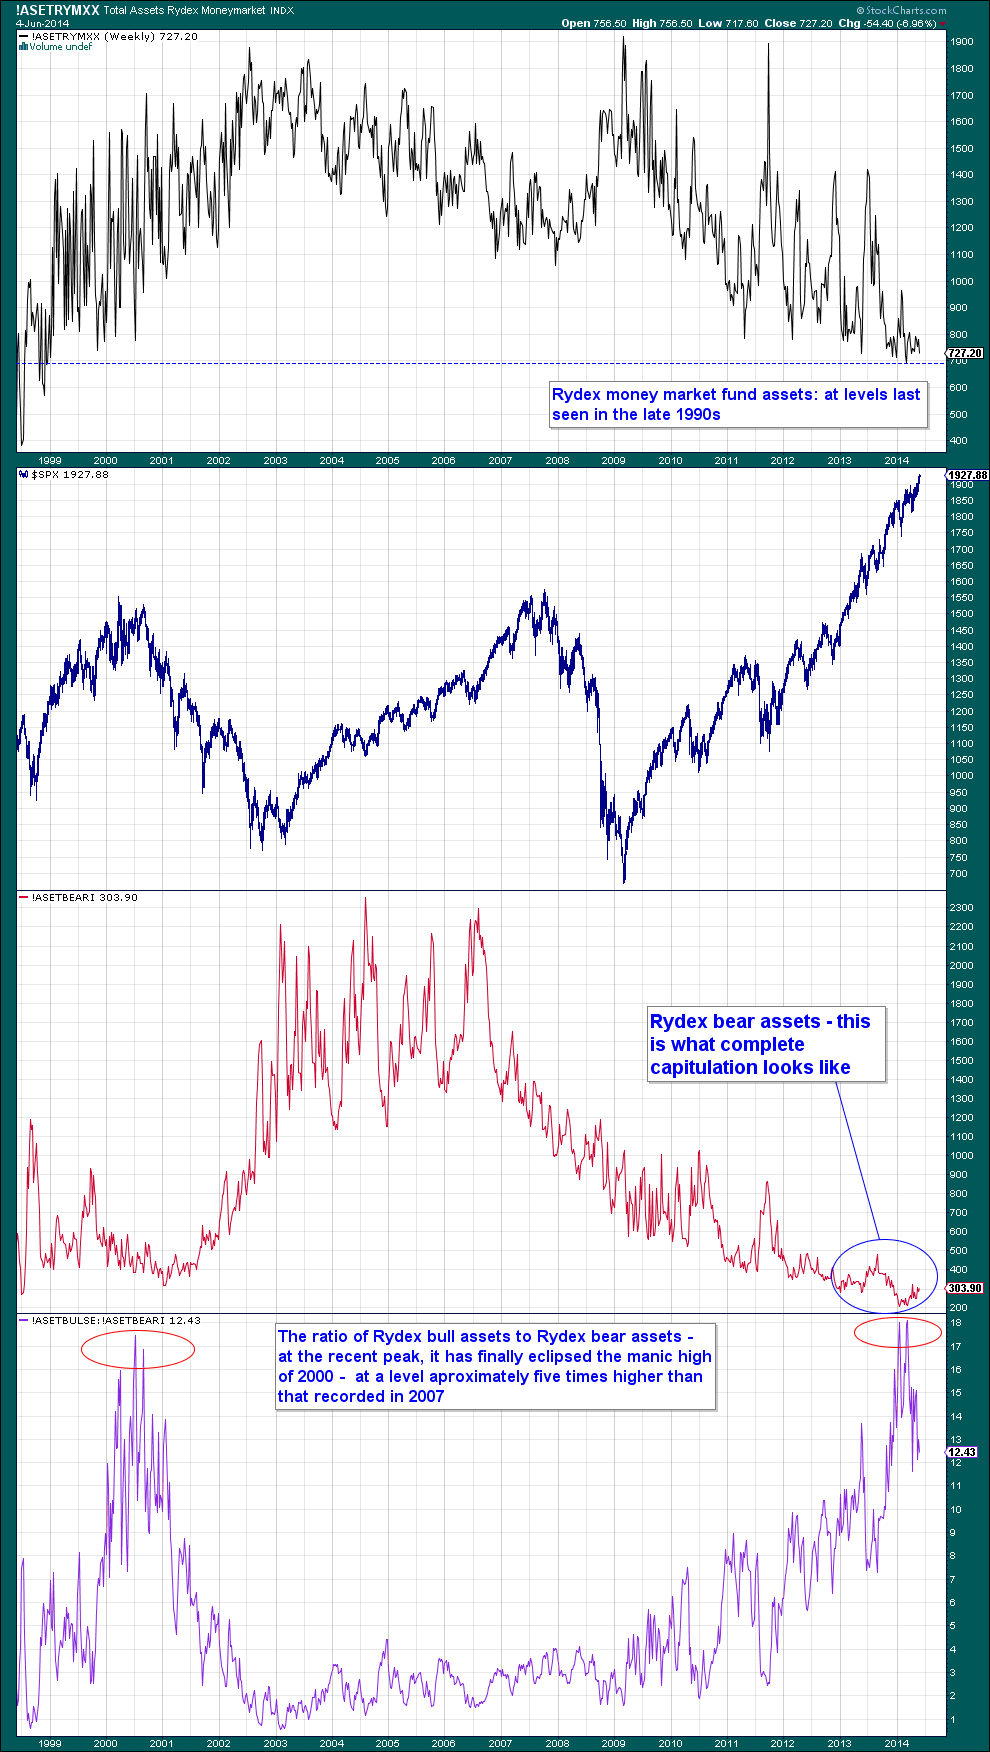
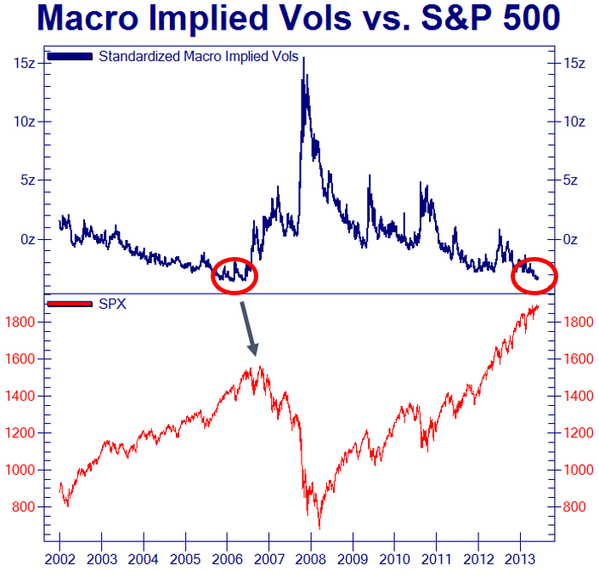
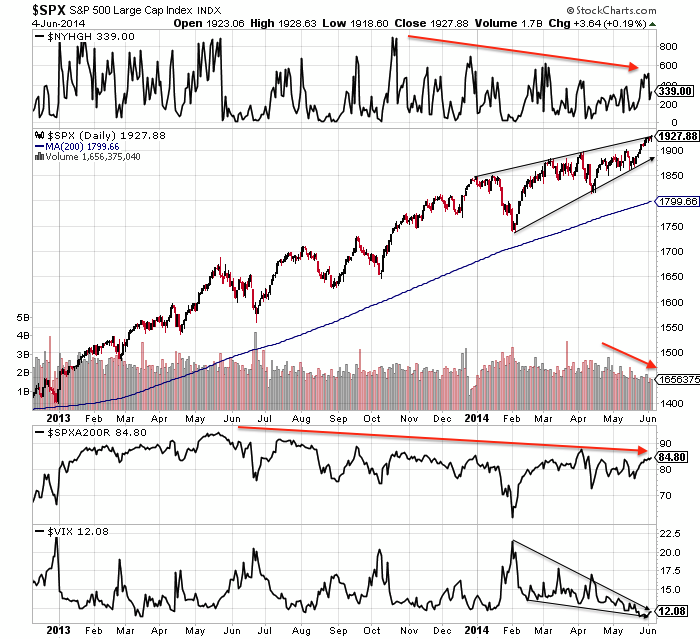
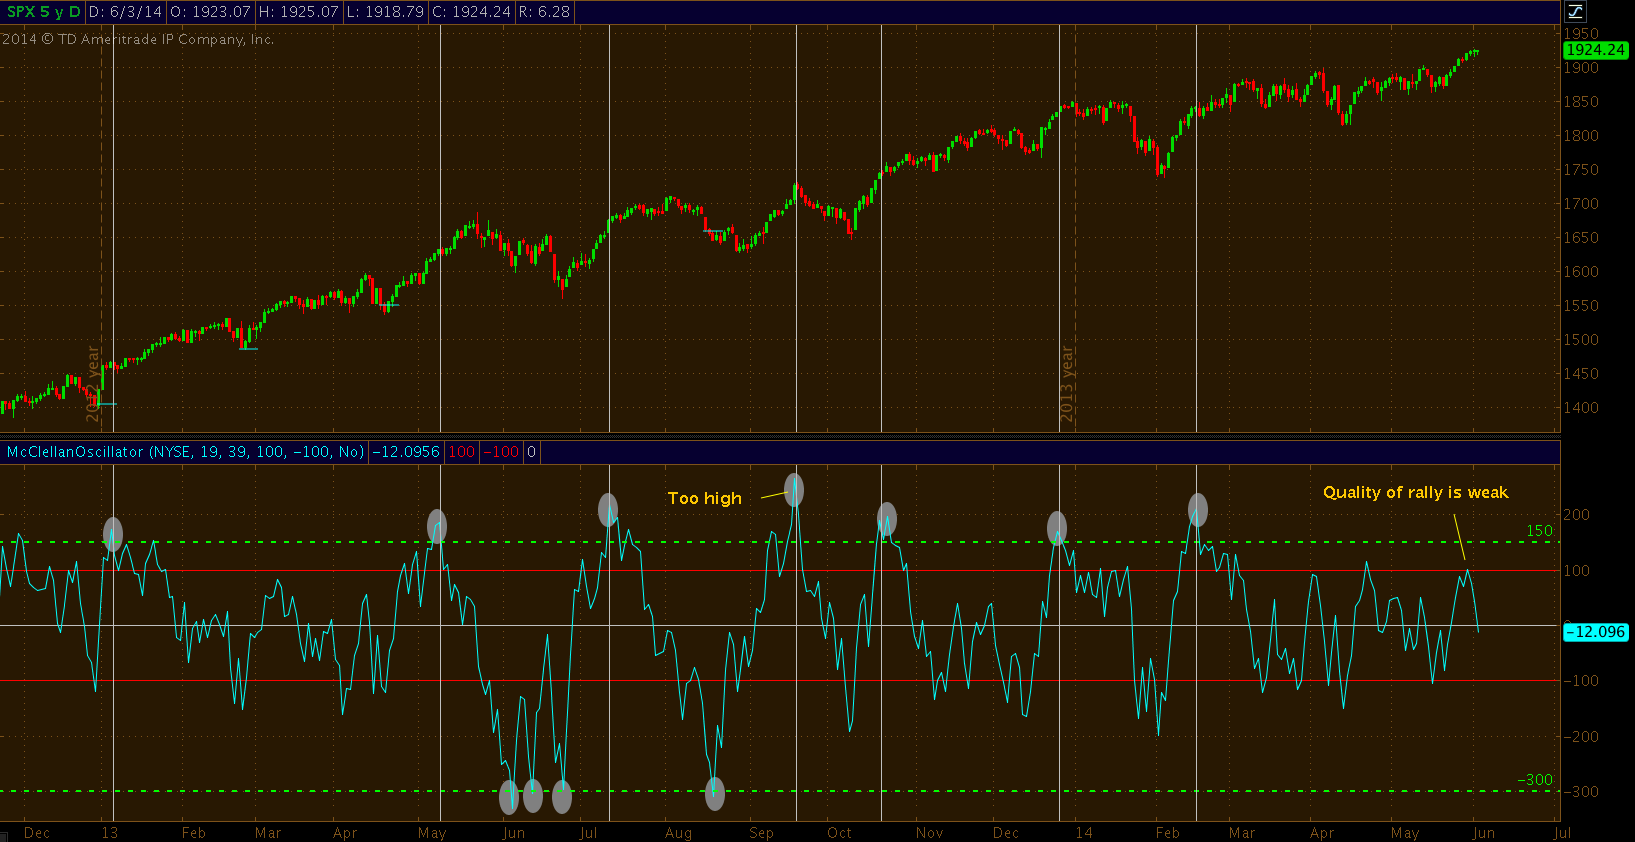
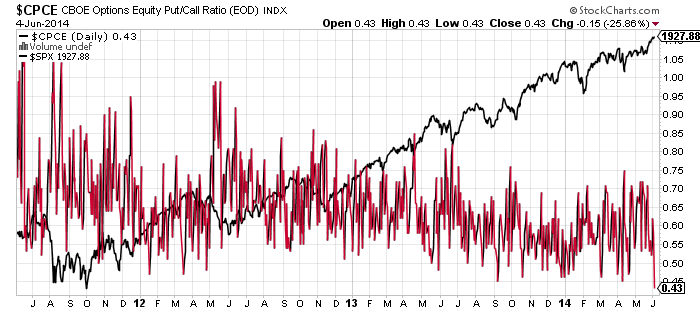
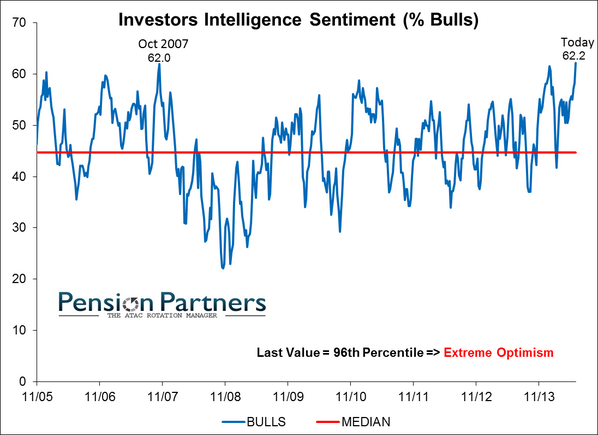
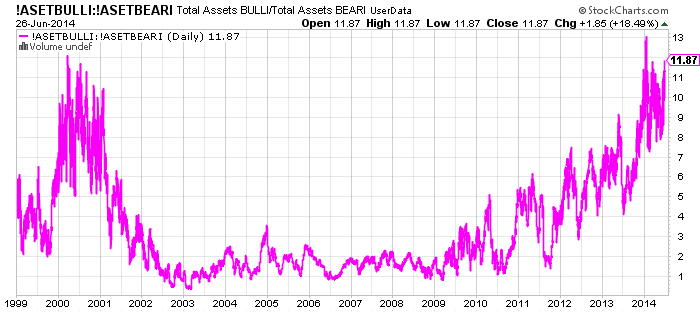
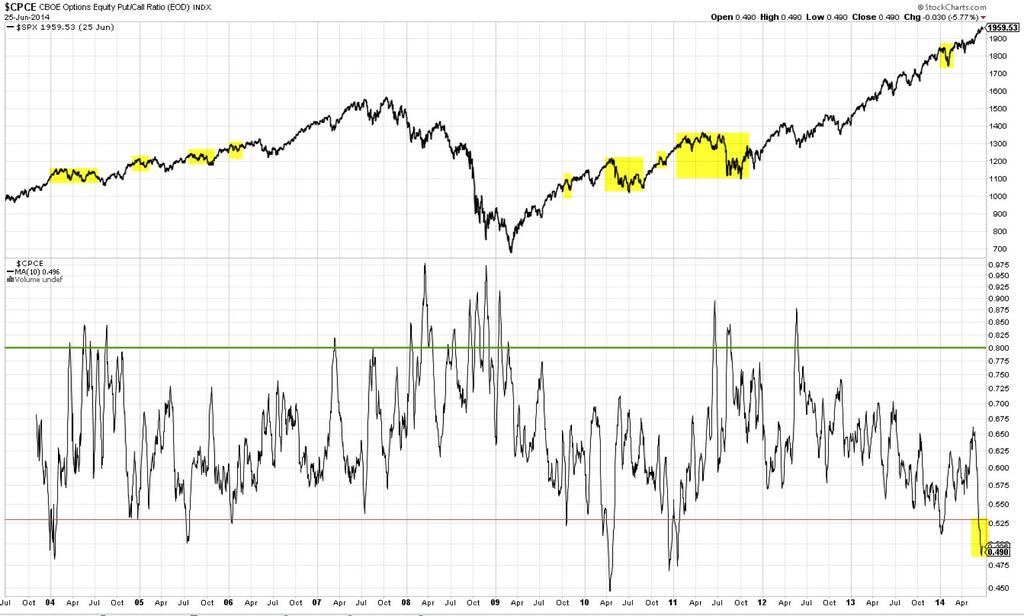
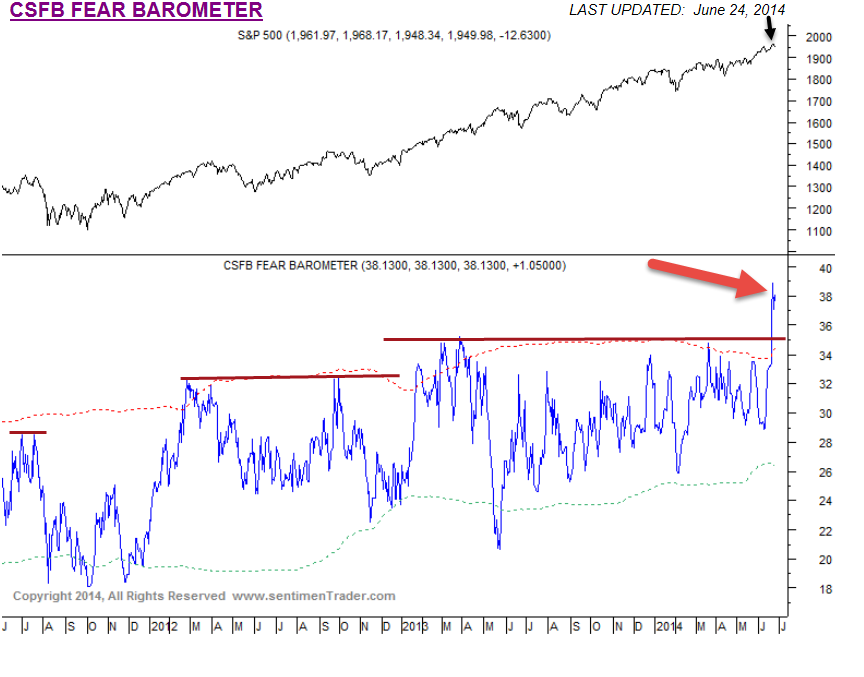
Here is evidence that we have reached such extremes:
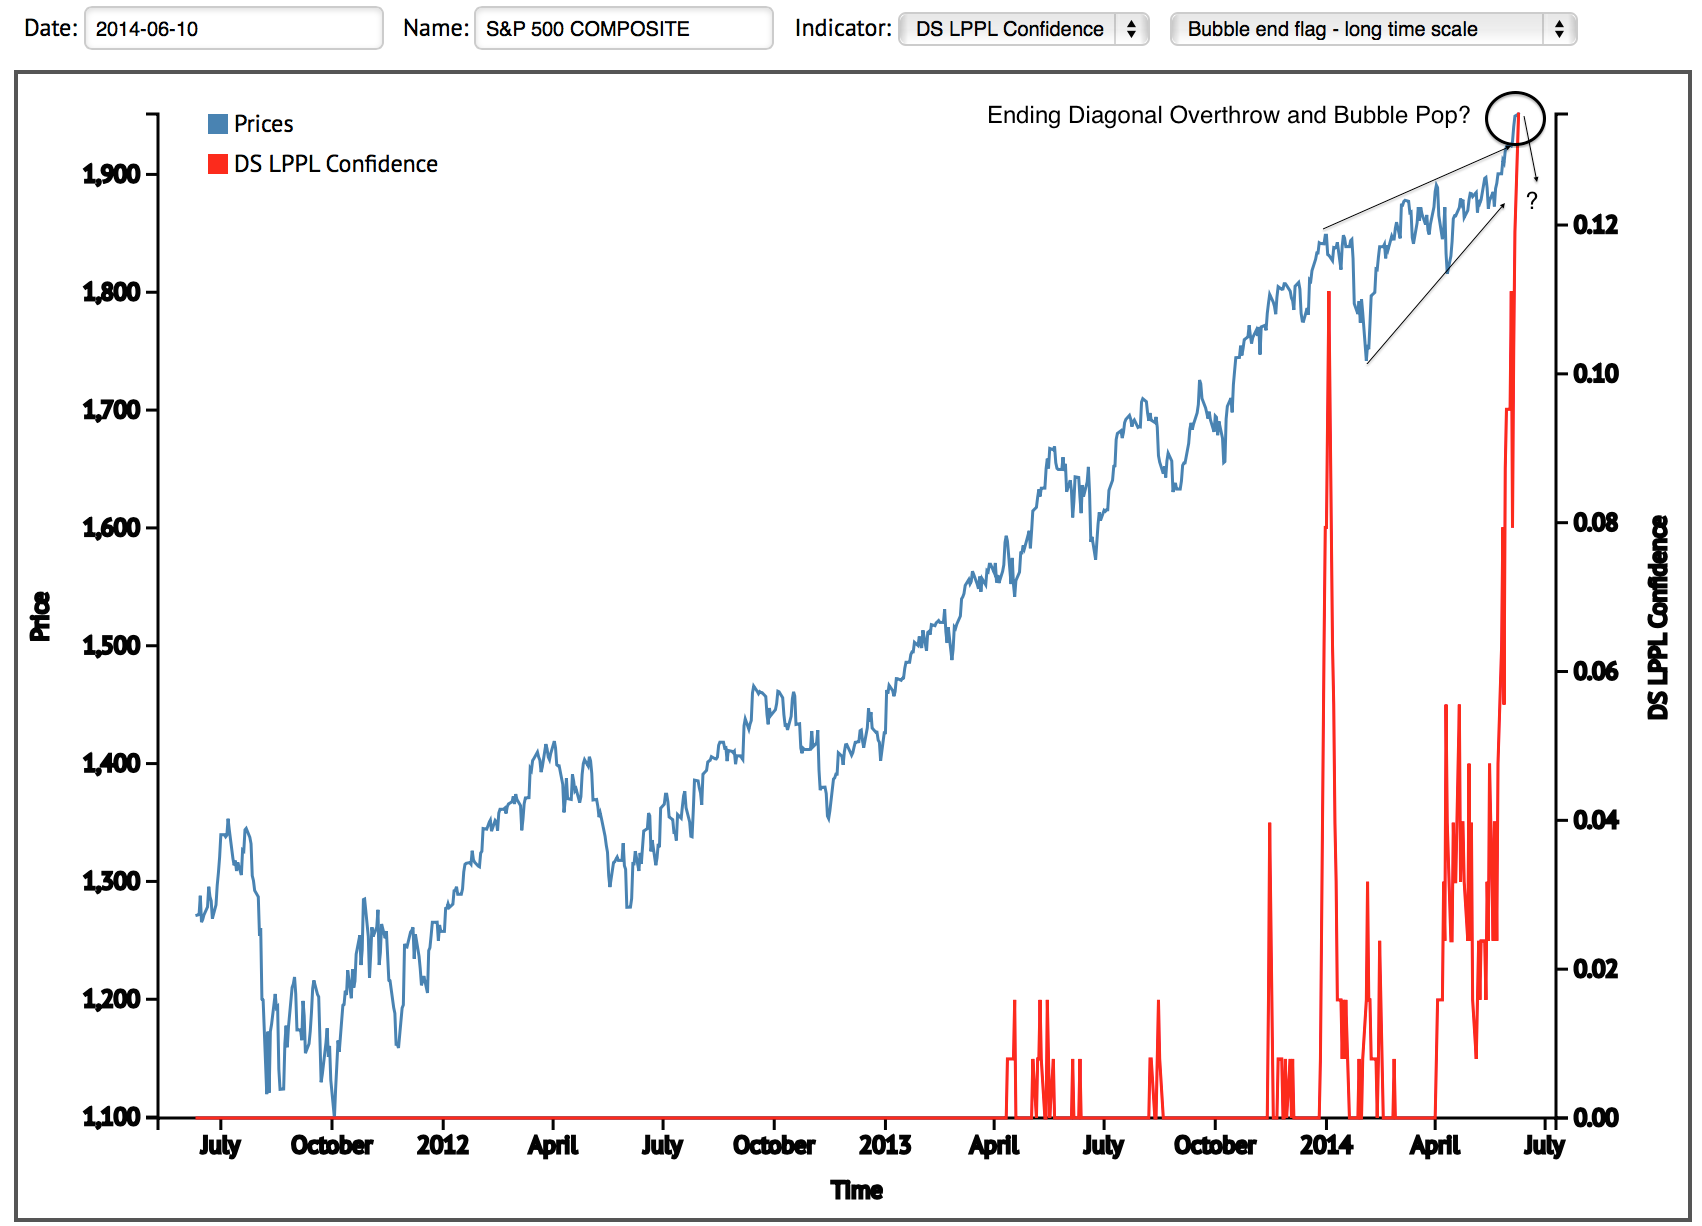
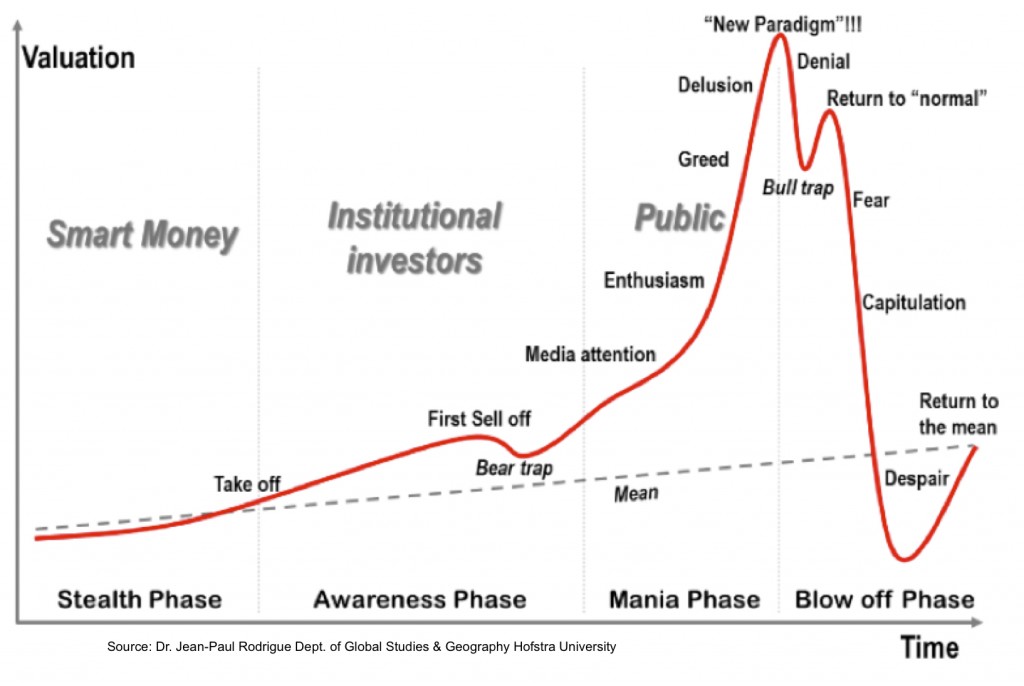
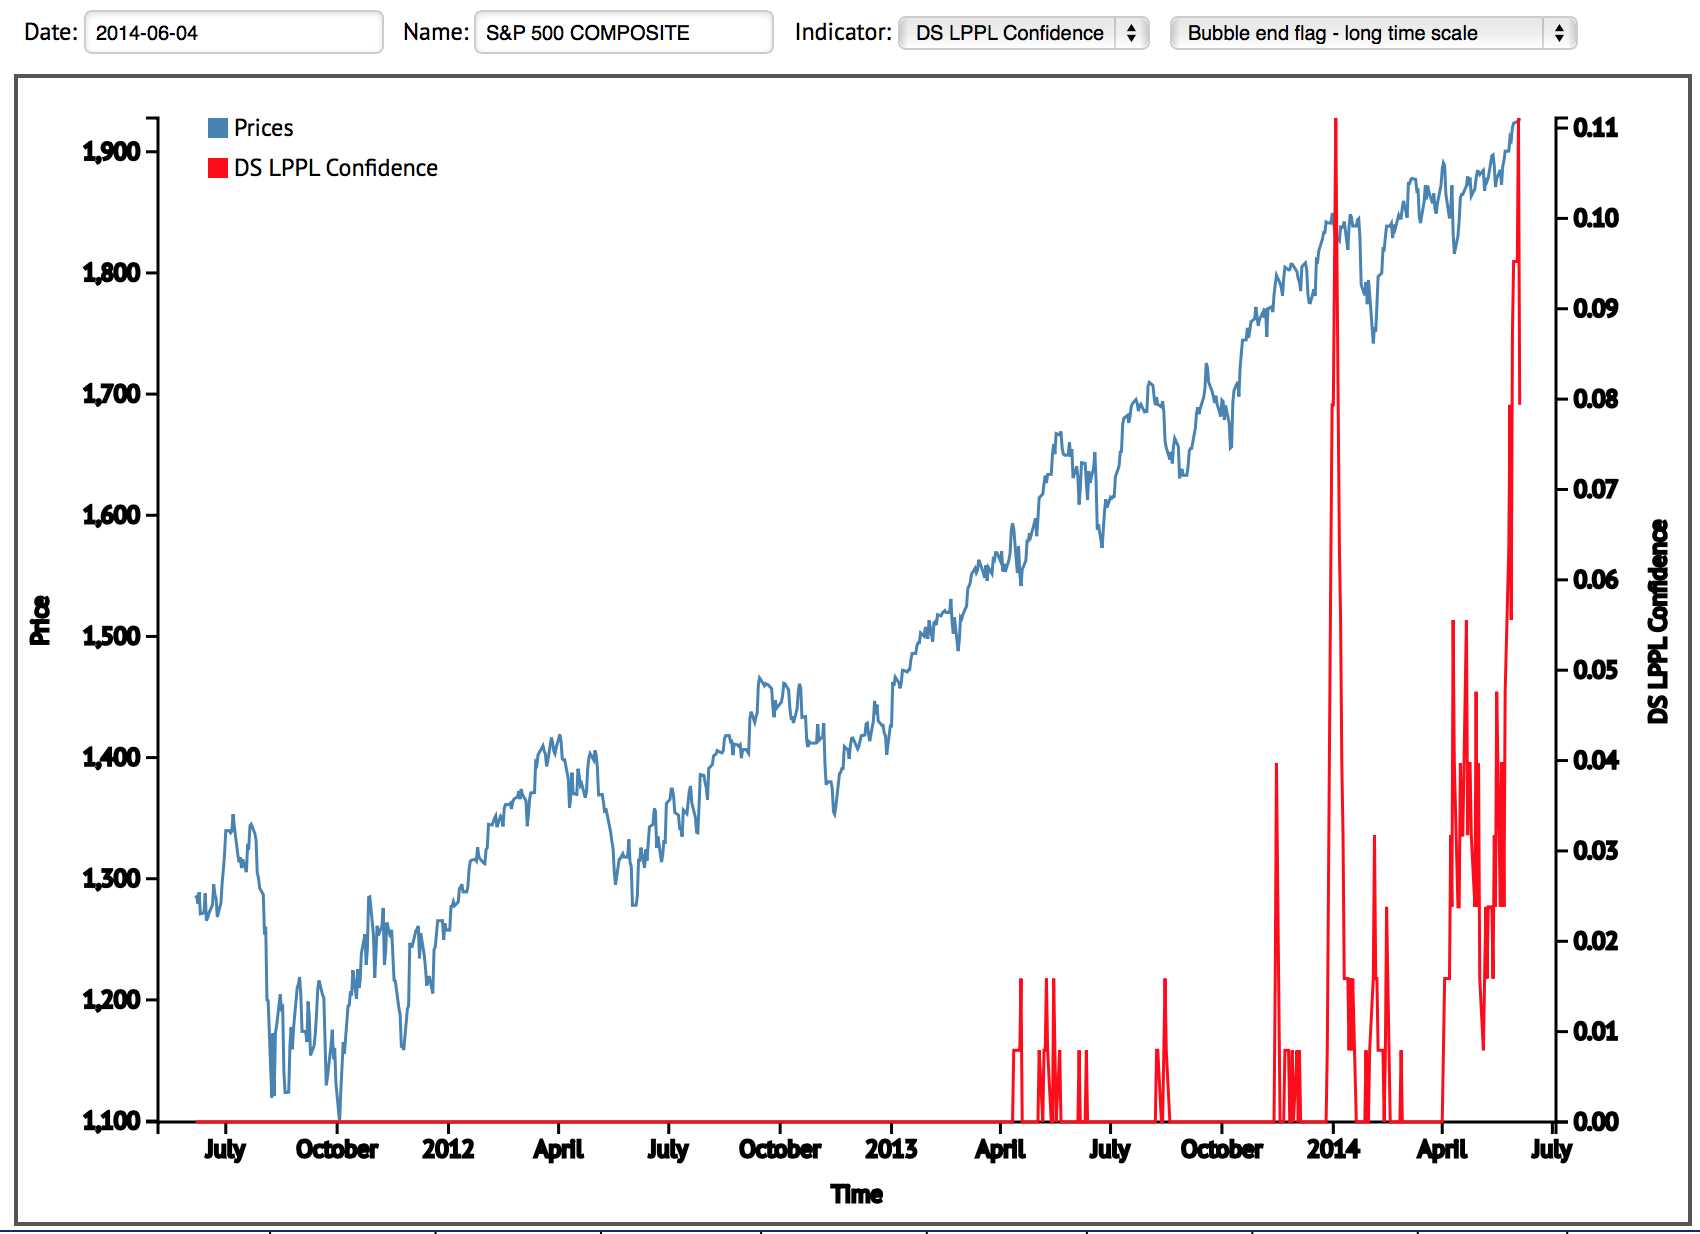
And the bubble-end flag is raised:
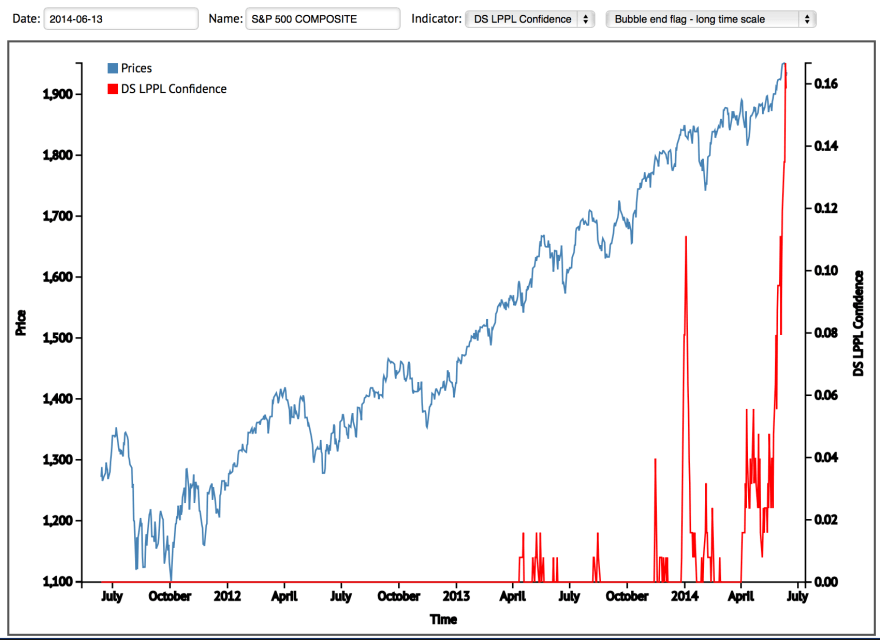 Source: Financial Crisis Observatory
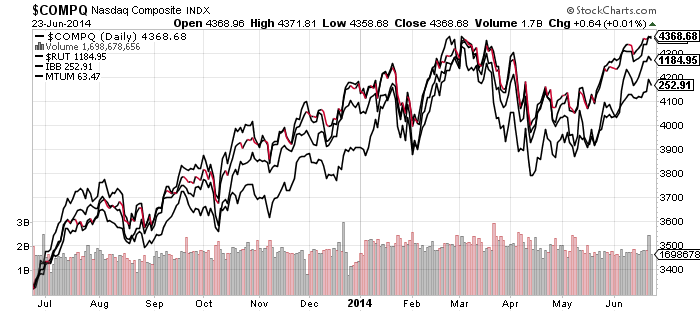
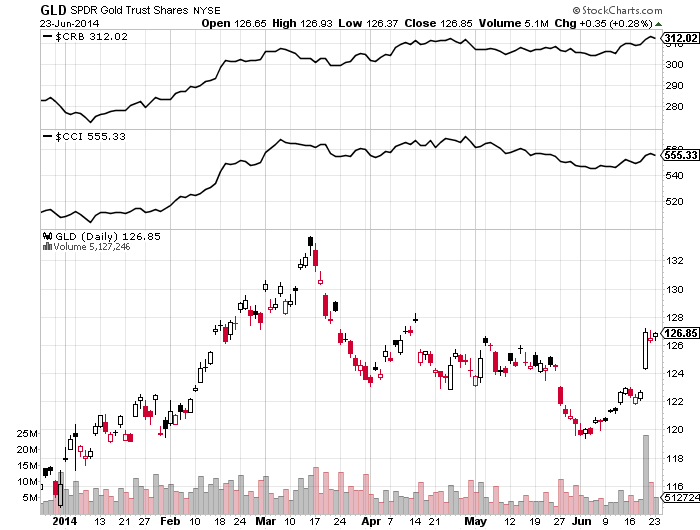
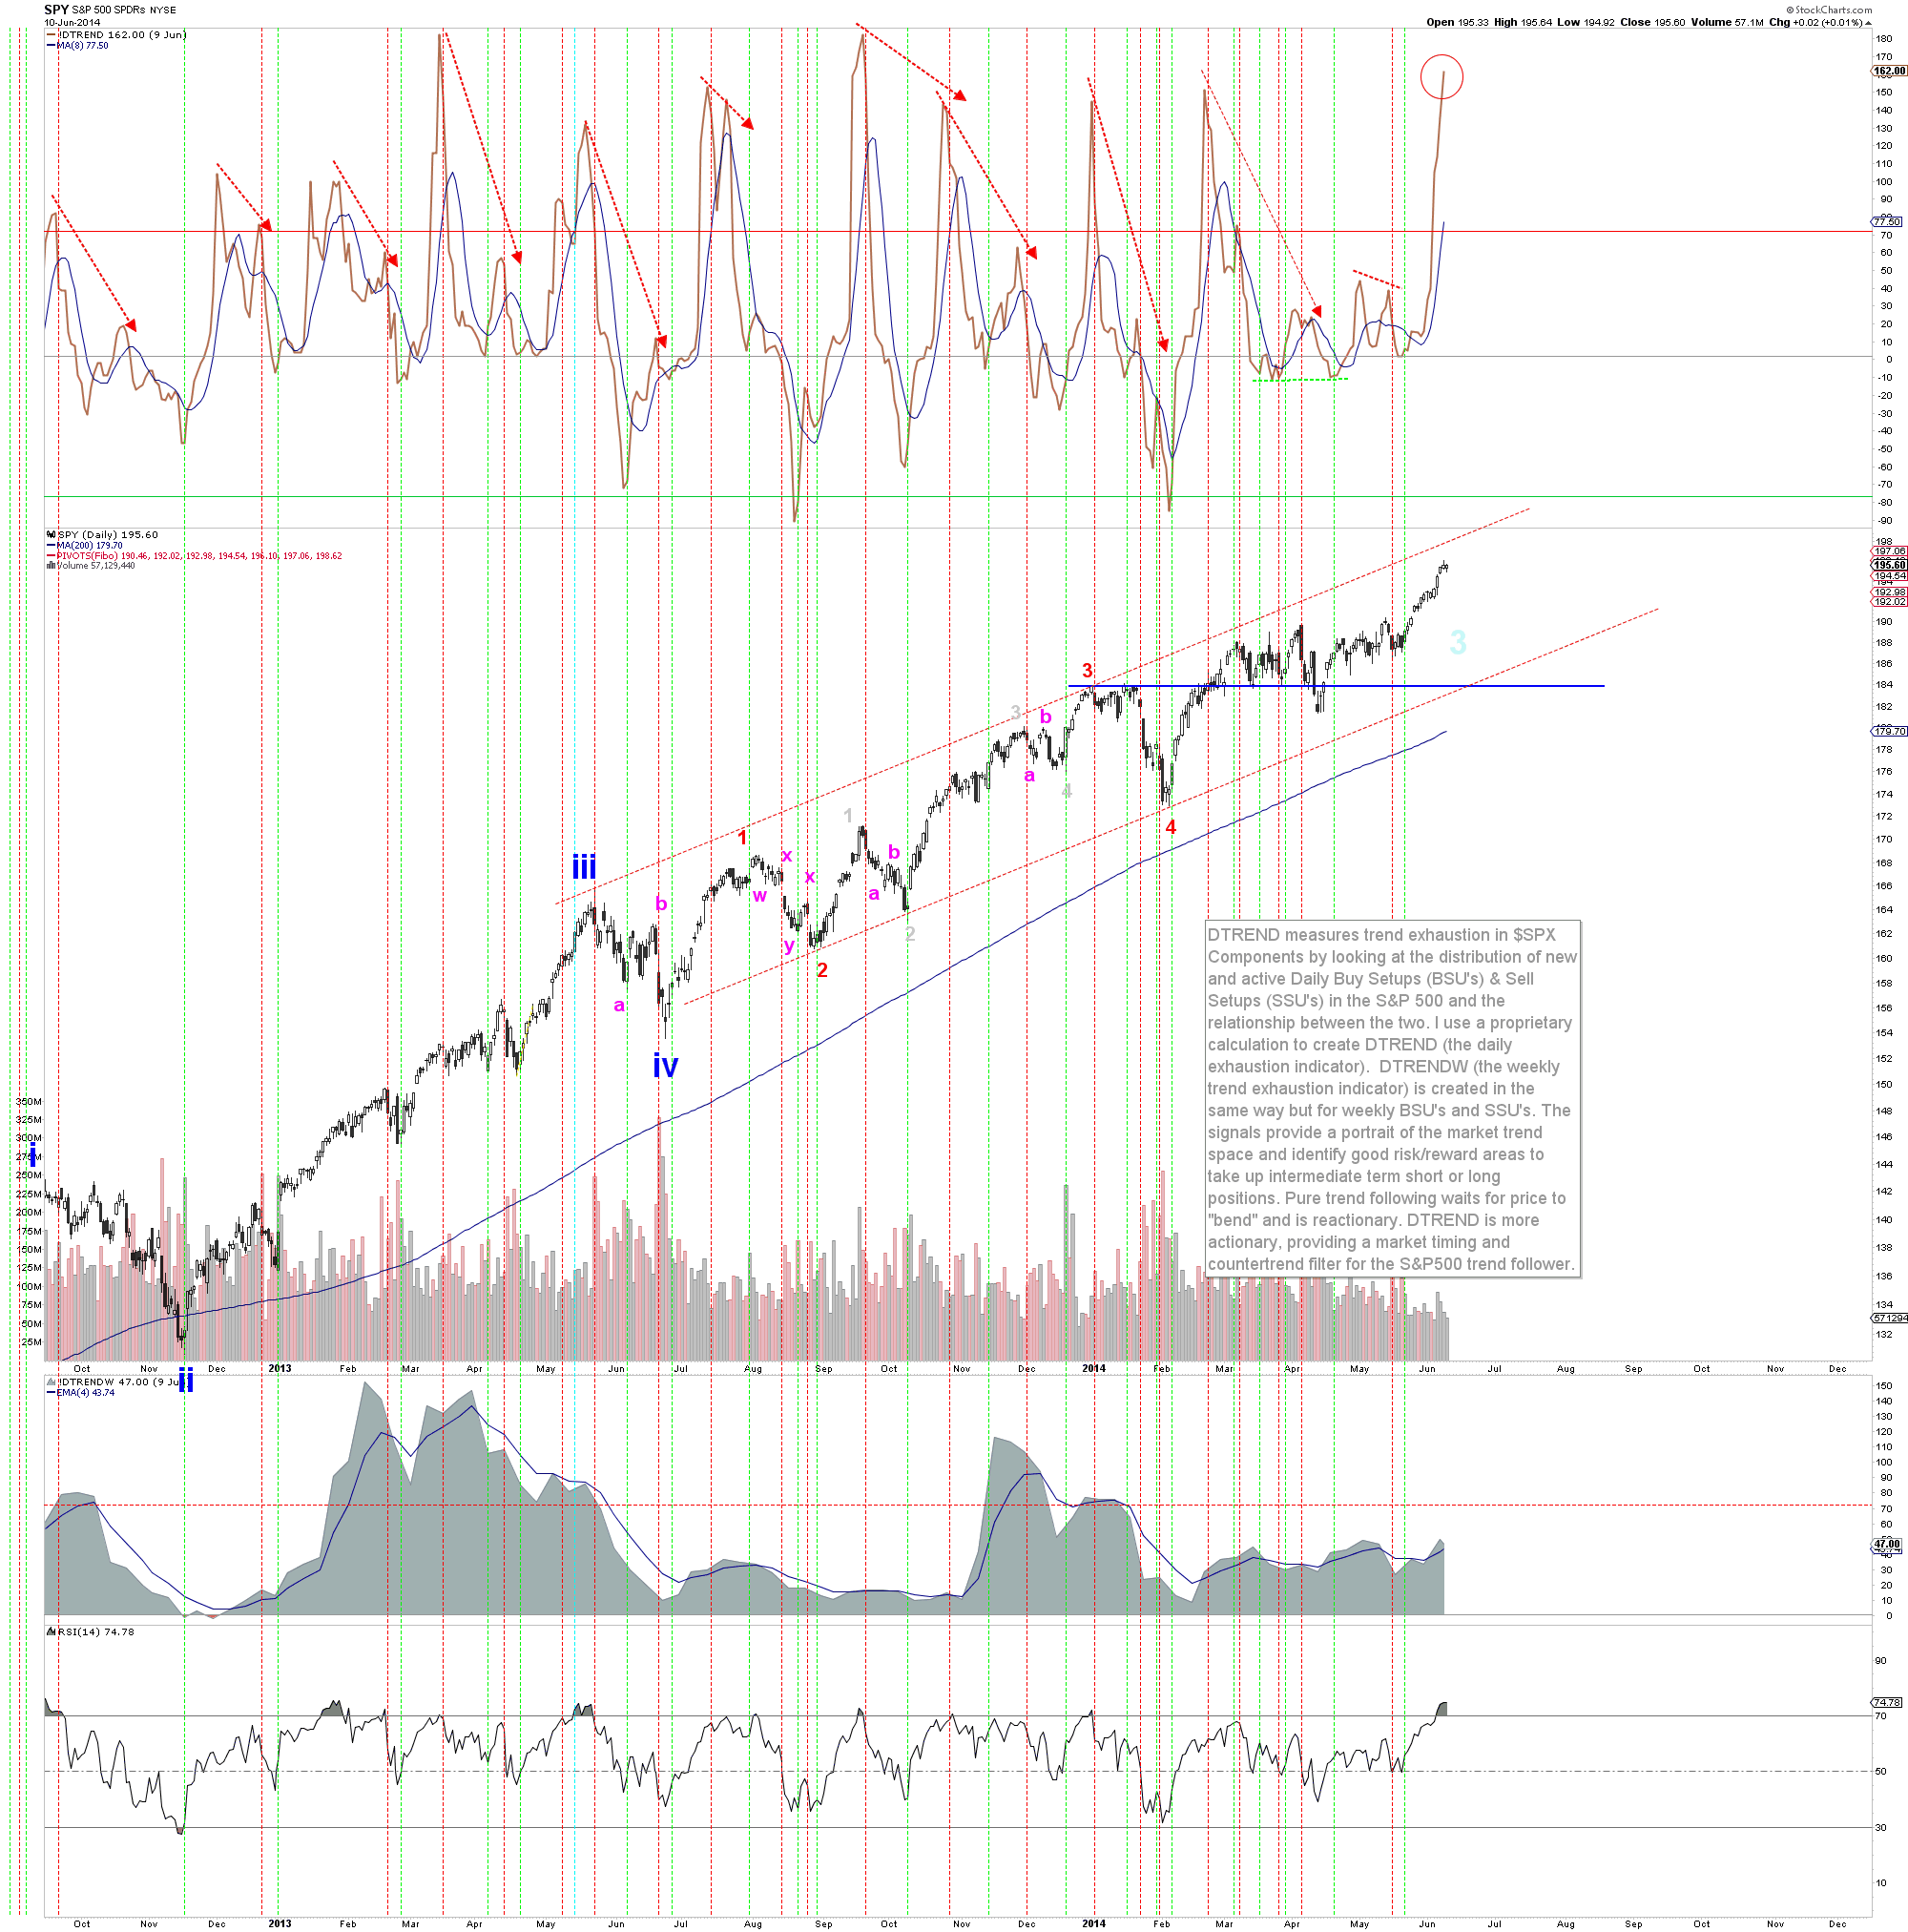
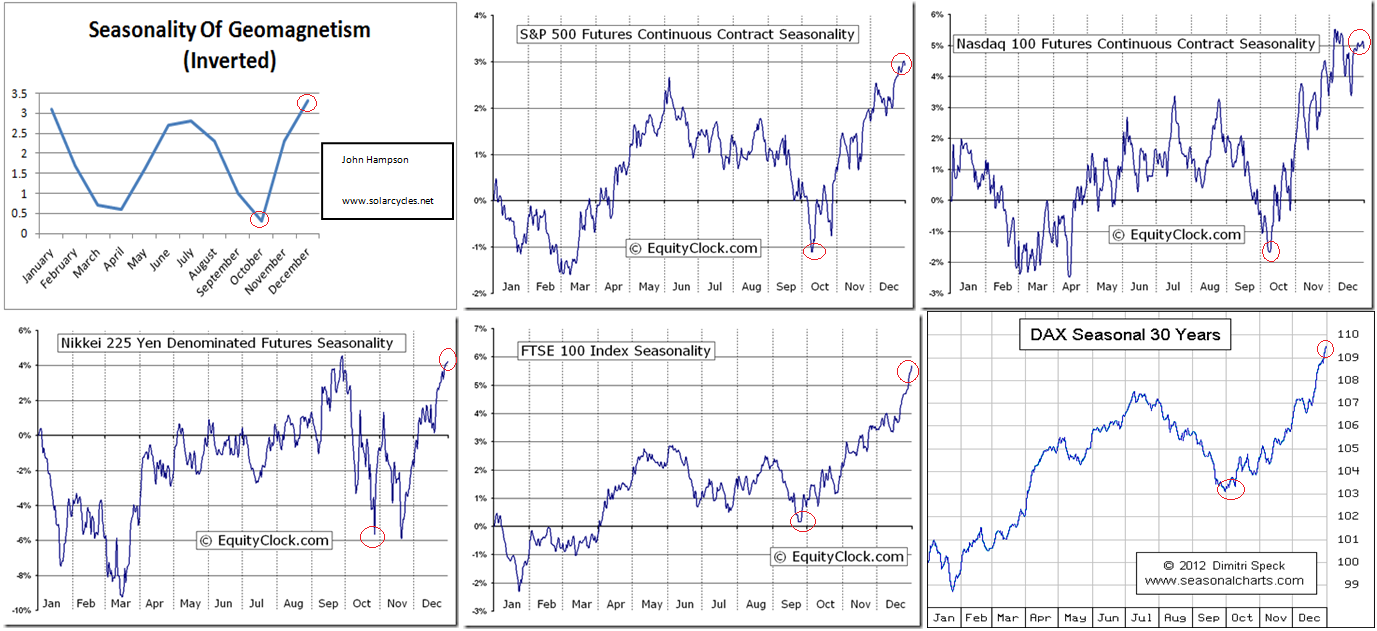
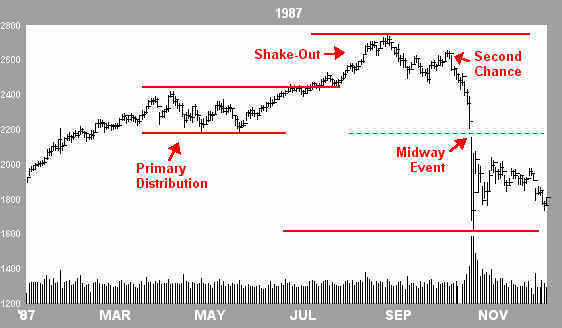
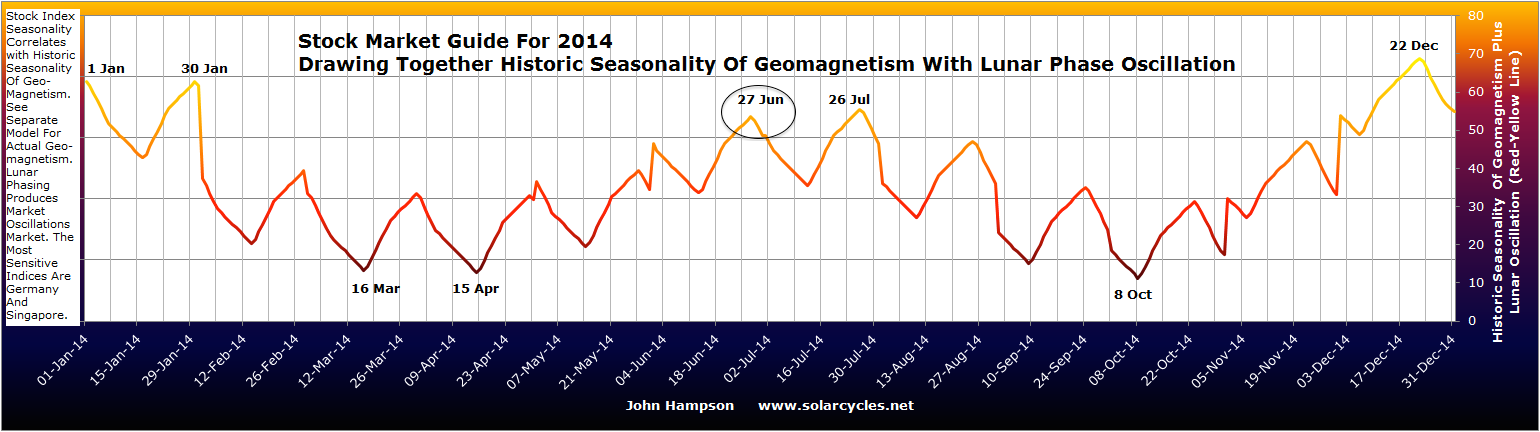
And this fits with solar cycle maximum peak-speculation timing.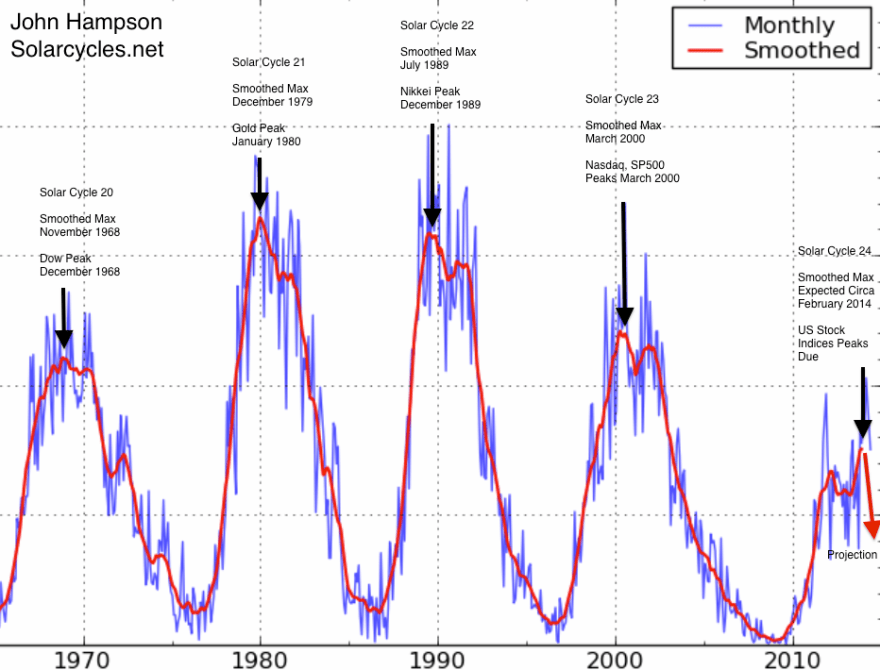 Friday’s session provided a bounce at the full moon. The bounce came at an important level in the large cap indices: a backtest of the ending diagonal or wedge. As full moons often mark inversions, that gives two reasons for stocks to rally again from here. However, by various indicators further declines appear more likely, and such a development would then fulfil the ending diagonal overthrow pattern, whilst ensuring lower highs are maintained in the small caps. That would then enhance the likelihood of all the indices having peaked and the smoothed solar maximum having passed. Emerging new up legs in gold, miners and silver are another clue that could be occurring, whilst geopolitical developments in oil could be a catalyst to end the complacency.
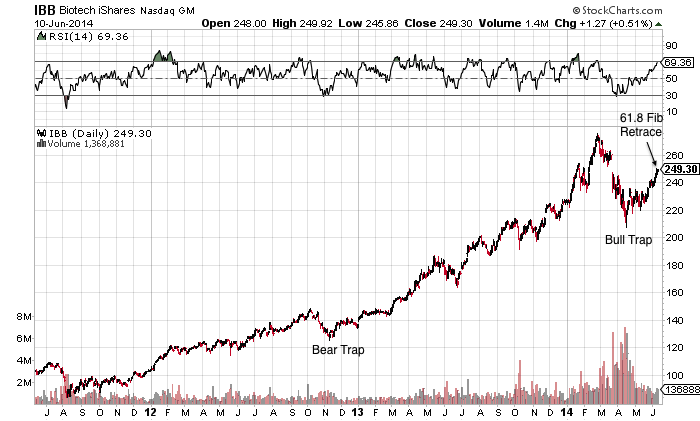
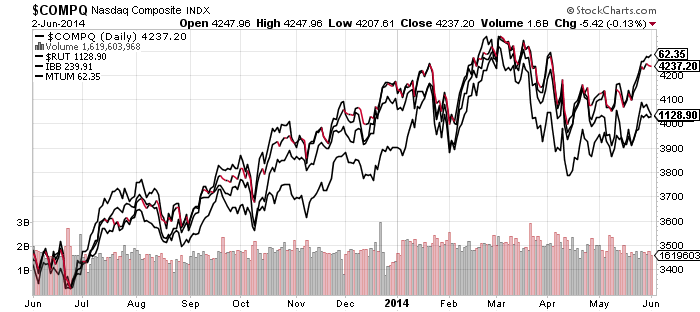
The best cross-referenced case I have currently is that the smoothed solar maximum, RUT, COMPQ, IBB and margin debt all peaked out around February/March. The majority of solar forecasts support this, and we have seen various asset peaks between December and June around this centre. The Sornette bubble-end is flagging again here as sentiment, valuations and complacency are all at the level of extreme that would fit a reversal, plus certain divergences are mature. The selling on Wednesday and Thursday did little to reset the short term indicators that would suggest stocks rally again now.
However, the risk remains that the solar maximum could potentially get stronger yet. Solar scientists have not so far done great in their predictions for this cycle. They are generally united in projecting a waning sun for the rest of this year, but SIDC still continue to run with an alternative model which would delay the smoothed maximum until the end of 2014.
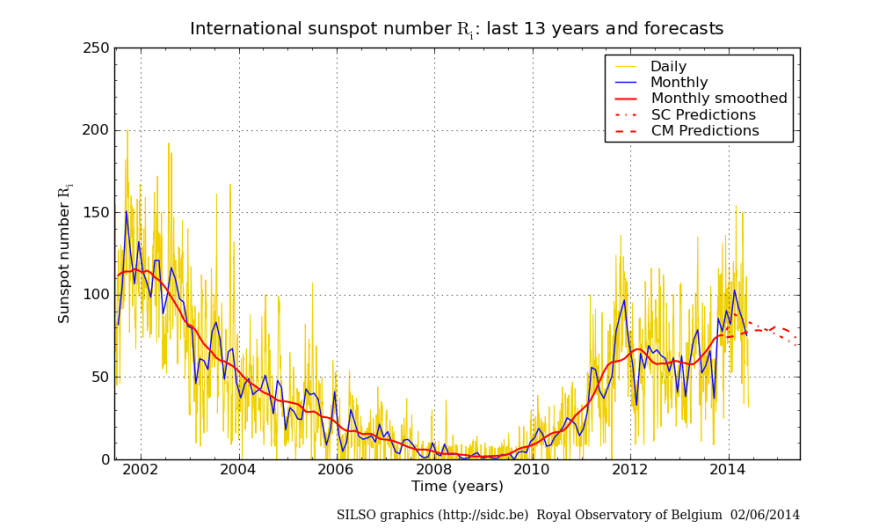
Source: SIDC
Right now sunspots are high again as the sun has leapt back to busy in June after three months of waning, so I continue to monitor. Cross-referencing again, if the smoothed solar maximum were still ahead, then we ought to see large caps hold their breakout here and continue to advance, the other indices break upwards to new highs (invalidating their Feb/Mar peaks) and margin debt reverse its waning trend.
So, as things stand, the highest probability case is for this to be the end of a topping process that began at the turn of the year, with the solar and speculation peak centred around Feb/Mar. If so, then stocks should fall again this coming week, fulfilling the ending diagonal and bubble-popping, and completing the ‘second chance’ lower peaks in RUT and COMPQ. If instead the large caps hold the break and rally upwards, taking the Nasdaq Composite along to new highs in the process, then it would strengthen the case for the solar maximum and peak speculation to be shifted along to at least June, but potentially to even further out in the year. An important week.

 Whilst the Sornette bubble continues to flag as ripe to pop.
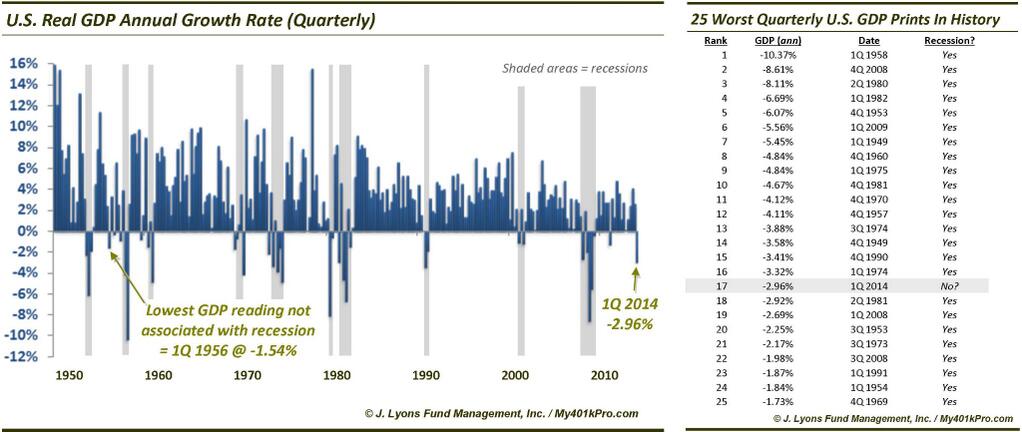
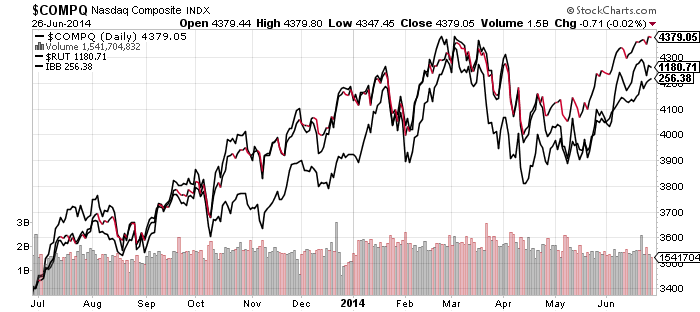 And we had a major bad economic data item this week in Q1 GDP: