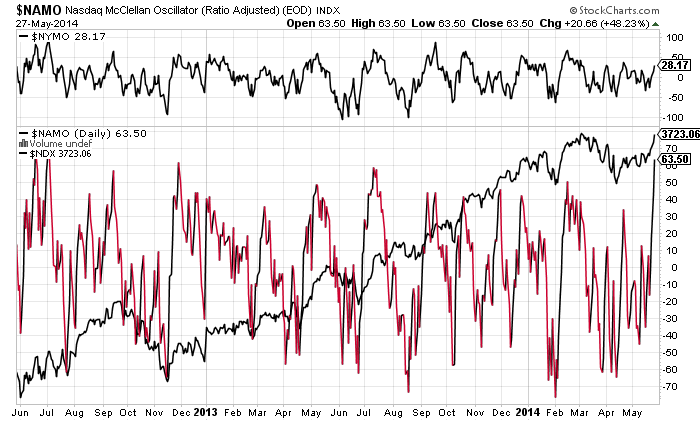
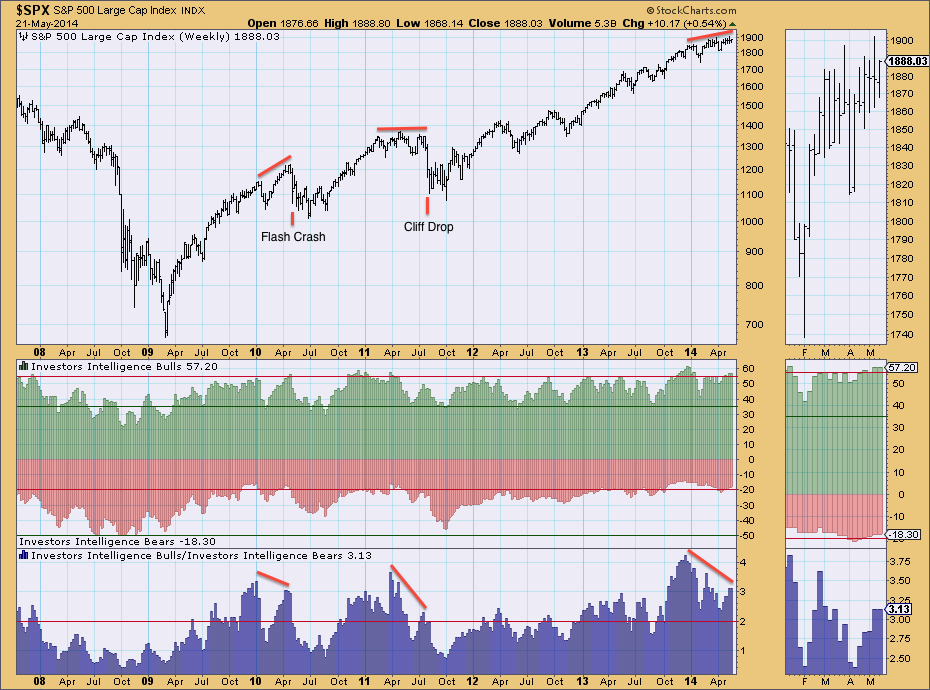
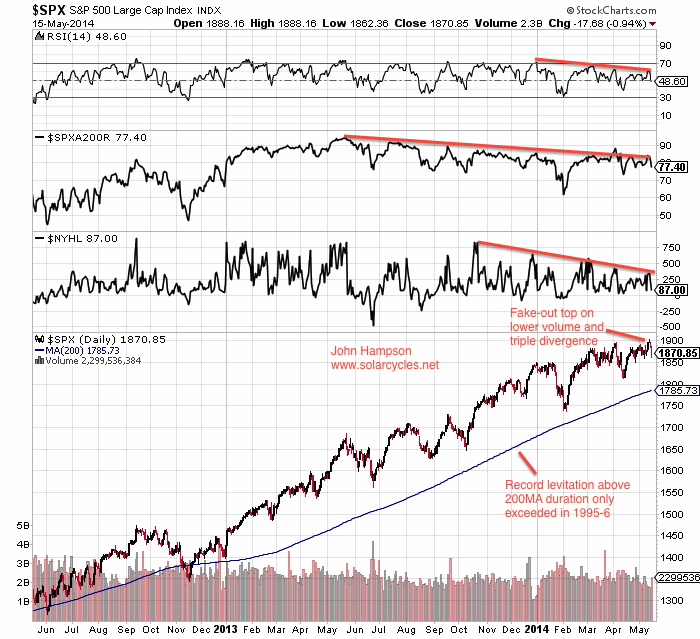
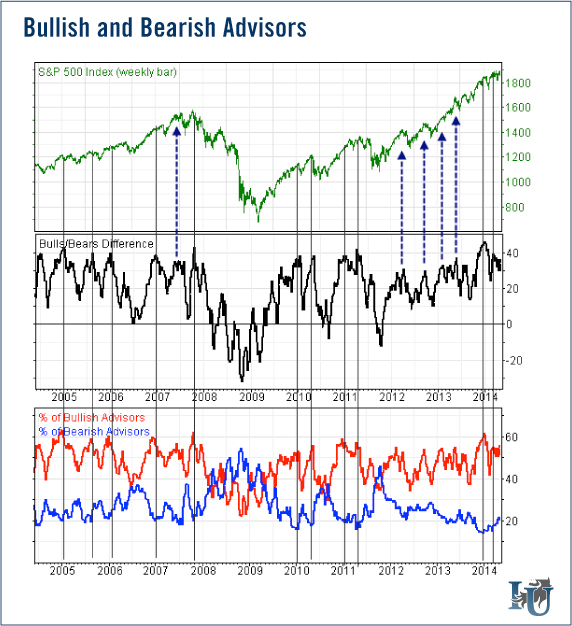
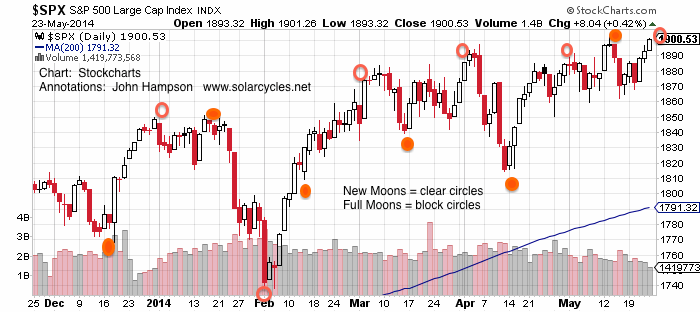
The SP500 is trying to break out again, but once again chances of success are slim. Volume ultra low, new high breadth weakest yet, complacency high:
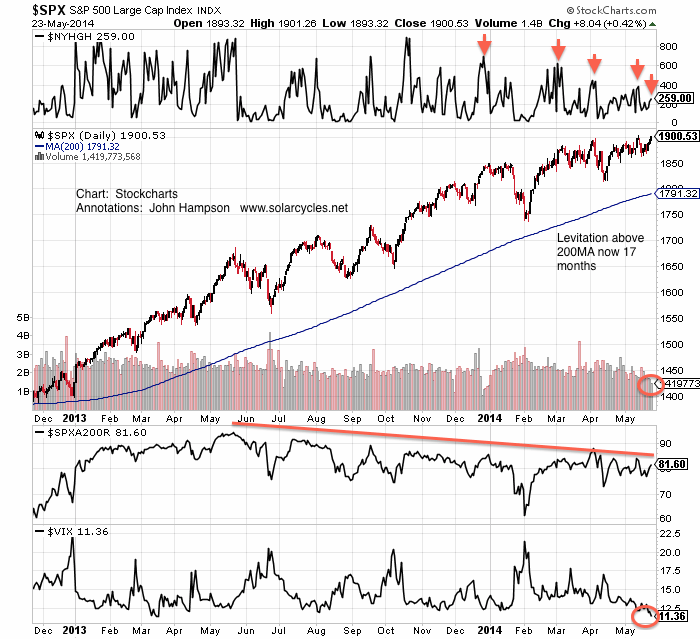 I rather see prices continue to gradually arch over, captured below:

Source: Rory Handyside
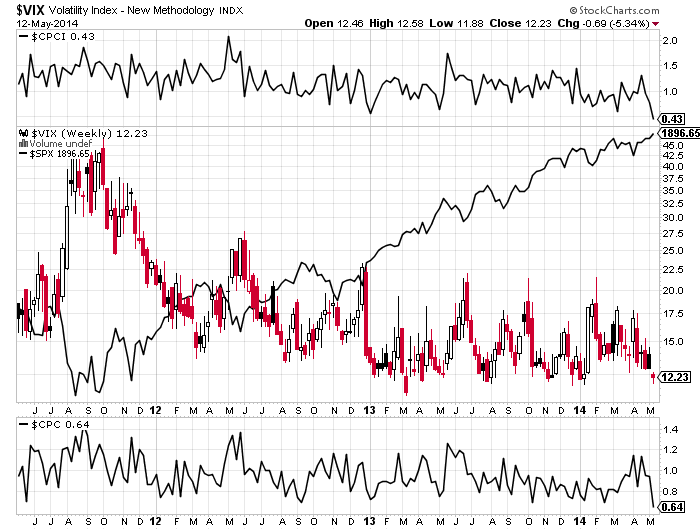
The historically low put-call ratio range continues, whilst the ratio divergence above is warning of falls ahead, similar to the smart money flow divergence:

Source: Todd Harrison
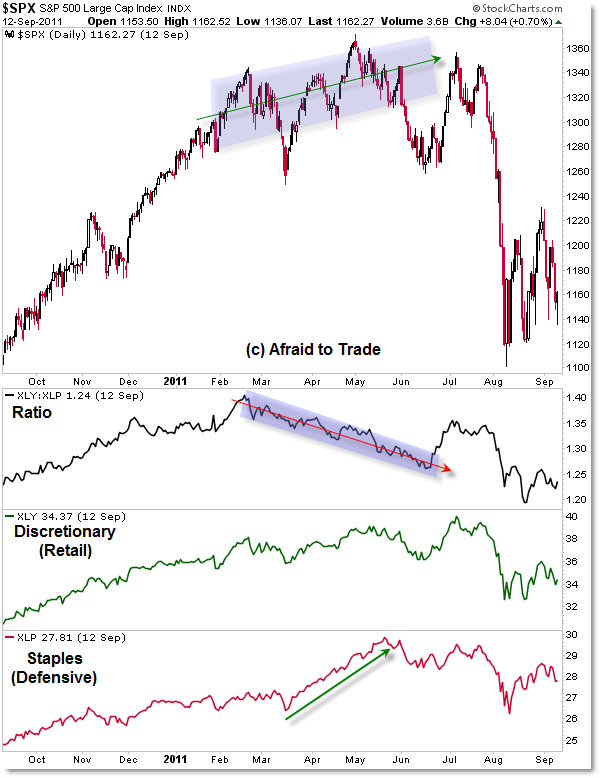
Skew remains elevated and the recent cluster of spikes exceeds 2011 where price arched over and then fell hard:
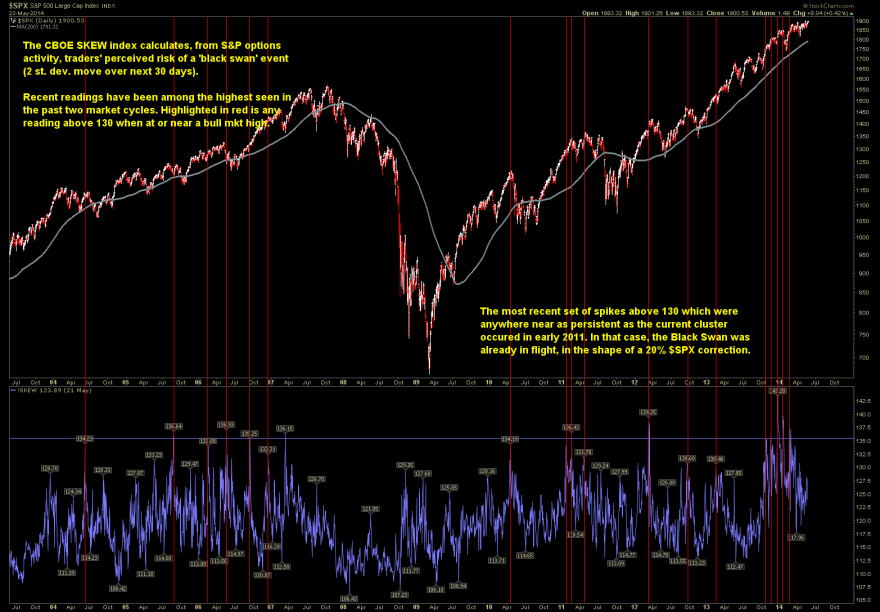
Source: James Goode
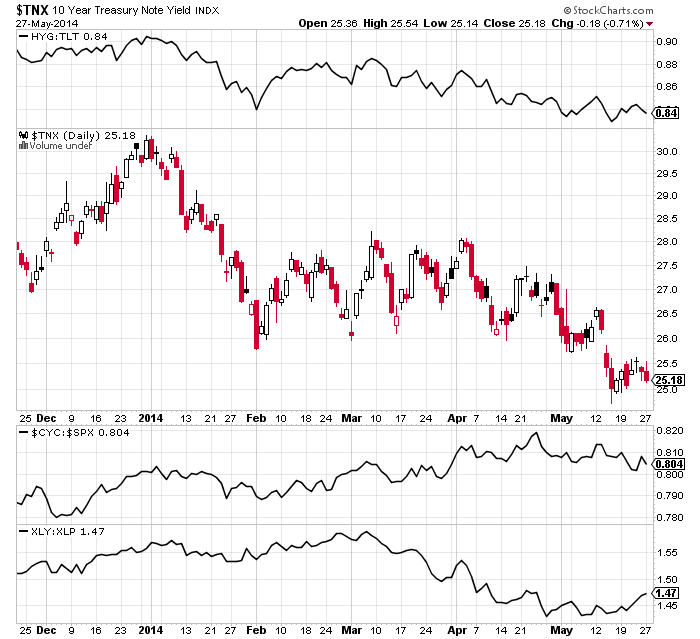
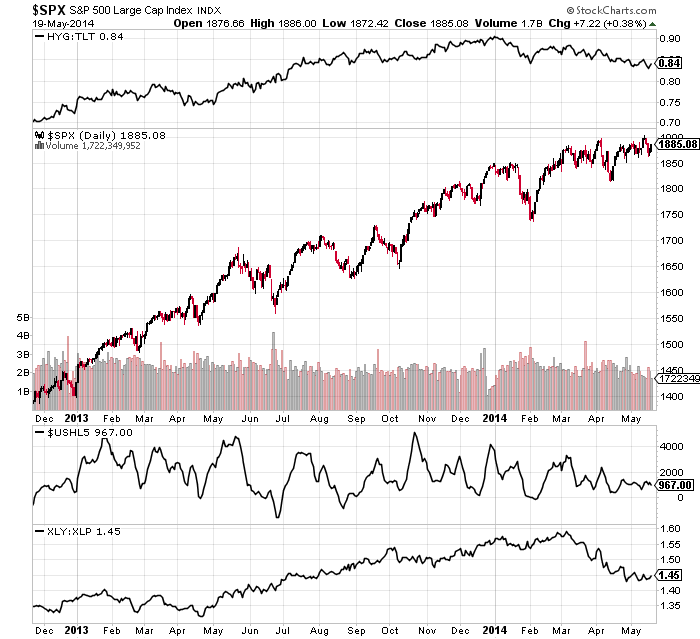
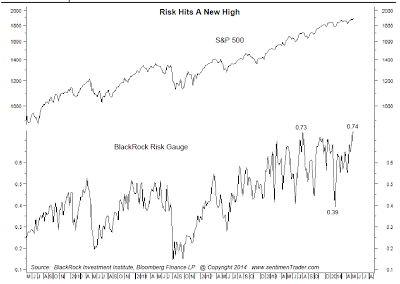
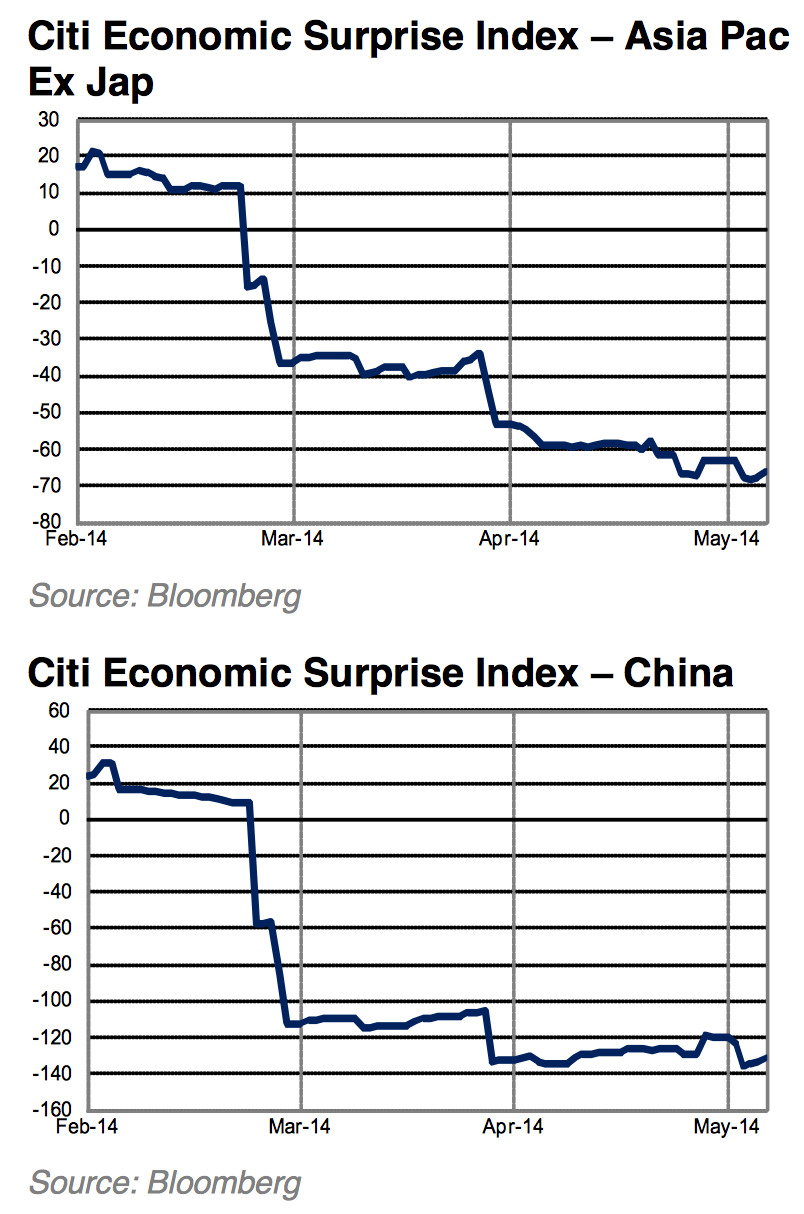
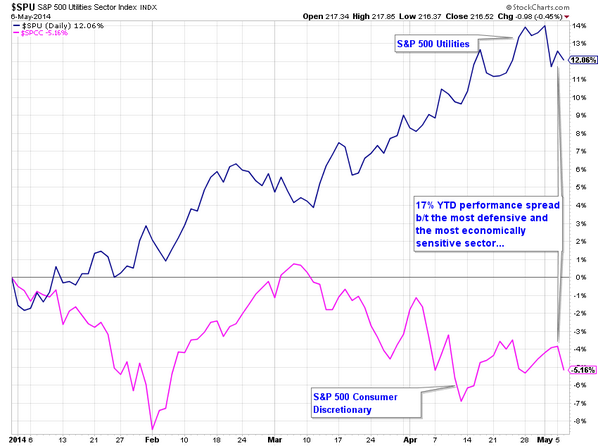
Risk-off remains the dominant theme in 2014, and this is a notable change in backdrop to 2013:
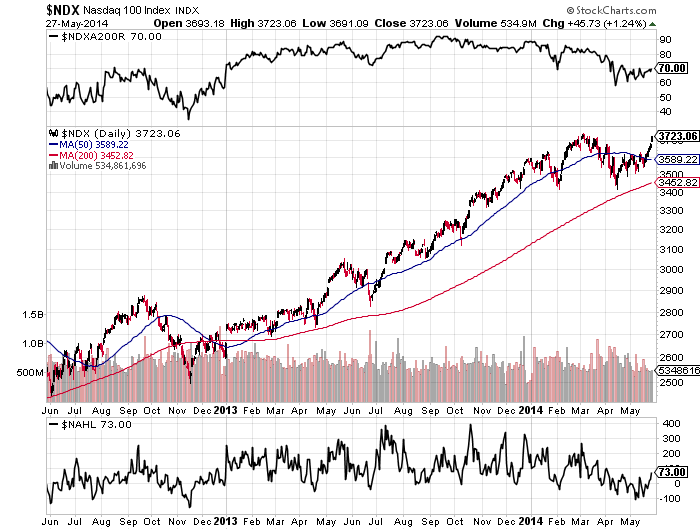
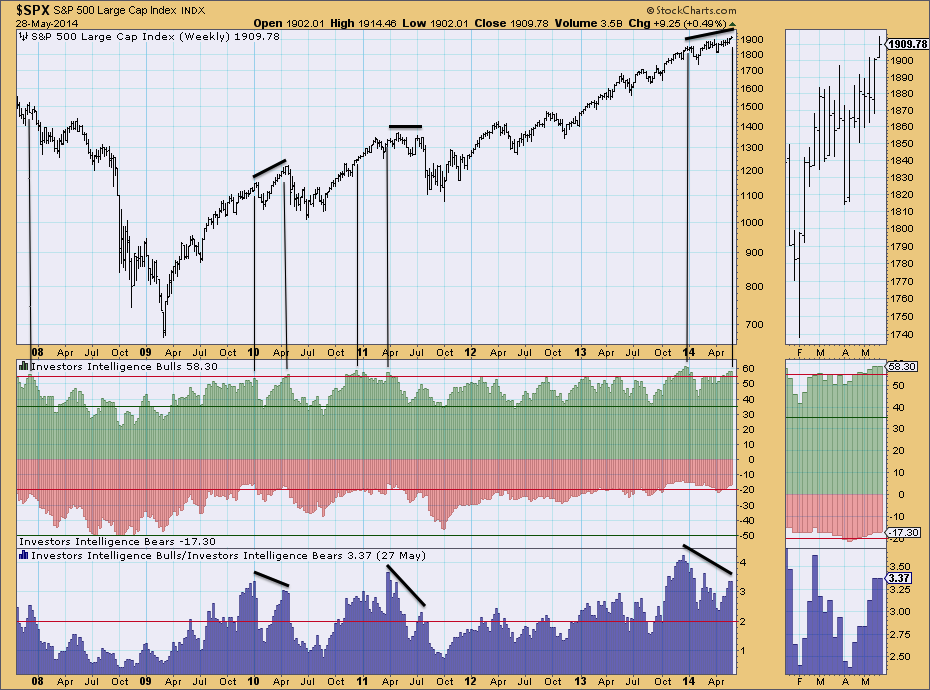
 We can see the relative performance of cyclicals just turning up again recently in the bottom of the chart above. The Nasdaq 100 and Russell 2000 perked up last week too. So might we now see all-round bullish resumption? Small caps and tech corrected by price and large caps corrected by time? Well, neither saw the requisite wash-out in indicators to reload the bull. Investors intelligence sentiment has stayed elevated, volatility low and euphoria present. The negative divergences have not been resolved, but worsened, and various indicators continue to be at historic warning levels. All these suggest it is more likely that large caps fall imminently and join the other indices in a true correction, rather than we now see broad bullish resumption.


Source: U Karlewitz
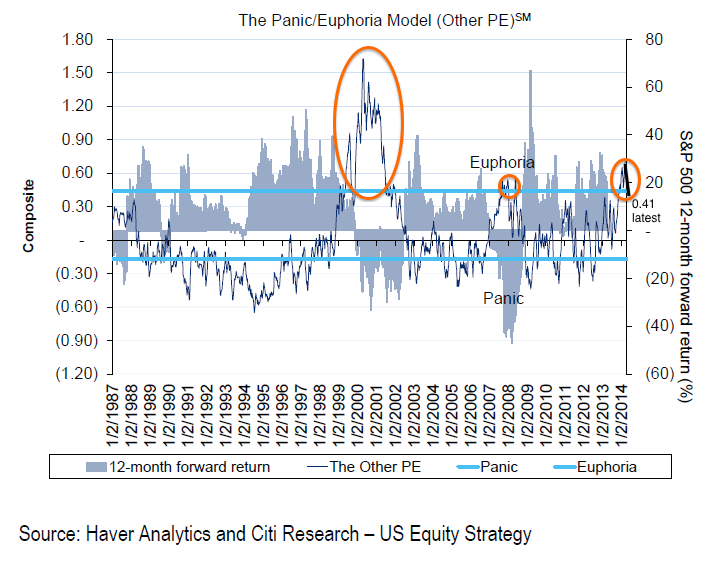
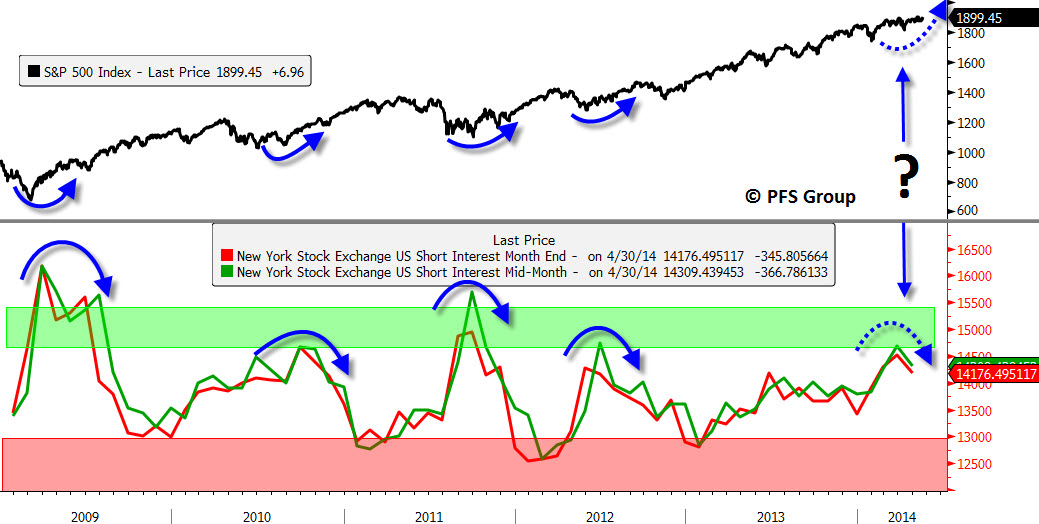
But if there is to be a bullish resolution here, then it appears short interest could provide the fuel for another leg up:

Source: Chris Puplava
Note though that short interest is a component of the panic/euphoria model above which is more bearish than bullish, but nonetheless we could potentially have room for another leg up in the summer before price finally turns over.
If prices did break upwards here then we might take a fresh look again at those analogs from history (in terms of similar valuations, leverage, sentiment, etc) whereby a price range led to a final overthrow push up before hard falls erupted:
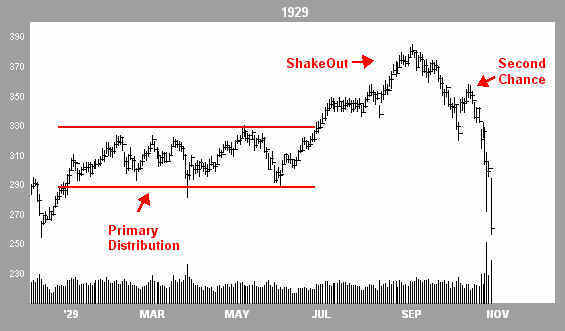
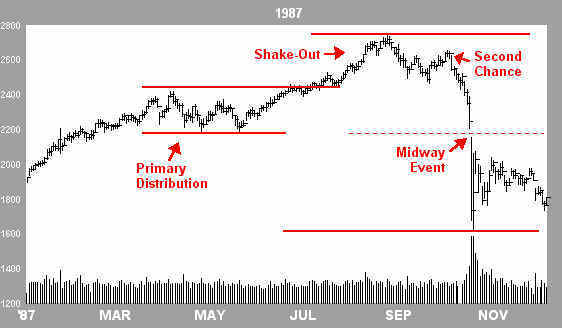
Source: Financial-Spread-Betting
In both those cases prices broke upwards around the end of May out of a trading range. However, know that leverage did not peak until October in 1929 and September in 1987 respectively, whereas it appears that leverage peaked out in February 2014. We ought therefore to see margin debt reverse the recent declines and rally to new highs to enable a further significant rally in equities. There is no demographic tailwind.
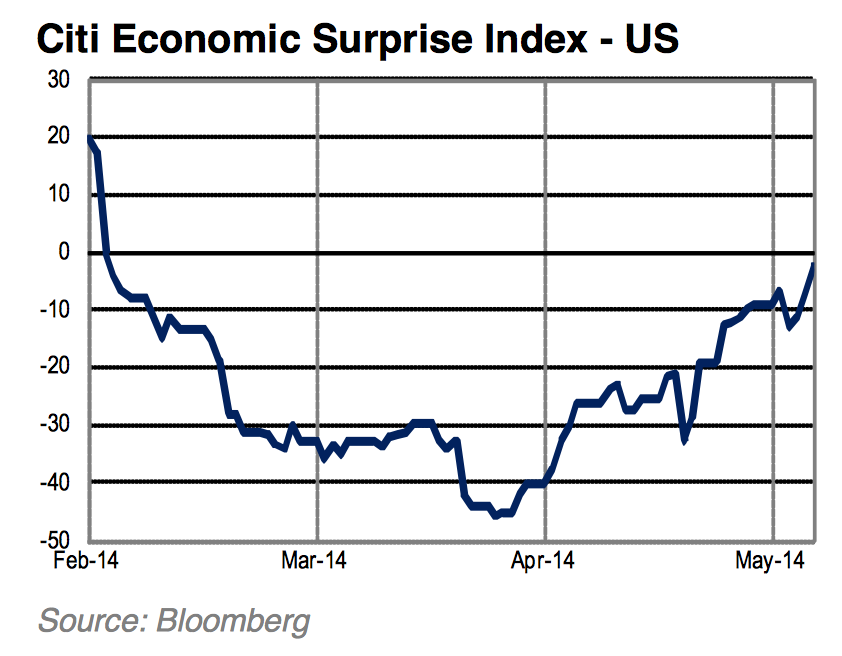
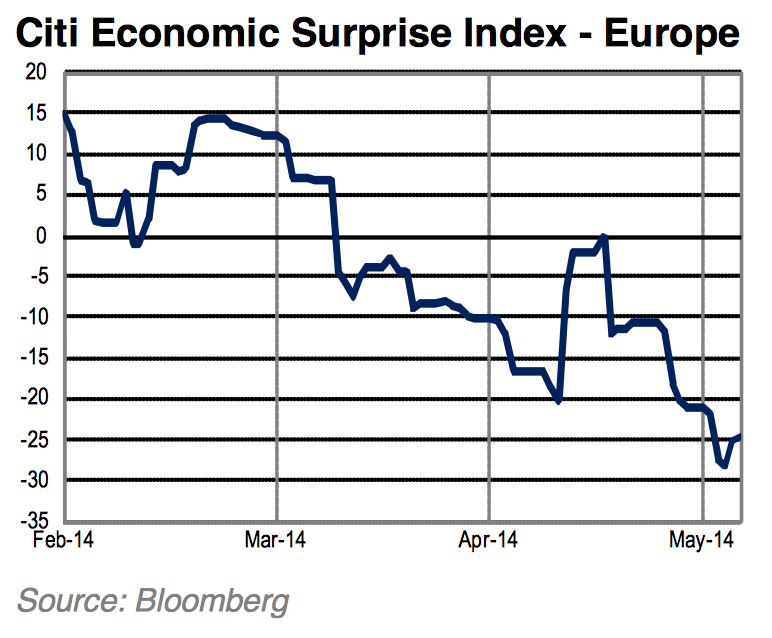
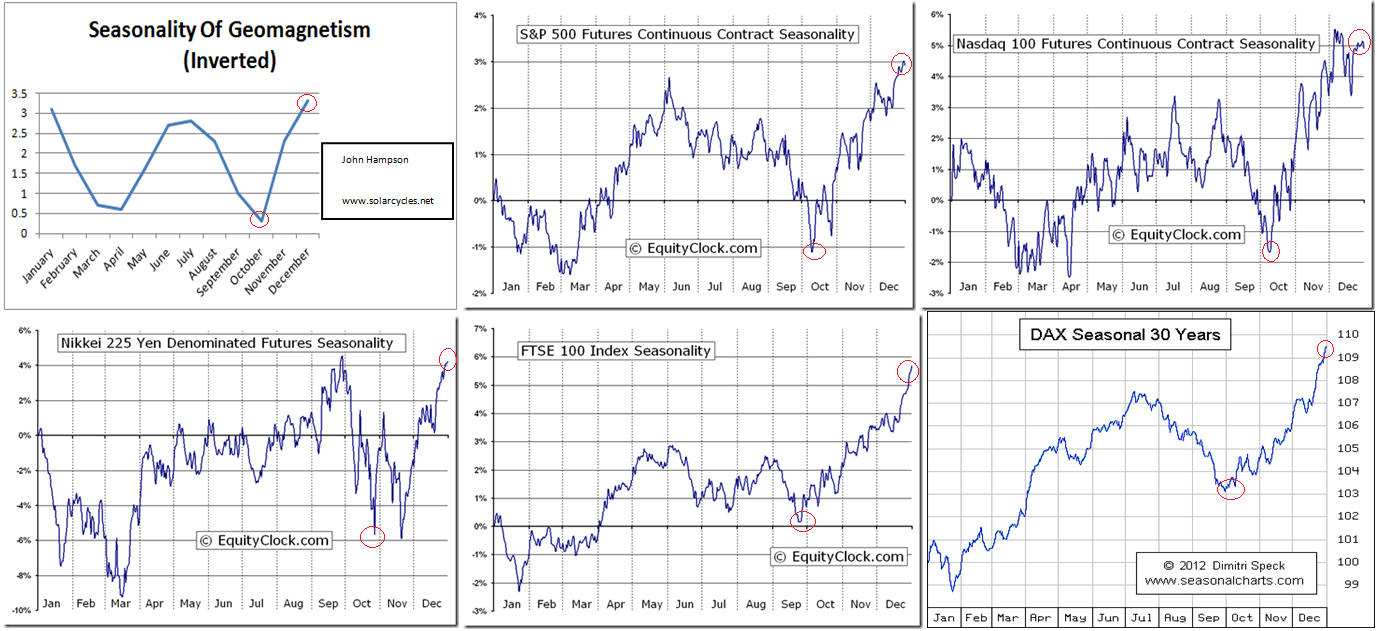
Leading indicators have been pointing to a mid-year pick up in the economy and economic surprises are now trending upwards again for the US. Might that also fuel such a final mid-year up leg, before falls in the Fall? It would fit with the seasonality of geomagnetism, whereas the Presidential cycle suggests trouble as of now. I continue to believe the development of the solar cycle is key. If the waning in sunspots continues (and May is likely to print a 3rd month of declines from the Feb peak) then we should see stocks and the economy turn down together. Margin debt and small caps are leading the way and the rest will follow. If, however, the solar cycle has a sting in its tail and prints an anomaly like SC16 (belated monthly sunspot spike) or SC5 (belated smoothed maximum), then we should see speculation in assets and activity in the economy continue to bubble away and margin debt make higher highs. So we can continue to cross-reference.
Drawing on the 2000 and 2007 margin debt progressions, it looks more likely that margin debt topped already. However, both years saw a pause in margin debt declines whilst a summer rally took stock prices to a secondary peak:
Source: DShort
For now, the balance of probability suggests the solar cycle is now on the wane (sunspots since Feb, solar scientists’ predictions, bulk of previous solar cycles compared, margin debt decline and froth stocks peak Feb-Mar), and the balance of probability suggests large caps will tip over imminently and join small caps in true correction, and that this is the last gasp of the cyclical bull. There are too many bearish indicators, divergences, and red flags to enable a bullish resolution here. For stocks to break up and out of 2014’s trading range, we would need to see repairs to volume and breadth and risk-off money flows, and we would need to print anomalies in some historically reliable indicators. Failing that, it looks likely that the SP500 will be repelled again at the top of its arching-over price range. With Monday a US national holiday, there is just one trading day before the new moon which could then initiate renewed downside as lunar phase extremes typically do a good job of marking trend changes when price action is overall choppy.
In summary, the case is still overwhelmingly bearish for US stocks, and my primary scenario is that prices are arching over into imminent hard falls, to correct the multitude of extremes in valuations, sentiment and technicals that have been in place for some time. Small caps, tech, margin debt and sunspots all look to have peaked around February and I expect large caps to fall in line. However, there is a lesser case for another bullish leg over the summer before hard falls in the Autumn, and that remains my worst case scenario. If that is to occur though, we need to see supportive developments in volume, breadth, cyclicals and other indicators. I continue to attack and trade short, and look to this week’s new moon for another potential definitive peak in the SP500.

 Yesterday’s potential new moon reversal tantalisingly sets the scene for renewed declines, to keep all in tact.
 …and the Nikkei peaked again on 31 December 2013, as did various risk-on / risk-off ratios shown here:
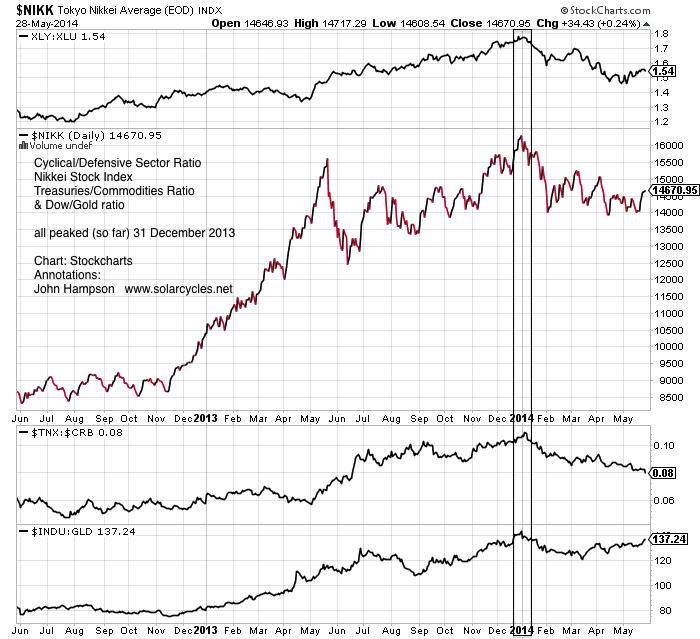

 Source: DecisionPoint / Annotations: John Hampson