3 Exact Dates

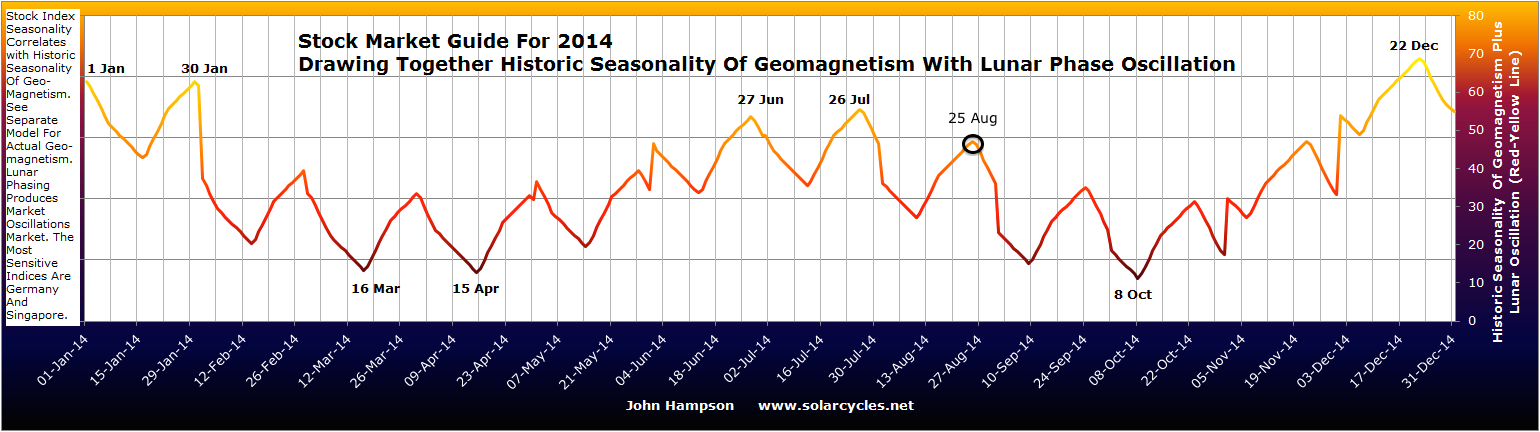
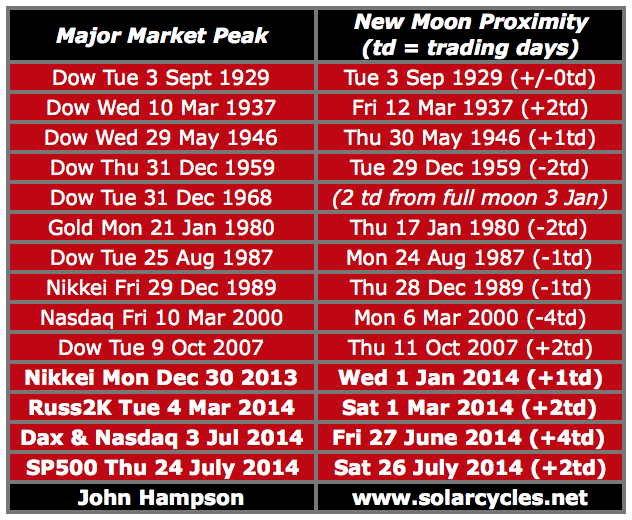
As we wait for the ECB decision and market reaction, I see 3 exact dates being revealed that align with my ‘triple confluence peaks’ idea, i.e. we are seeing major market peaks form at the new moons closest to the geomagnetic seasonal highs (inverted) closest to the smoothed solar maximum.

The smoothed solar max is likely to have been around April 2014.

22janu14

The seasonal peaks (inverted geomagnetism) fall at the turn of the year and mid-year.

22janu1

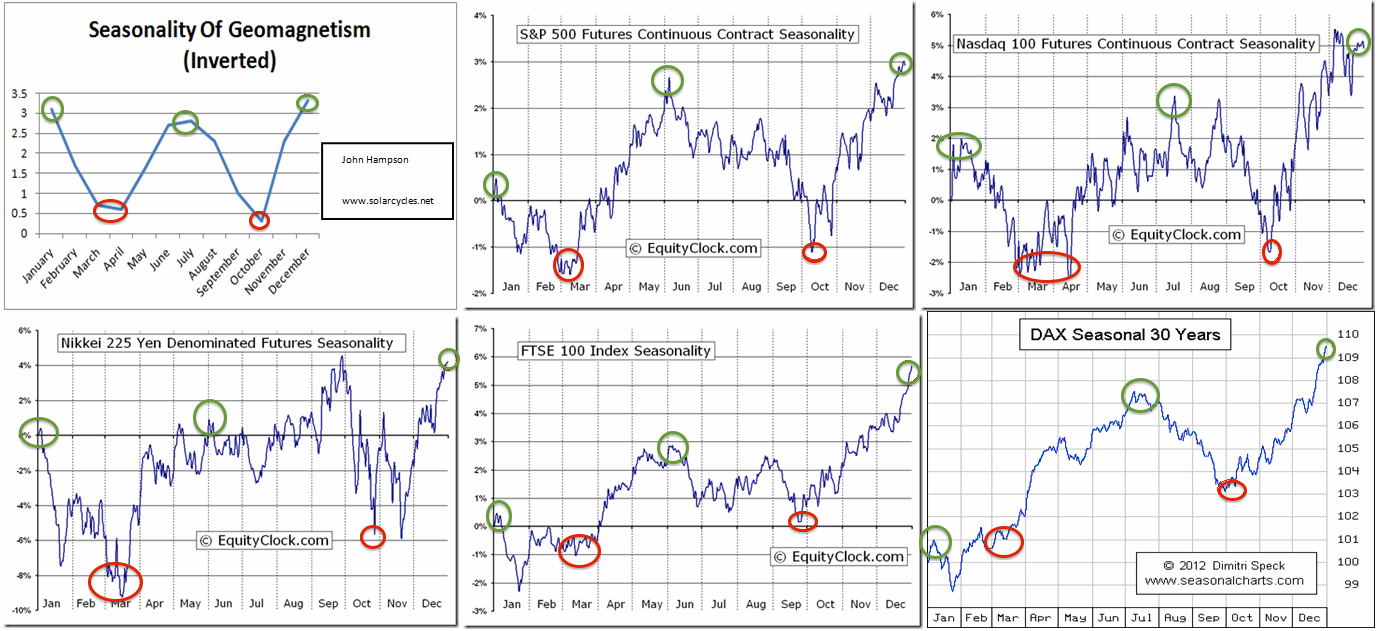
The new moons closest to these seasonal peaks were 1 January 2014, 27 June 2014 and 22 December 2014, so it follows that we should see major speculation peaks at these dates in the year of the solar maximum, 2014.

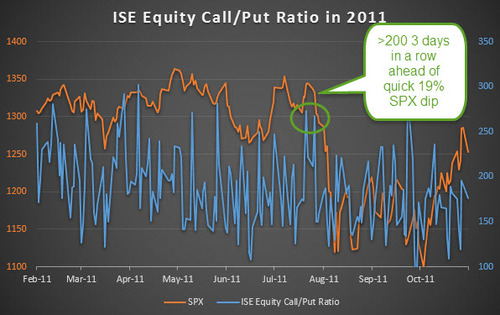
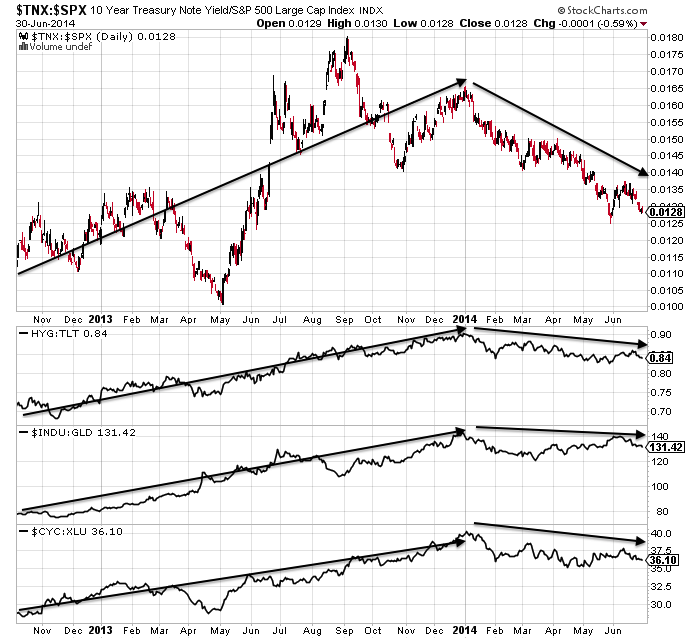
Bullish percent to call/put, cyclicals to defensives, high yield to treasuries and small cap equities to bonds all peaked very close to the 1 January 2014 date.

22janu2
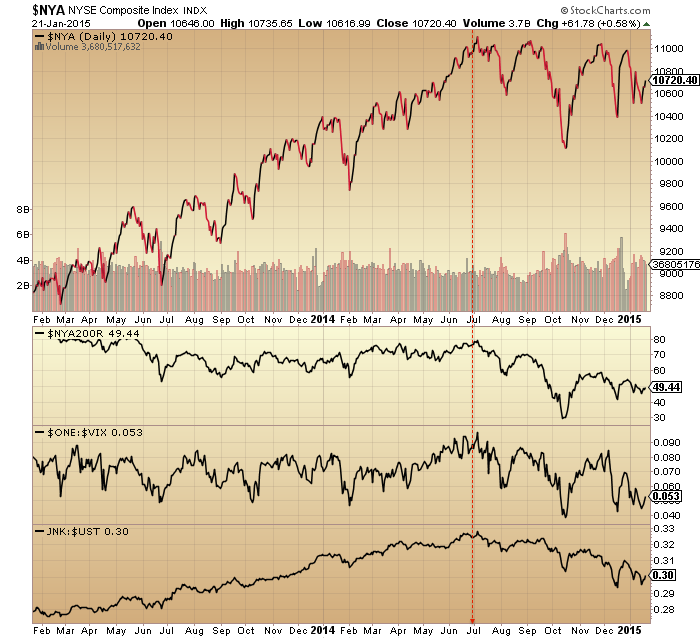
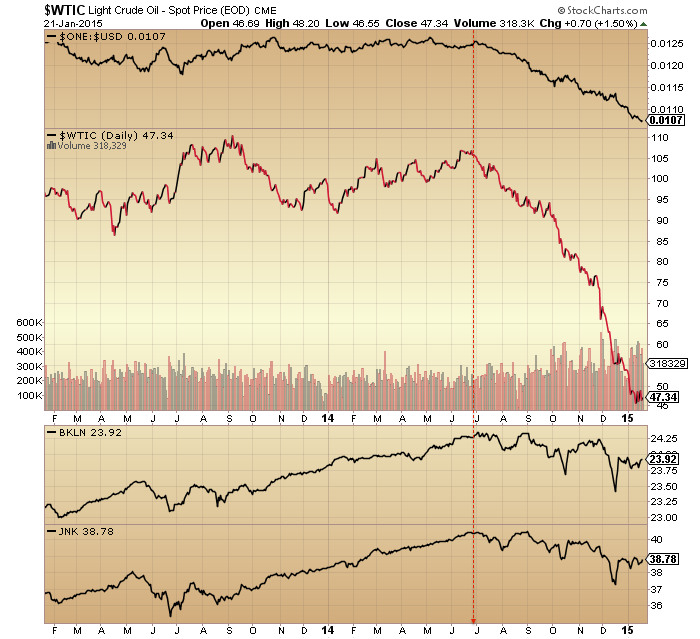
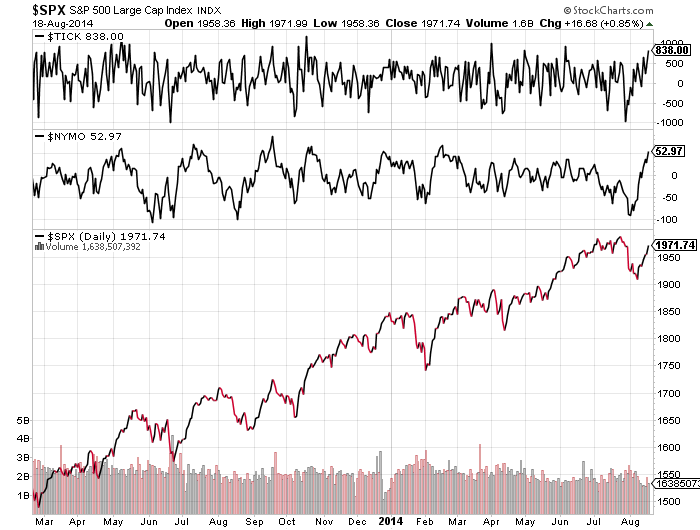
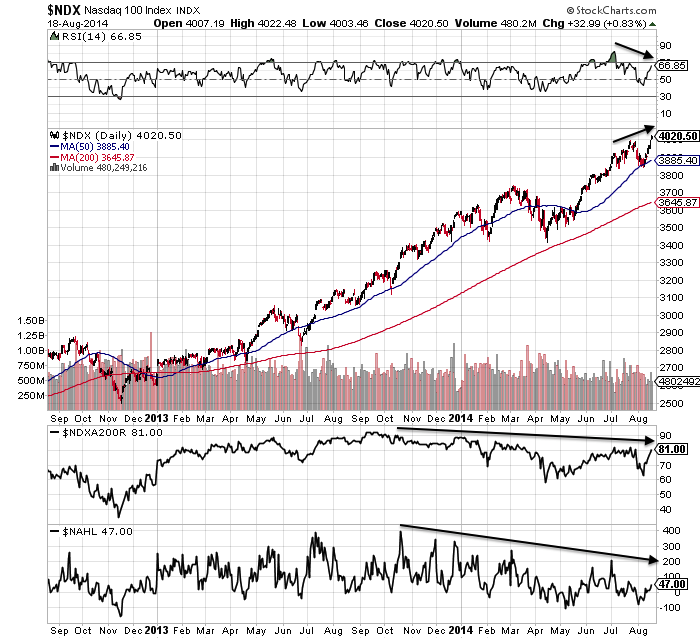
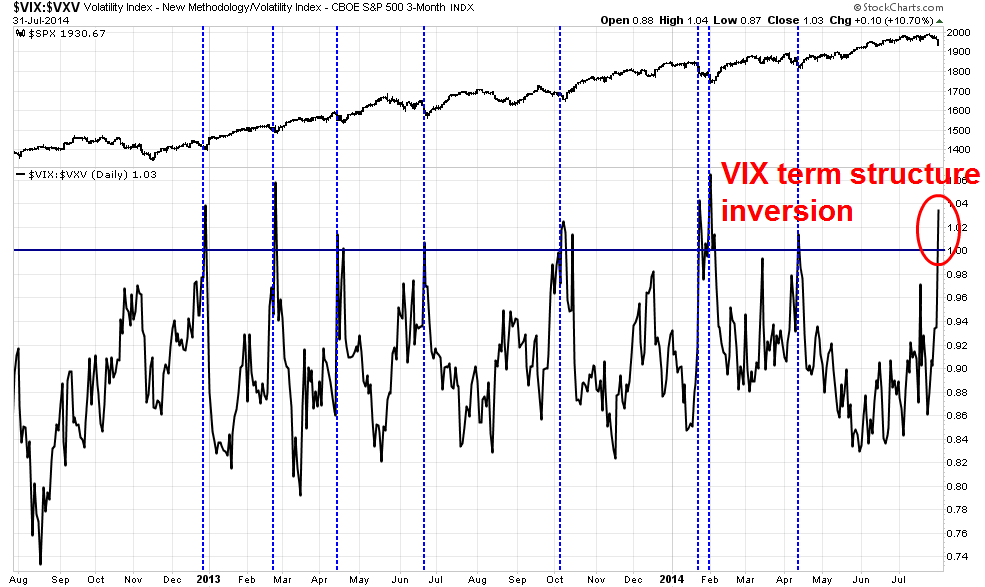
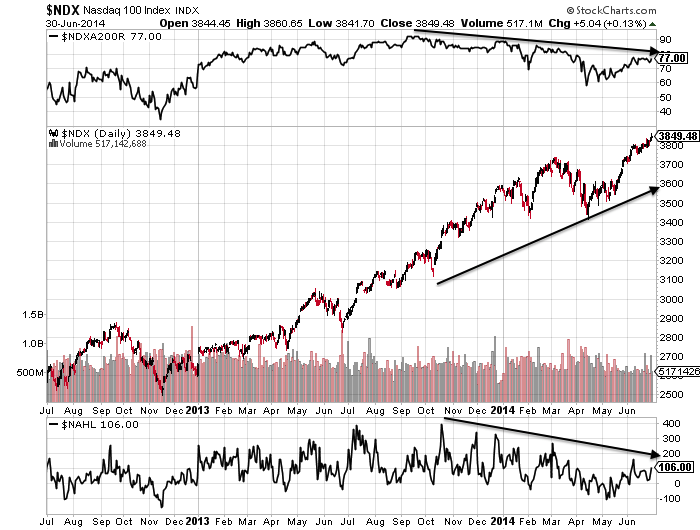
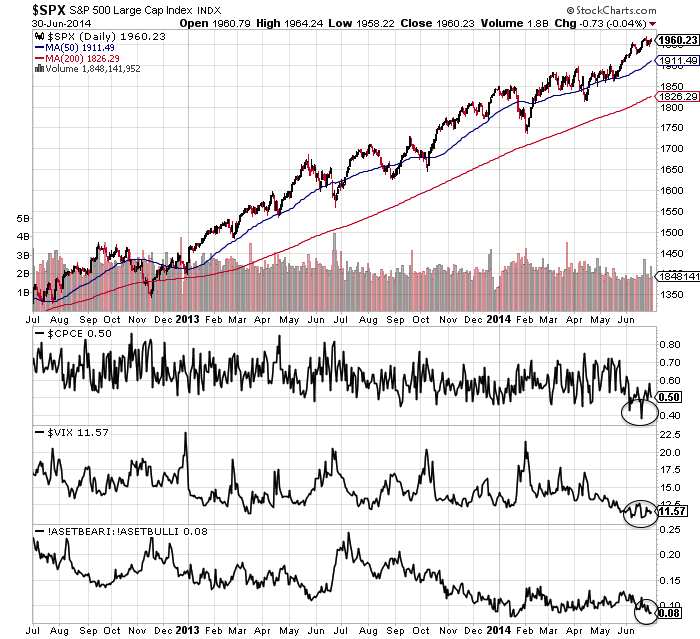
Stocks:dollar, stocks:bonds, FTSE Eurostox and NYSE composite indices, NSYE breadth, volatility and junk:treasury bonds, oil, US dollar (inverted), leveraged loans and junk bonds all peaked very close to the 27 June 2014 date.

22janu7 22janu5

22janu3

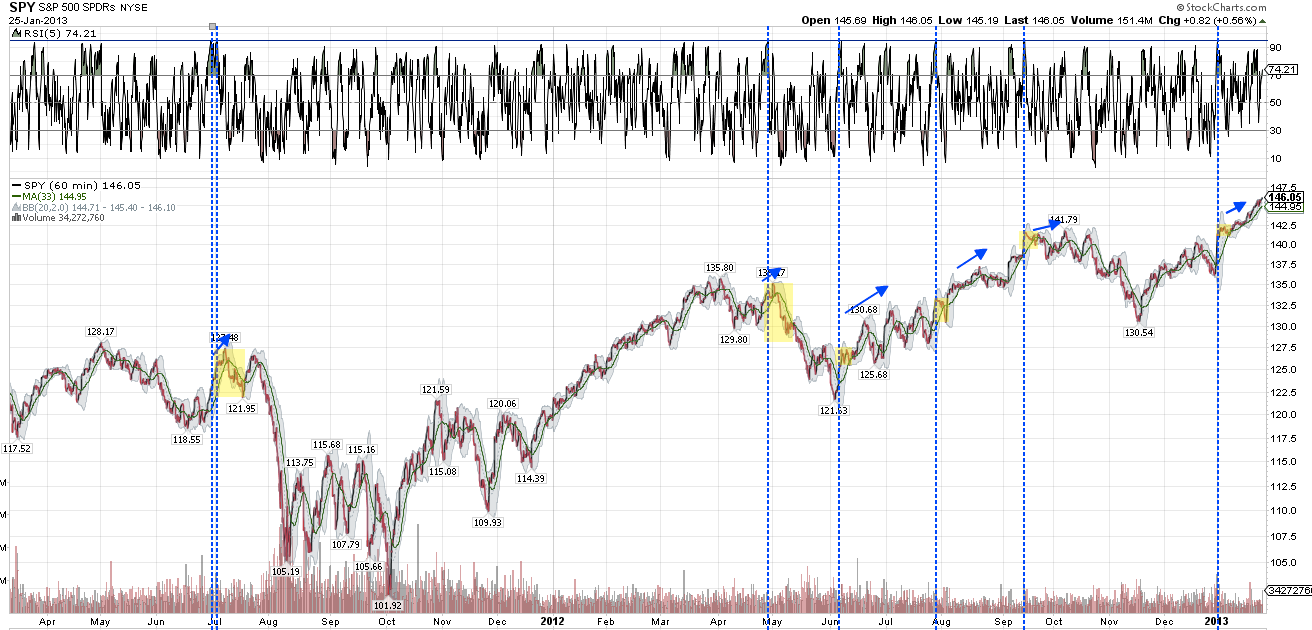
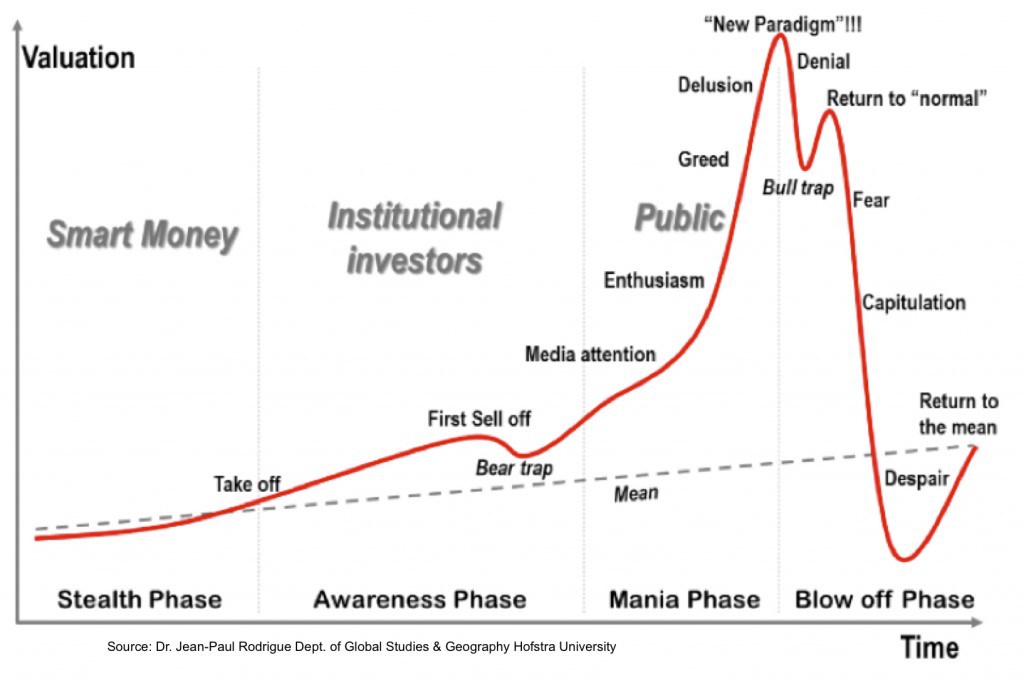
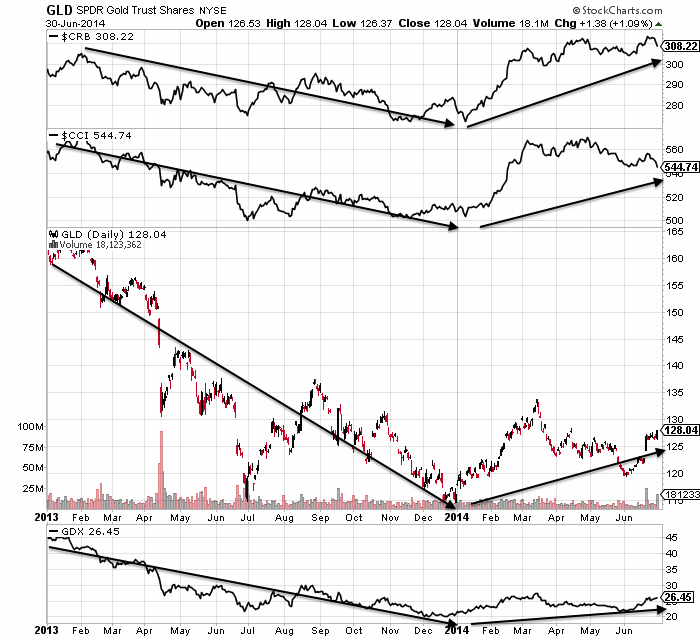
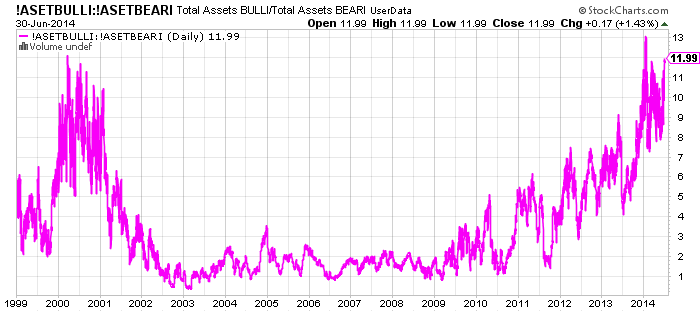
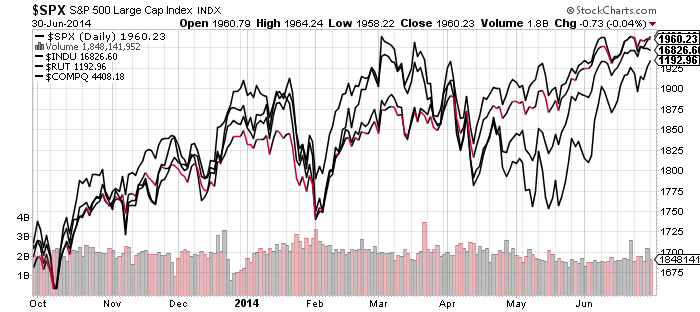
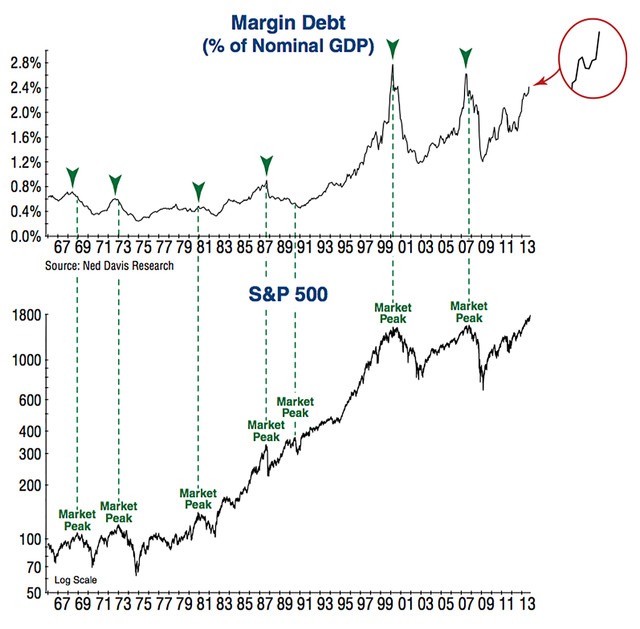
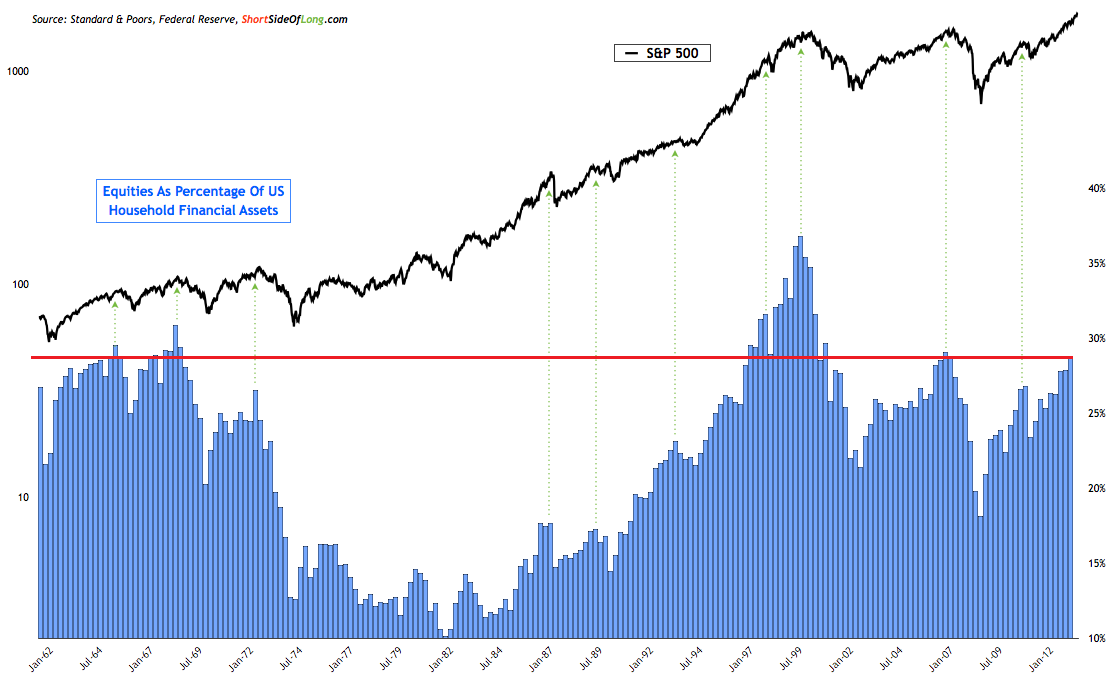
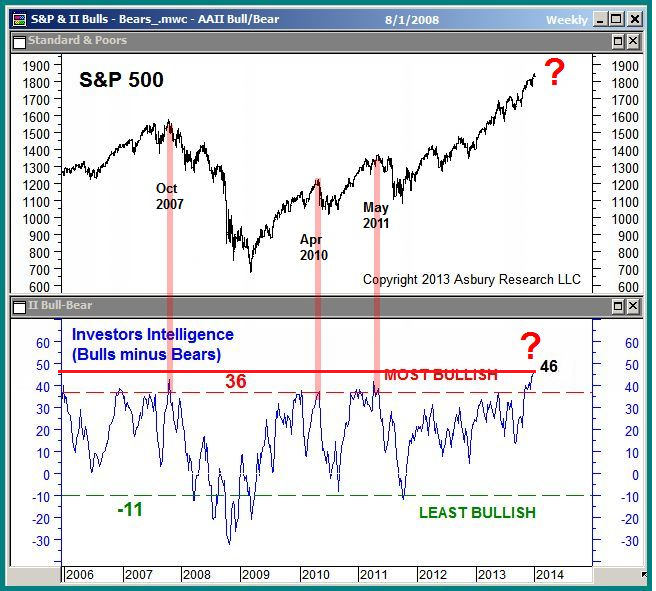
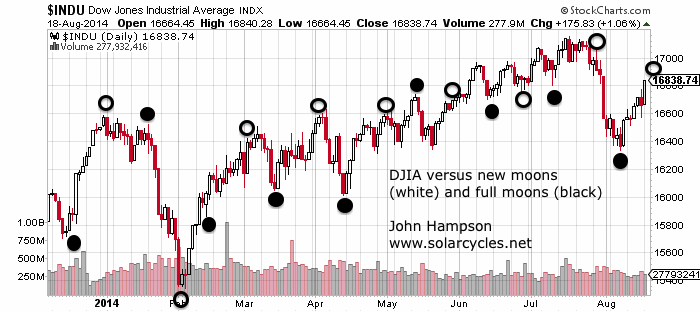
The final date, 22 December, has tentatively topped out the remaining key indices and speculation measures, namely SP500, Dow and Wilshire 5000 (plus an associated bottom in gold) and a blow-off top in sentiment and allocations.

22janu4 22janu6If this ‘dumb’ model of the markets is correct then we should make no new highs from here but rather collapse to a March/April initial bear market bottom (first leg down).

If an anomaly is at hand and the solar max is still ahead or speculation somehow extends further in time, then the next logical peak would be mid-year 2015, likely June 16. However, I rate this possibility as negligible. Look again at the risk measures that changed course Jan 1 2014: they remain in downtrends ever since. Add to these the large range of assets and indicators that peaked June 27 and remain in downtrends ever since too. Then consider the change in market and cross-asset behaviour since the final date, Dec 22, together with that capitulation in sentiment and allocations. This has to be game over, in my opinion. However, if we consider it a game in which central banks can cheat and change the rules, then maybe, just maybe, natural forces can less freely flow through the markets. I don’t think this is likely as central bank members are solar subjects too. However, this is subject to confirmation in a critical real time test in 2014-2015. Market reaction over the next few days to the ECB announcement will be a key tell.


Advertisement

Short Term Update

With Monday being August’s new moon, we arrive at the last higher-probability topping point mid-year 2014 for those indices which have not yet topped out:

22au9

With SP500 and Nasdaq overbought and showing negative divergences, their breakouts this week have the potential to become fakeouts here.

22au10Source: Stockcharts

SP500 hourly RSI reached >95 and previous occurrences are shown in yellow on the two charts below, i.e. typically a pullback followed:

22au7 22au8Source: U Karlewitz

ISEE put/call ratio is 3 days over 200 and the last such occurrence led to a drop in January and the previous time before that in 2011:

22au2 22au3Source: Ryan Detrick

Thursday produced the most NYSE unchanged issues since 22 Feb 2007 (source: Dana Lyons), which could be a sign of complacency as last time it preceded a 3.5% drop on 27 Feb 2007. This is supplemented by Skew which is back at historical elevation warning of a potential big down move:

22au6Source: Big Charts

Nasdaq reached a Demark exhaustion sell signal on Thursday and SP500 is expected to today.

Gold has weakened as the US dollar has surged higher. However, positioning in the Euro, which acts inversely to the USD, suggests that may be about to reverse:

22au13

Source: Emma Masterson22au12

 Source: J Lyons

In short, we have the set-up for a reversal here in both equities and USD, for at least a partial retrace of the recent gains, and as we pass through Monday’s new moon the set-up looks good for a down week next week. Margin debt has yet to be released for July, but with indices overall down in that month I expect a decline. However, if stocks were to rally further next week it would raise a question mark over margin debt in August, whilst taking the Dow to new highs and cementing the breakouts of the SP500 and Nasdaq. Alternatively a down week next week should create fake-outs on the SP500 and Nasdaq and set up the possibility of a full retrace of the rally of the last 2 weeks. The negative divergences on the new marginal high in SPX versus the July peak support this occurring:

22au15Source: Stockcharts

Failure High

The potential post-second-chance positioning was negated as the rally since the 8th August gained momentum, albeit out of hours momentum. So the question is whether this rally now produces the failure high second chance peak, i.e. a lower peak than July, and thereafter we tumble into the bear-controlled post-second-chance market.

Whilst the Nasdaq has made a marginal higher high, the RUT, DJIA and European indices are some way from their peaks and as we reach increasingly overbought here, the odds favour those indices turning down again to cement lower highs. Plus, the Nasdaq has made the higher high on negative divergences, making the potential to become a fake out. If that is to occur, and with the SP500 not far from its July peak again, a renewed move to downside has to happen fairly promptly. With the new moon several days away providing such a potential peak (an optimism peak), that now becomes my most probable case: markets topping by the end of this week, making a lower peak to July on the majority of indices, and a critical lower high / failure high.

Tick and Nymo amongst those indicators showing overbought:

19au5

Nasdaq 100 negative divergences in place since late 2013, plus short term RSI divergence:

19au29

R2K, SOCL and IBB still peaked Feb/Mar but need to turn down soon to maintain the lower high / failure high patterns. A look at IBB shows the typical bubble model has played out and the short term RSI divergence shows the potential for another leg down. If that does occur, then it should be the major bear leg down. However, the recent rally has made the turn-down fairly urgent.


19au26 19au25The Dow versus lunar phase oscillation shows the potential for a peak around the new moon of August 25th, which would also likely be a lower high, adding to the case of the late-July breakdown:

19au27


The bigger picture argues that a major peak in equities is in, and if not in, then overdue. Ten different angles on a stock market peak produce a cross-referenced case:

1. HYG:TLT divergence at major peaks:


19au8

 Source: InflatedTemper

2. Implied correlation at major peaks:

19au22

 Source: Rory Handyside

3. Skew at major peaks:

19au23

Source: Rory Handyside

4. Sentiment at major peaks:Screen Shot 2014-08-19 at 08.26.30

Source: Ed Yardeni

5. Valuations at major peaks:

19au24


Source: DShort

6. Sornette bubble end flagged at the start of July:Screen Shot 2014-08-19 at 08.27.23

 Source: Financial Crisis Observatory

7. Various risk measures peaked, along with the Nikkei, at the turn of the year:

19au10

8. Rydex allocations echo the 2000 peak:

19au9

9. Sector rotation shows the two post-peak sectors of health care and utilities performing strongly relative to others:

19au2

 Source: Macromon

10 Sunspots continue to be in a waning trend since their February peak, and a smoothed solar maximum of Feb/Mar ties in with margin debt and hot sector/index peaks of Feb/Mar as the speculation peak epicentre:
Screen Shot 2014-08-10 at 16.30.44


To sum up, I am looking for European indices, RUT, SP500 and DJIA to make lower highs / failure highs / second chance peaks by the end of this week around the new moon, and thereafter break downwards into post-bubble-pop momentum, into the geomagnetic seasonal low of October. Past analogs show hard falls lasted up to 8 weeks, which ties in with the available window from late August into late October. The mulit-angled case is still strong for a major peak not just being at hand but being in already, and the out-of-hours, low volume nature of this rally since 8th August add to the likelihood of it failing and cementing the broad July final peak in risk, in a topping process that began at the turn of the year.

Timing Major Market Peaks: Revisited

In the original post (HERE) I showed that major market peaks typically occur:

1. Within the month – at new moons (optimism peaks)

2. Within the year – at inverted geomagnetism seasonality peaks (optimism peaks)

3. Within the decade – at the solar cycle maximum (speculation peaks)

Demographic trends determine which asset is the speculative target and whether the peak at the solar maximum is cyclical or secular.

My case is that stock indices have now all peaked out in 2014 and we are post smoothed solar maximum, so on those assumptions, here is how things stand.

The major world stock indices largely topped out close to new moons between Jan and July 2014 as shown in bold in the table, aligning with historic norms:

Screen Shot 2014-08-11 at 07.48.57The major indices, with the exception of the Russell2K, also peaked out at the seasonal geomagnetic peaks of the turn of the year and mid-year as shown below:

10au2The R2K peaked along with the hot sectors of IBB and SOCL, and margin debt, at the turn of Feb/Mar which is the projected smoothed solar maximum:

Screen Shot 2014-08-10 at 16.30.44

To complete the picture, demographics show us that this is a cyclical bull peak within a longer secular bear:

10au6In summary, equities were speculated up to a solar maximum major peak, making a cyclical bull peak within an ongoing secular bear that began in 2000. The topping process lasted from January to July 2014, centred around the smoothed solar maximum / margin debt / RUT / IBB / SOCL peaks of Feb/Mar. The Nikkei and various risk measures such as high yield:treasuries and dow:gold all peaked at the turn of 2013-14 at the year end inverted geomagnetism peak, and the remaining stock indices peaked throughout the month of July at the mid-year inverted geomagnetism peak. The majority of peak closes fell around new moons.

In short, the market peaks in 2014 align well with historic norms, if they were the ultimate peaks. If higher highs are still ahead in equities, then we are moving away from the (likely) smoothed solar maximum and out of the mid-year seasonal peaks into a less typical zone. We could make an outside case for final higher highs around the new moon of Aug 25, but this possibility is weakened further when we cross-reference with market indicators (see HERE), which also point to the topping process completing in July. Therefore, the case is strong for the top being in.

So to the short term. Markets appeared to invert at the full moon (Sat) on Friday, starting with a big drop in the Nikkei and ending with a firm close and downtrend breakout in the US. This has relieved the oversold indicators that were gathering, but paves the way for further gains in the first part of this week. If I am correct about our positioning post-second-chance then bull action should be weak and bears should regain control fairly swiftly. So I am looking for fresh lows later this week.

Fire Is Lit

The fire is lit and should burn through pretty quickly, because if I am correct about this being the second chance peak (see HERE) then the mirrors from history reveal the end of the topping process gave way to rapid, deep declines:

Dow 1929: 3 weeks 44% declines

Dow 1937: 8 weeks 38% declines

Dow 1968: 8 weeks 18% declines

Dow 1987: 2 weeks 34% declines

Nikkei 1989: 6 weeks 27% declines

Nasdaq 2000: 3 weeks 35% declines

SP500 2011: 2 weeks 18% declines

They average out at 30% declines over 4.5 weeks. If it seems unlikely that we could see such a swift collapse after seeing such persistent strength, then know it is exactly what happened under these historic instances of similar extremes in valuations, sentiment, allocations, leverage, divergences and – for some – the peaking of the solar cycle. The lop-sidedness in sentiment and allocations, the excess leverage, the levitation above the 200MA, the mature divergences in place since the start of January: all together produce the ideal set up for waterfall declines or panic selling.

Yesterday, 31 July, finally delivered the kind of day I’ve been waiting for: a big gap down, selling that ran, a close at the lows and a major distribution day. It is also significant because I believe it is likely to cement the margin debt peak as February (all the indices ended down for July bar NDX, which was flat) along with bull market peaks in IBB, SOCL and RUT at the Feb/Mar turn. Plus, I believe it will cement the SP500 peak at 1987 (likely to get some coverage once the panic selling erupts) on July 24, which fell very close to the new moon and seasonal inverted geomagnetism (i.e. a twin optimism peak):

1au9

All the indices look to have made ultimate highs or lower highs around those twin peaks in the middle of that chart. My seasonal chart then shows the potential for weakness from here down to October, as does the Presidential chart below:

1au2

Source: Stock Traders Almanac

That gives us a window of 2-3 months in which we could see market falls, but the ranges from the historical mirrors further up are shorter at 2-8 weeks. So might I be wrong about the significance of yesterday (could we now rally up and print a new high in August before seeing the hard declines?) or might I be wrong about this being the ‘second chance’ peak (could large caps fall some more but then rally up again to a lower high in August/September, before hard falls erupt?)? I can’t rule either out, and the window we have (August-October) allows for both possibilities. However, my analysis puts us at the second chance peak, and the speculative-target sectors and indices of IBB, SOCL and RUT have all made clear lower highs making them likely to erupt from here into heavy falls. Could they potentially diverge from large caps? Also not impossible, but I suggest it is unlikely that small caps see panic selling whilst large caps rally or consolidate.

This is how the Dow stands after yesterday’s selling:

1au5

 Source: Stockcharts

The wedge is clearly broken, so horizontal dotted support or the 200MA might now come into play. Nymo and Vix:Vxv are showing a potential bounce:

1au4

Source: Stockcharts
1au1

 Source: Cam Hui

However, if that was the second chance peak giving way, then there should be little chance given now to either get out of longs or add short, i.e. any bounce should be short-lived and the down days very unforgiving.

If the markets were to sell off again today, then historically we have seen some instances of heavy falls on the Monday following weekend worrying, so something to bear in mind. We have another week of negative lunar pressure next week, which adds to the bearish set-up. But let’s see if a bounce can be mustered today per those indicators.

If I am correct about the waterfall declines hitting now in this Aug-Oct window then drawing on those historical mirrors again, we ought then to expect a subsequent slower partial retrace of those falls lasting around 4 months. So hard falls averaging 30% over 4 weeks followed by a 50%+ retrace of those falls averaging 4 months, before we tip conclusively into a full bear market. The key then will be trying to gauge by when and at what level the panic selling leg is complete. As an initial marker, the lightest falls in those historical analogs were 18% which would be 1629 on the SP500 from the 24th July top. So as a guide I will be looking to refrain from taking any short profits until we hit at least there, but indicator readings will help refine that as we progress.

All subject to confirmation of course from the markets. It was just one day yesterday, but it does look like a killer punch, at the right time.

Three Peaks

By the end of 2013 we saw various divergences emerge that warned of a potential trend change ahead, and still do:

1jl1 1jl2The first major peak point occurred at the turn of the year, around the 2 Jan new moon and at the inverted seasonal geomagnetism peak (i.e twin optimism peaks), as these charts show:

1jl6 1j18There were inversions at this point in different assets and sectors, and the Nikkei peaked-to-date 31 Dec. Various risk-off, defensive and late cyclical assets and sectors have been the dominant money flow targets since then.

The second major peak was the central peak: where the solar maximum, margin debt and the speculative-targets of RUT, IBB and COMPQ likely made aligned tops, close to the 2 Mar new moon optimism peak:

1jl22

1jl10 1j12

The third peak, I believe, occurred at the end of June, close to the 27 June new moon optimism peak and the mid-year inverted geomagnetism seasonal peak (again, twin optimism peaks), to complete the topping process:

Screen Shot 2014-07-01 at 08.16.14 1jl9

Indicators showing the three peaks:

1jl15 1jl3 1jl5Screen Shot 2014-07-01 at 08.15.22The four main US indices aggregated also show the three peaks:

1jl20

And this echoes what happened in 2000, where there was a first peak around the turn of the year (real Dow, Nikkei and FTSE all peaked 31 Dec), a second central peak around March (hot sectors, margin debt and smoothed solar maximum), and a third and final peak around August:1jl19So could stocks then run higher yet and postpone the final peak until late summer or even further out? I can’t rule it out, and it is the main threat to my positions: greater drawdown before it swings definitively my way. However, the trend in leverage suggests further price gains from here are unlikely. The COMPQ is at a suitable double top, whilst the RUT and IBB should make lower highs here to honour the Feb/Mar central peak. Various indicators are stretched to levels that are suggestive of ‘all-in’ or imminent reversal. We have mature divergences seeking satisfaction and fundamental doubts through Q1 GDP, negative economic surprises and Q2 earnings warnings.

The bull case: low rates, benign leading indicators, cumulative-advance declines. But the rhyme with 1937 is still very applicable here in my view. Low rates and a/d breadth accompanied stocks to a high overvaluation peak, like today, front-running a return to normal growth and earnings that didn’t happen, and peaking out with the solar maximum. Q1 GDP has gone some way to puncturing that normalisation assumption again, adding to the other factors being in place. Earnings season could now add to that. Once stocks fall, the wealth effect from a rising equity market will evaporate, helping tip the fragile economy over, as it did in 1937.

Fake Out Top

By my work, that completes the cyclical stocks bull market peak.

The solar maximum is looking likely to have run from Dec 2013 through to April 2014 (smoothed peak ~Dec, monthly peak ~February, daily peak ~April). The real inflation-adjusted Dow peak stands at 31 Dec, along with the Nikkei, at the new moon. Various cross-asset measures also inverted at that turn-of-the-year, which has been historically potent, as the inverted geomagnetism peak. The Nasdaq and Russell 2000 peaks were at the turn of Feb-Mar, also at the new moon. The nominal SP500 and Dow peaked-to-date at the full moon of two days ago, making for an inversion.

If the solar maximum, inverted geomagnetism peak, and lunar phase extremeties rule the markets, then all four indices are now likely in bear markets, and whilst we won’t know that for sure for some time, we will know soon enough if those peaks are taken out.

It is the cross-referencing of the timing measures (solar max, geomag, lunar phase, DeMark) with the technical and fundamental indicators (valuations, sentiment, equity allocations, leverage, divergences, cross-asset performance, bull market measures, demographics) that makes this so compelling. The technical/fundamental indicators suggest the top timing should be now (Dec-May), the timing measures in turn suggest the indicators ought to be flashing red in that window, and they are. Indicators on red began to accumulate towards the end of 2013 and the last few recently fell into place: a decline in margin debt, a waning in the monthly sunspot count, a snapping of the parabolics (biotech, internet), DeMark exhaustion.

For these reasons, it is unlikely that the markets can extend longer or higher, and whilst I cannot rule out higher prices, the attempted break-out by the large caps of several days ago was an important test that looks to have failed. I still remain confident that waterfall declines will erupt, as the historic leverage is unwound, but the question is when. I was too early in their prediction as the solar maximum extended beyond solar scientists’ expectations. Assuming the solar cycle continues to wane from here, then I have two possibilities in mind. The one is those sharp falls erupt imminently, once technical price supports are broken. The other is they erupt around Sep/Oct at the inverted geomagnetism seasonal low, which has hosted most of the major historic waterfall declines. I am specifically talking about 3-4 weeks of panic selling, differentiating that from a more measured bear trend.

16m3

16m4

16m1

16m716m8

16m5


Max Short Equities

A reversal in equities at the right time, right place. The closes on the Dow peaked at Friday’s full moon suggesting an inversion may well have occurred. A big up day yesterday for commodities, including 10% gains in natural gas and coffee. US economic surprises slipped below zero as data once again disappointed, and rising input prices (commodities) are, in line with history, threatening to tip an already weakening economy over as 2014 progresses. A significant geomagnetic storm played out yesterday, with another one in progress at the time of writing, and the timing of these disturbances is notable.

I believe yesterday will turn out to be the spot for optimal maximum short equities. Maybe you disagree with the timing, but if you have been a reader of my posts for the last couple of months then you will know I am acting on a multi-angled, multi-layered case. Maybe you disagree with being short at all, but having done a little tally I have published about 50 different indicators since the turn of the year which all individually suggest a shorting opportunity in equities is at hand (either for multi-week, multi-month or multi-year gains), and collectively produce something compelling. Whilst it would be unwise to rely on any one indicator as anomalies can and do occur, I feel pretty confident with fifty. If my specific timing of the optimal shorting point turns out wrong, then that aggregate of indicators calls for that spot being near both in time and price. Until disproven I have now two specific calls: (1) Stock market topped 31 Dec 2013 (Dow, SP500 (double top) and Nikkei) and (2) Optimal shorting opportunity (peak of the second chance) was 19 Feb 2014. A reminder: I am not an advisory service and I am short equities, long commodities.

Click on the two charts to view larger:

20fe1

20fe2

History In The Making

1. Crestmont P/E valuation only exceeded at 1929 peak and in 2000:

18fe1

2. CAPE / Shiller PE / PE10 valuation only exceeded in 1901, 1929 and 2000:

18fe2

3. Compound annual growth rate since 2009 bull start only exceeded into 1929, 1937, 1987 and 2000 peaks:

18fe10

4. Q ratio valuation at major historic peak levels, barring 2000 outlier:

18fe4

5. Stock market capitalisation to GDP from Fed data second highest in history:

18fe5

6. Stock market capitalisation to GDP based on Wiltshire 5000 (the broadest and most comprehensive US index) equal highest in history with 2000:

18fe6

7. Margin debt as a percentage of GDP joint highest in history with 2000 (and net investor credit at all time low):

18fe8 18fe7

8. US household equities exposure at level of previous major peaks, barring 2000 outlier:

18fe139. Skew readings cluster highest ever:

18fe26

10. Panic/Euphoria second highest ever euphoria after 2000:

18fe1211. Highest ever Investors Intelligence bull-bear sentiment spread:

18fe11

12. Sunspot, geomagnetism and lunar phase potential historic convergence:

18fe25

Solar maxima deliver speculative peaks but as these peaks in the sun’s activity occur only around every 11 years, we see cyclical market peaks in between. More often than not markets peak in the seasonal (inverted geomagnetism) highs around December and July, and within the month they typically fall close to new moons. If the Dow peaked 31 Dec 2013, the closest parallels as highlighted in the table are 1980 gold and 1989 Nikkei. Both these were secular peaks occuring at a solar maximum, at the turn of the year and close to a new moon. The Nikkei is particularly pertinent as it peaked on the last trading day of the year and led Japan into a period of deflation, which I believe awaits the US now. US deflationary recessionary demographics should break the Dow out of a very long secular run that has been in place from the 1940s to now.

If the Dow and Nikkei did not peak on 31 Dec 2013, then the next new moon would be 1 March 2014, by which those indices would need to be at new highs. However, by that point we have moved into the (geomag-inverted) seasonal lows, and, based on current solar forecasts, gradually away from the solar maximum. The caveat to that latter point is if solar forecasts are wrong and we see a stronger sun in the weeks or even months ahead, making for a higher cluster of sunspot spikes. We might then look to the next seasonal high period of June-August and future new moons in looking at top-timing probabilities (note probabilities, as the table shows exceptions). However, the stronger case is for the 31 Dec 2013 top, and the evidence that has built up since then is supportive, including January spikes in trading volume and insider selling, 2014 money flows into treasuries, gold and defensive sectors and a downtrend in economic surprises. The last piece of the puzzle is for price to now confirm, with the Dow rolling over again this week, and in doing so adding a lower high to the Jan/Feb lower low, marking a trend change. Prices on the US indices hit technical targets on Friday, and volume for the rally remained divergent, setting up that roll over potential. We had a geomagnetic storm for the second weekend in a row too. However, we are clearly very delicately poised: either a definitive bullish breakout (with bullish internals) from here postpones a market top into the future, or we are at the top of the ‘second chance’ and staring at a major bearish opportunity.