
The potential post-second-chance positioning was negated as the rally since the 8th August gained momentum, albeit out of hours momentum. So the question is whether this rally now produces the failure high second chance peak, i.e. a lower peak than July, and thereafter we tumble into the bear-controlled post-second-chance market.
Whilst the Nasdaq has made a marginal higher high, the RUT, DJIA and European indices are some way from their peaks and as we reach increasingly overbought here, the odds favour those indices turning down again to cement lower highs. Plus, the Nasdaq has made the higher high on negative divergences, making the potential to become a fake out. If that is to occur, and with the SP500 not far from its July peak again, a renewed move to downside has to happen fairly promptly. With the new moon several days away providing such a potential peak (an optimism peak), that now becomes my most probable case: markets topping by the end of this week, making a lower peak to July on the majority of indices, and a critical lower high / failure high.
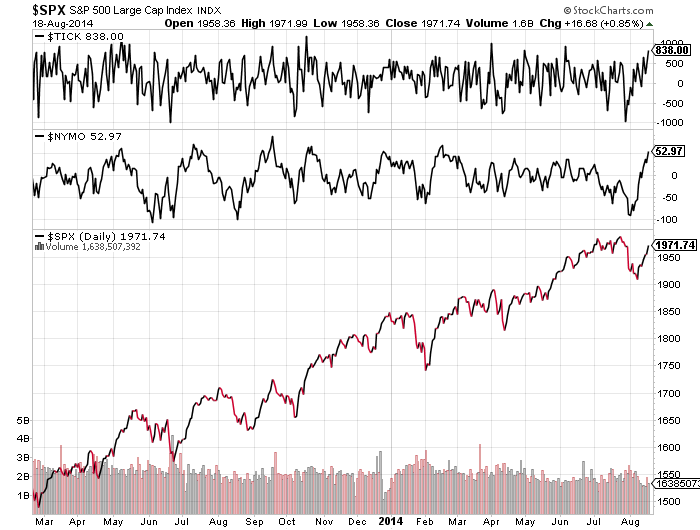
Tick and Nymo amongst those indicators showing overbought:
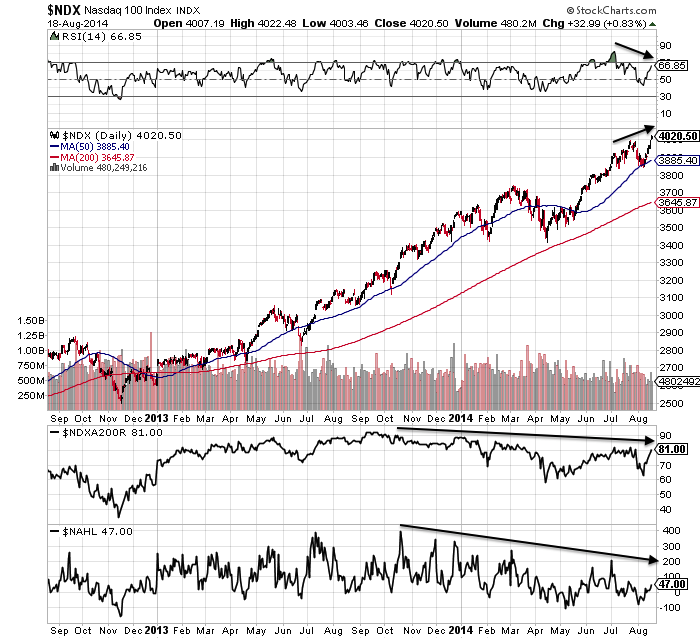
Nasdaq 100 negative divergences in place since late 2013, plus short term RSI divergence:
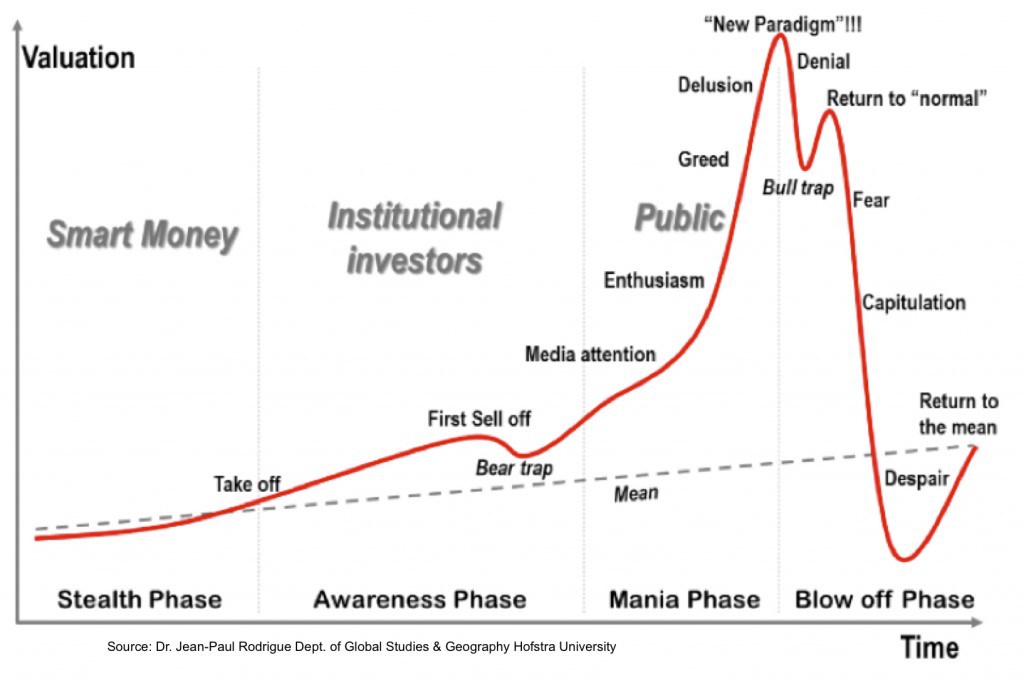
R2K, SOCL and IBB still peaked Feb/Mar but need to turn down soon to maintain the lower high / failure high patterns. A look at IBB shows the typical bubble model has played out and the short term RSI divergence shows the potential for another leg down. If that does occur, then it should be the major bear leg down. However, the recent rally has made the turn-down fairly urgent.

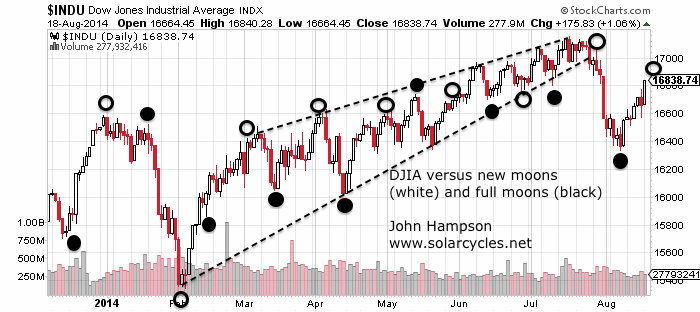
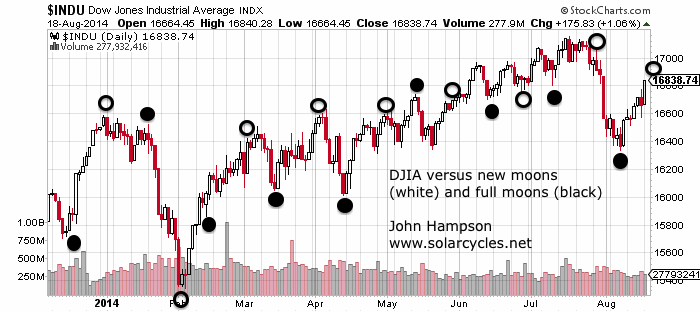
 The Dow versus lunar phase oscillation shows the potential for a peak around the new moon of August 25th, which would also likely be a lower high, adding to the case of the late-July breakdown:

The bigger picture argues that a major peak in equities is in, and if not in, then overdue. Ten different angles on a stock market peak produce a cross-referenced case:
1. HYG:TLT divergence at major peaks:
Source: InflatedTemper
2. Implied correlation at major peaks:

Source: Rory Handyside
3. Skew at major peaks:

Source: Rory Handyside
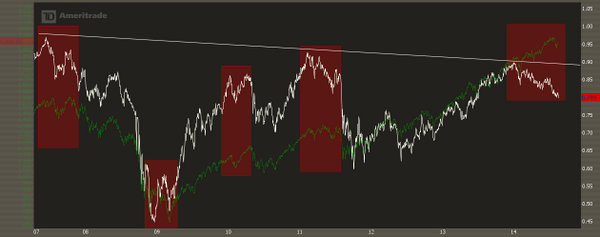
4. Sentiment at major peaks: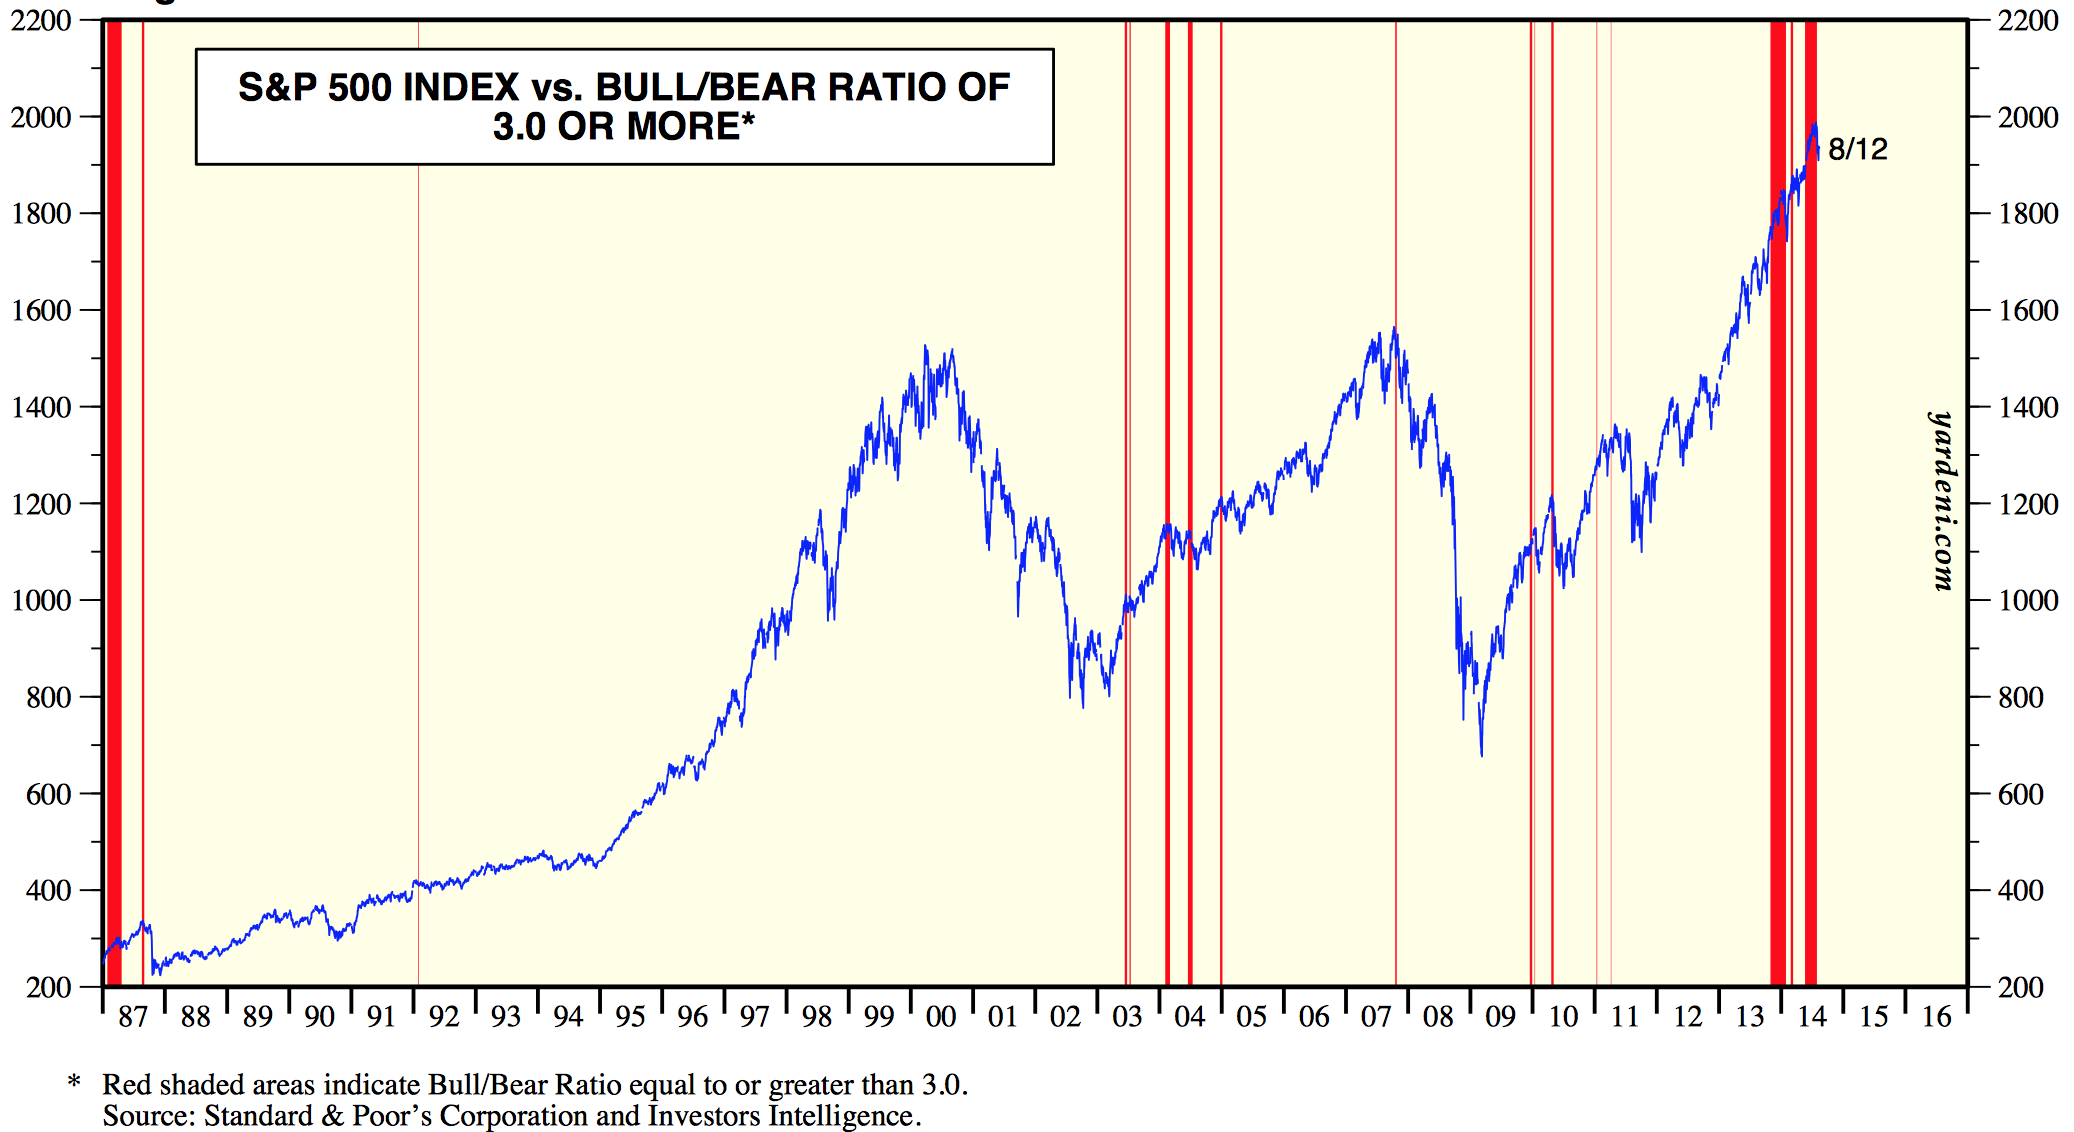
Source: Ed Yardeni
5. Valuations at major peaks:

Source: DShort
6. Sornette bubble end flagged at the start of July:
Source: Financial Crisis Observatory
7. Various risk measures peaked, along with the Nikkei, at the turn of the year:

8. Rydex allocations echo the 2000 peak:

9. Sector rotation shows the two post-peak sectors of health care and utilities performing strongly relative to others:
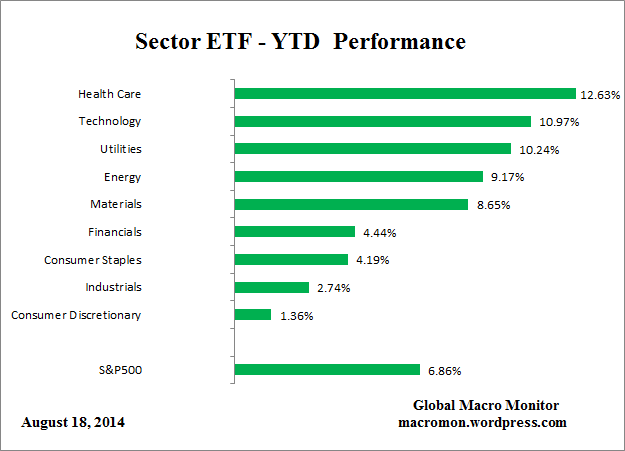
Source: Macromon
10 Sunspots continue to be in a waning trend since their February peak, and a smoothed solar maximum of Feb/Mar ties in with margin debt and hot sector/index peaks of Feb/Mar as the speculation peak epicentre:

To sum up, I am looking for European indices, RUT, SP500 and DJIA to make lower highs / failure highs / second chance peaks by the end of this week around the new moon, and thereafter break downwards into post-bubble-pop momentum, into the geomagnetic seasonal low of October. Past analogs show hard falls lasted up to 8 weeks, which ties in with the available window from late August into late October. The mulit-angled case is still strong for a major peak not just being at hand but being in already, and the out-of-hours, low volume nature of this rally since 8th August add to the likelihood of it failing and cementing the broad July final peak in risk, in a topping process that began at the turn of the year.

About tidal forecasts and harmonic stations.
Harmonic stations do a lot of calculating to get a prediction. What I found is that when you look at 2 stations close to each other – so they both feel the same gravitational pull – they still can give different predictions. There can be only one explanation for this : the harmonic calculations create differences.
From now on I use 2 stations : Sandy Hook and Reedy Point, both near the eastern coast of the US and relatively close to Wall street and close to each other.
My reasoning is simple : when 2 systems can give different results, confirmation becomes valuable. Funny thing is they both give great timing and it seems that combining them gives a more complete analysis.
Anyway; both point to a high today and then a low on friday. Both also point to a low around September 10th, before we see some recovery. Last Friday SH gave a high and RP gave a low. So what did we get? A high and a low.
This is a new analysis but I think this is more robust. My overall expectations remain the same (sorry, Daniel).
André
I am with you Andre.
Nicola
25/26 Aug. 4 Sep 😉
Or as early as Friday 22nd August. But wont be a major high.
obviously no high on Tuesday…how have you chg’d your view since Andre? tia.
As John says, we need to see an imminent downturn here:
http://quantifiableedges.com/spx-performance-after-a-persistently-oversold-vxo/
Who owns the air we breathe? In an urbanised world there is no self sufficiency. Money is life’s energy – and who owns the money? Those that manufacture it!
Bankers own industry, the Politicians, all of us. If they can completely fabricate a long market they can surely decide when to cash it in. Do fundamentals matter any more when we have worldwide totalitarian financial dictatorship? When I see this outrageous equity bubble created out of nothing – no jobs, no recovery, no GDP growth, no consumer inflation, how can I not ask this question. Am I crazy ? You tell me, because I feel more and more that I need tablets.
I don’t think that the crude and sociopathic bankers and leaders we have nowadays are the sort to voluntarily “cash in” anything. They don’t want to merely make a profit; they don’t want to just get rich – they passionately want to extract as many pennies from as many people as possible.
I would only call you “crazy” if you leave your wealth in their custody!
Where to put it though? Try stashing a few ounces of silver or gold in your wardrobe, and you risk the police smashing down your door – and shooting your dog.
Mark, unfortunately psychopaths have been given way too much in terms of power.
The evidence of this is quite clear, the fact is that psychopaths are very much in control and in positions that are shaping our world.
At least one psychiatrist has attempted to alert the world of the dangers of what he terms “a sub species”.
I know this sounds harsh, but these peoke have absolutely ZERO empathy whatsoever and their only goal is to better themselves at any cost. They lack a particular gene which is why he terms them a sub-species.
They have been allowed to infiltrate politics, industry, military and banking at the highest levels.
They ARE a very real threat to society.
Still waiting for credit spreads to widen:
http://seekingalpha.com/article/2434215-citi-beware-rising-high-yield-spreads
It looks S&P is headed for 2010-2030 range as Nas100 is leading this final attempt on weak internals. If that happens then my favorite scenario is drop to February lows (S&P 1750) in September-October and then last rally with final top forming in Jan or Mar 2015. Triple top, as you would say.
Gold must rally now to confirm its recovery to target in 1480-1520 zone
Broadly in agreement with that. Except i think there is room to dip lower than Feb lows though. Lot of long stops will be there at the time. Ripe to be stopped out. Prefer the idea of the bull finally ending Mar 2015. Shallow bear market from there (30%) then resume the secular bull that started last year.
thanks John. Very good analysis. Usd/yen also running out of space here at 102.78 which should also support the bear case. Biotech at important 2800 resistance in Nbi which was the first support on the first leg down in March. Failure here should be very bearish. Follow 2 possible double tops targeting 2300 and 1470 respectively. Cheers.
Was having a closer look at the RUT. It doesnt look to be in an uptrend but it actually is. Bears should have brought price below the last swing low at 1080ish. We had a higher high in June compared with April. Bears will need to stop RUT from making a new high otherwise price may just continue to consolidate in a range before moving significantly higher. Although i prefer a test of 1000 some point in next couple of months.
http://stockcharts.com/h-sc/ui?s=$SPX&p=D&b=5&g=0&id=p79795269581&a=238001958&r=1408455988604&cmd=print
http://stockcharts.com/h-sc/ui?s=$SPX&p=W&yr=6&mn=6&dy=0&id=p43035655412&a=297383782&r=1408455991557&cmd=print
http://stockcharts.com/h-sc/ui?s=$SPX&p=M&b=5&g=0&id=p71828158933&a=212096943&r=1408456047302&cmd=print
I don’t know much about sunspots but i keep my eyes and ears open.
This source says:
Austin, August 16, 2014 – A rare spotless day on the sun on July 17-18, 2014 triggered public speculation that an already stunted Cycle 24 was nearly over. Such is not the case. Defying the odds for so late in a sunspot cycle, another solar sunspot maximum was set last month. Another one is coming this month.
http://wattsupwiththat.com/2014/08/19/revising-the-sunspot-number/#more-114624
I don’t like the implications for my expected october stock market crash
Sunspots were slightly up in July versus June, but in an overall waning trend since Feb. See the dots here:
http://www.swpc.noaa.gov/SolarCycle/
So far this month that waning trend is being continued.
John,
So IF we do not have a trend change by the end of the week, after all we have Fed/Yellen/Draghi this week, what is your strategy then? Do you close shorts and go to cash, or go long or hunker down and wait with shorts for as long as it takes?
Staying short. As per the second half of the post, the case is for the peak being through or at hand.
Thank you John for your prompt reply. That picture looks pretty straightforward.
i know financial markets pretty well, not astronomical influences.
John,
The number of spots in the table on that site goes down into 2019. Does that mean you expect a bearmarket of at least 5 years?
A longer bear market would seem appropriate under deflation, and would echo Japan post 1989 and Dow from the 1937 top:

Would certainly fit the 4,6 year lunar cycle that turns in November,
Fantastic work here as I also keep a close eye on solar / lunar activity ( all be it with other interests in mind ).
From a straight up currency perspective one can also throw The Australian Dollar on top of the pile, with it’s trading generally associated with “risk on”.
I’ve got pretty blatant rejection here as of this morning, also in line with The Nikkei as well SP 500 corrective waves now complete around these levels.
Just another angle to consider…..falling directly in line with the analysis here ie…..lower highs and continued movements lower in global appetite for risk.
Great site….great information. I hope I can contribute with complementary information / views.
Thanks
FK, great observation and one regularly overlooked. The relationship between the SPX and AUD is extremely significant.
Thank you for reminding us.
Can someone post the most up to date US Bloomberg CItI Surprise Index.
Thanks John
AUD has traded flat for several months as the general “retail distribution” of equities has played out over the first half of 2014.
Seeing the cracks over time, and now the pretty much “confirmed” show of hand / directional move lower in AUD should lends credence to the analysis here.
A different market…another angle….also confirming “macro perspective” and supporting the ideas here.
I expect short AUD/JPY to be one of the largest and most profitable trades moving forward here at levels around 96.00.
The top was “indeed in” in “global risk” many months ago….now finally seeing the other side of the mountain.
Looking for a close at SPX1987 today
Wont be getting that 1987 close tonight. Should be tomorrow though after the Fed minutes.
Two arguments put forward by bears:
1. distribution from professionals to retail
2. most buying in in the after-hours furures market
Is that how retail/mom and pop/”dumb money” normally piles into the stock markets? By buying futures after out of hours?
# 2 is what the psychopaths that control the show do. BTW it is estimated that only about 3% of the population are psychopaths and sociopaths and they tend to gravitate towards politics and Wall Street, where their parasitic characteristics and narcissism can be best put to use. Also, there is a brain defect with these folks. Evidently certain parts of the frontal lobe and side lobes of the brain are undeveloped, so they can’t be reformed. They just need to be found and tossed out.
so stop voting for them, working for them, ACTING LIKE THEM…
Jay Gould – “I can pay one half of the working class to kill the other half.”
as long as Americans think it’s ok to get paid for building bombs that kill other peoples children or get paid to work for JPMorgan Chase, then nihilism it is forever until the earth throws our dead end asses off the planet.
it isnt the sociopaths that are the problem – it’s the idiot humans with evolutionary brain damage that accept as objective the society the sociopaths created.
blastoff
as I said yesterday I had all kinds of buy signals trigger yesterday – there are a number of warning signs that point to a very convincing bull trap here though…
What bull trap signs do you see?
$CPCE looks like 2011, nasdaq cum breadth is hugely divergent, bpspx is rolling over as is BPNYA (which is way below 70), $NAHL:$NATOT; an “almost” zweig breadth thrust that looks like a perfect bull fool magic trick…
oh, and the clear tops in many foreign markets that Mario Cart will try to repair with a sugarfree high…lol
ah and the various indicators like this (including hyg) that hint at the start of a new bear
http://stockcharts.com/h-sc/ui?s=JNK:TLT&p=W&yr=1&mn=6&dy=0&id=p58619751032&a=359935607&r=1408475374930&cmd=print
http://stockcharts.com/h-sc/ui?s=HYG:TLT&p=D&yr=7&mn=0&dy=0&id=p54392413859&a=360644868&r=1408480409877&cmd=print
Short-term observations: Open gap at SPX 1955 needs to be filled; VIX is somewhat divergent, recovering most of the decline today. If the market does indeed distribute the most pain possible, that would be a reversal now that bulls are complacent and many shorts have been forced to cover. Fed minutes and Jackson Hole offer the perfect excuse to sell the news….
http://mobile.nytimes.com/2014/08/17/upshot/the-mystery-of-lofty-elevations.html?smid=tw-share&_r=0&referrer=
Some interesting posts, would tend to see
Duncan and Burnell’s view as a more likely
outcome.
While you cannot discount John’s view,
the question remains where is the
single significant event/catalyst to
drive a sudden shift in sentiment.
I appreciate that a multitude of indicators
may be pointing to significantly
lower levels, however this has been the
case for a multi month period.
Earnings remain supportive, for now.
http://www.bloomberg.com/quote/BDIY:IND/chart
http://armstrongeconomics.com/2014/08/19/us-share-market-correction-over-or-posturing/
MA’s computers nailed the directional change but warns of another (directional change) next week. That would be down into October.
http://streettalklive.com/index.php/component/flexicontent/2-the-daily-x-change/2263-could-stocks-melt-up.html
If we get the much needed correction this fall, I could certainly see the melt up into the 3rd year Prez cycle, where everything blows off in spectacular fashion to the end of this bull market.
Currency markets suggest a “fake out/false break out” in USD here as ( counter intuitive as it may seem ) with EU related currencies almost reaching capitulation type levels.
For those who consider that “curreny markets lead” ( as you can’t buy an asset without first converting currency ) a close eye on the currency pair USD/JPY is needed.
Yen is the fire to this rally…as it’s printing / conversion to USD continues to fuel purchases in U.S denomintated assets ( hence we see USD rise ALONG with U.S Equity prices rise ).
This will soon come to an “abrubt end” as equities are sold and the funding currency (JPY) is repatriated.
One has to just ignore the silly “ramp” in U.S Equities as by way of this simple market mechanic and just keep your eye on the larger picture.
The sun/Japan/JPY fuel injection very soon to come to an end.
just a note about DOW theory – if we close below the Aug 7th low at 16333 then a bear market is signaled…
John, something to consider – this chart was produced on 30 July 2014. The Baltic Dry Index is up by 38% during the last three weeks.
True, but only to 1040, or sub 0.5% on the right axis.
John, I dont really follow the Baltic dry index but from what I can see it went down Jan ’10 to Jan ’12 and stock market went up. Are current developments bad for stocks?
I was looking for a world trade proxy to get a measure of the global economy
Thanks
Since we are not in company reporting season the emphasis is back on macro news. The current problem is that the US Citi Economic Surprise Index is still negative: therefore, there is little room for disappointment – economist are already pessimistic..(see above)
Good point Will. I do however think the coming correction will be triggered by sentiment specifically Russia. Notice how serious declines came from the downing of the passenger plane and the incident last week.
I was just going over the tape on the 15 min and 1 hr charts for the SPX and I gotta say to sum up the last few sessions in a word…..BIZARRE.
The only other words that spring to mind are, miraculous and levitation.
This absolutely wreaks of a staged rally. Another word springs to mind SUSPECT!
Markets have been manipulated for centuries and they will continue to be. Rich get richer and poor get poorer. Infact QE is probably the worst theft from poor to rich in history.
Here’s another word as well: “bots”.
USD/JPY again turned down at the top of it’s long standing range as a gauge for risk in general. It can’t break out of the range and as Nikkei has now “swung high” on the daily, everything from a currency perspective is still “another day” in direct line with the analysis here.
Looking at a “lower high” here in Nikkei and subsequent turn lower in global appetite for risk.
If it helps at all.
Cheers all.
looks like a bearish retest of the rising trend line from the 2013 triangle which the pair broke through a couple of months ago. Should help the broader markets to unravel shortly.
You’ve got it.
Great look at things. Great perspective.
Don’t let these little ” retail squiggles” throw u off the big picture.
USD/JPY can’t get past this range – period.
Due to recent developments im closing out my long in full here.
Confused…how come?
Price still looks bullish.
The most sad thing was it only took bull 8 days to recoup most of the loss.
ducan smith said: “Ive added a small long to my exisiting long positions. With R2K getting above the 200sma and NDX going to new yearly highs I think the uptrend is still on target for SPX2000+”
Still seems like a good call right now, with SPX at new closing highs if it closes here…
Thanks John. Personal reasons mean I cant monitor markets closely for a while. Hence, closed my longs.
94% correlation to 1929…http://www.mrci.com/special/wspi29.php
Got to be careful with correlations measured using nonstationary data.
Agreed! In 1996 we have 98% correlation and markets keeps trucking higher. http://www.mrci.com/special/wspi96.php….but nontheless it’s an interesting observation but nothing I would put a bet on (right now). But considering to where we are right now in the markets my hunch is that it will be more likely to follow the 1929 scenario in form with what Johns analysis has been supporting.
A striking correlation!
Another similarity is that September 1929 was month 72 of SC16 (a weak solar cycle, similar so far to SC24). September 2014 will be month 70 of SC24.
Very close (but the other previous weak cycles indicate a stocks peak and crash could be later rather than sooner).
Is this one of those nonsensical buy the rumor sell the news rallies?
Recently, it is buy any news type of market because both good and bad news are good. It will change one day, but I am not interested in getting that one day anymore. Probably better to get in on day two.
That’s ridiculous, with Europe drop more 10%+ from top while still below its 200 sma and US just drop 4% plus today we almost recoup all of the loss.
Sigh. But price is price, very high chance we break the previous top.
Yes apple, this is surrealistic.
When this bubble finally burst, all the world will suffer. I hope US citizens will kill the FED members.
The FEd is a toxic Institution.
Jordi – are you some kind of Muslim extremists? As much as we disapprove of the Fed, civilized Americans don’t be behave that way.
you are an NSA troll in fear of the GUILLOTINE! lol
The FED will realise their errors in the end. They are using their most powerful and final weapon as the moment so the current market strength may carry on longer than expected. Personally I would like to see inflation go out of control so prevent such policies being used again.
as long as money is actually debt secured by labor then the fed will continue to siphon off excess productivity to protect the oligarchy – the silliest notion in all human kin is that institutions were ever created to benefit the people…
you all live in a cage and call it society
No I’m not a muslim, I’m a worried Christian because the FED’s foolish policies are going to put all of us in a serious depression.
Need to chill people.
That said. The hourly charts are the most ovebought in over 12 months. You gotta hand it to the bulls, they have completely annihilated the bears.
The Q’s hasn’t touched it’s 50 wma for 20 months! I haven’t checked but that has got to be getting close to record territory.
Aside from the hiccup last Friday if you look at the rise off the August lows it’s quite frankly unbelievable. And in no small way thanks to AAPL.
install a guillotine in the Capital Rotunda and then see if term limits and accountability ensue!
better – just outlaw anything BUT FREE ASSOCIATION
I disapprove of killing anyone.
But I’m sure regardless of faith or race 99.9% of the worlds population that will suffer or are suffering will hunt down the 0.1% that benefited creating this mess and deal with them in a civilised manor.
(I hope for their sake)
Still waiting for that 2000+ on the SPX if it happens. Next week the market could look very different, up or down?
I can see another 7% rally from here, just like the parabolic move we got in the last 2 weeks of 1929. Why not right? Any reason the bears have can be fudged for another 2 weeks, and yet if the rally happens, we know that we will have a lot of capitulation and short covering. The market moves to hurt the most people.
People always like to talk about these moves as if they are in some way more extreme than in the past. They are no more extreme than at any other time in my career. For instance these moves are no more mad than 1986….a similar type of year.
If it was easy to read then everyone would be rich from it when in fact the vast majority of people lose money in the stock market. Sadly they kid themselves that they can read the runes……even when they have run out of cash.
They spend all their time saying how mad and ridiculous it is and blaming others including the FED.
In my experience those who make money don’t blame anyone else – why would they?
Well said Will … only price pays. People can try and find a million reasons for why price shouldn’t be where it is. Markets are manipulated and the sooner a trader accepts this and blocks out the noise they will succeed.
Well I have been around long enough to know tatt this time is unprecedented in history.
Show me any other time in history where the Fed has held interest rates so artificially low for so long?
Show me another period of time when corporate buy backs were at such an extreme?
Another time when margin debt was at the extremes reached recently?
Another time when so many indicators were at such extremes?
Yes there hae been periods when the market has showed strength and speculation in some sectors beyond belief. Let us not forget the dot com bubble.
However I can never remember a time in history when the speculation was spread across so many sectors. Everything from art to real estate to shares to bonds, including junk.
Will, with all due respect WHO is rsponsible for that if not the Fed?
Surely they are the ones that have made it possible for such extremes to be reached? Nobody else is controlling the spigot!
Let us not forget who laid the foundations for the dot com bubble following LTCM and the Asian currency crisid and after that the real estate bubble and now this, the greatest bubble in history, one that spans across all sectors of finance and society and one that will, as in bubbles past, ultimately end with disastrous results.
Only ts will be the colkapse of all collapses.
Ultimately speculators will do what speculators do, but the Fed NOBODY ELSE has irresponsibly provided the dynamite and the matches to blow up the whole damn mine!
I said yesterday that i was expecting 1987 today. We got that today. Same playbook will repeat … Bears will be back tomorrow … they will give up their gains by days end.
As stated earlier due to personal reasons i cant monitor markets closely so I closed all my longs at 1980 today.
Sorry, I missed that. Got it…
Great call.
Thanks. Bears wont give up SPX2000 easily but they will in coming weeks.
Hi
could you please kindly share what makes you think current look likes 1987? If reference 1987 analog, they have a close high on Aug 25 and extreme high on Aug 26
oh sorry just realize i mis read your comment
you mean your target was 1987…
but what makes you think tomorrow will back down?
Wow. A lot of bears already turned bulls recently. That makes it even a stronger case for the imminent bear market. 🙂
I think John’s work and his timing this time is just superb. The markets are just weeks away from a major correction to say the least, or at best a historic crash. We all can check back John’s past articles at the end of September to see how superbly accurate he is. I personally am a strong follower of John’s solar cycles approach. I have been studying EW and following several stock gurus for a number of years, but I have to say John’s work is the most accomplished and intrigued.
Below is an excerpt from David Hunter, CFA article called ” A Bear Market has begun”. Great read if you are interested in a contrarian’s contrarian’s view. So don’t expect to agree with everything he wrote. For instance, David expects deflation, not inflation, to spark the next crisis and wreck the stock market.
I believe the liquidation of exchange-traded funds (ETFs) will play a defining role in the bear market of 2014.
ETFs have not been battle tested. While they did exist in 2008, their aggregate size today is more than four times what it was back then. If we get a sharp unwinding in the equity markets, investors who have built ETF positions over the last few years may decide to exit en masse.
A rush to the exits would, of course, hurt the market value of the ETFs themselves. But more importantly, it would force ETF managers to sell holdings to meet the liquidations. I think that could exacerbate the coming bear market and turn it into a historic crash.
Recent action in the high-yield bond market may have given us a preview. Due to large and concentrated outflows from high-yield bond funds, managers were forced to liquidate some of their bonds. When they tried to sell, these managers discovered that the bonds were not as liquid as they thought, because sellers outnumbered buyers. This occurred with only a four percent decline in the junk ETFs. Imagine the impact during a sharper bear market selloff. A herd of investors would stampede for the exits, and the impact on prices could be epic.
A Bear Market Has Begun
By David Hunter, CFA
08/20/2014
I know, the definition of a bear market is one that has declined by twenty percent or more, and we’re only down about 4% today. That’s hardly a bear market. But I think we’ve seen the highs for this market cycle and are now heading for a decline far greater than twenty percent.
The stock market has not experienced a 10% correction in over two years. Each small correction has been quickly followed by a move to new highs. So it’s not surprising that most investors are viewing the current correction as another buying opportunity in a secular bull market—one that they believe has a long way to run.
The Wall Street consensus view is that the economy is gaining traction and will sustain its momentum even when the current monetary stimulus program ends in October. The general expectation is that interest rates will rise a bit from current levels but still remain relatively low well into the future. As the thinking goes, this steady-growth and low-interest-rate environment should be supportive of higher equity prices for a long time.
In other words, most investors believe that a bear market is nowhere in sight.
Needless to say, this contrarian completely disagrees with that consensus view. Not only am I suggesting that a bear market is near, but that the bear market is already underway.
Geopolitics as a Trigger
Despite rather widespread complacency among investors, there are plenty of things to be concerned about. Certainly, the geopolitical landscape is full of potential risks that could prove disruptive to the capital markets. It’s not just Ukraine. It’s Iraq, Syria, Gaza, Libya, and the tensions in the South China Sea. And of course the Ebola virus outbreak. Many pundits assume recent market weakness is primarily due to geopolitical headlines.
No doubt events in Ukraine and the Middle East have played a role in the sell-off. But I think the market may also be starting to price in an economic downturn—one that could be triggered by all of this geopolitical turmoil. The global economy is leveraged and fragile and has little tolerance for adversity. Any interruption of the flow of gas into Europe, for example, would be very disruptive to the Eurozone economy. And let’s not forget that much of Europe is already in or heading toward recession.
Japan and China remain concerning as well. Both are highly dependent on export markets for growth. A weakening Europe or less spending by US consumers would be problematic for their economies, and for the global economy overall.
So it’s not necessarily war itself that the markets are worried about, but rather the impact that geopolitical turmoil could have on the world economy. It doesn’t take much to tip the balance when the economy is already struggling to sustain its growth.
The End of QE Matters
It may seem premature to be so bearish when most of the major indexes are just off their highs. But beneath the surface, a lot of damage has been done. It started in the spring when the two leading momentum groups of this cycle, social media and biotechnology, sold off sharply. Both have rebounded from their spring lows, but neither has regained its highs.
More recently, bank stocks broke down, as did building and construction stocks, along with housing stocks. They all broke through their respective 200-day moving averages. In addition, European stocks and junk bonds suffered important breaks. These are significant reversals. When combined with the recent rollover in industrial and semiconductor stocks, they suggest that cyclical risks are rising.
Sometimes we overcomplicate things in this business. We don’t have to look very far for the reason for the market’s loss of momentum. The Fed is winding down QE; it has reduced purchases from $85 billion/month to $25 billion/month and plans to eliminate purchases completely at its October meeting. The elimination of QE is a substantial reduction in liquidity at the margin.
Both the hawks and doves on the FOMC now seem to agree that the time is right to end this round of monetary stimulus. Wall Street supports the end of QE, too. A large majority of Wall Streeters has long been critical of the Fed’s aggressive monetary expansion. They are happy to see QE3 ending. Much of the Street’s criticism has centered on the fact that all of this money expansion, along with the zero-interest-rate policy, has led to a misallocation of resources and has pushed investors to take on too much risk. Inflation is also a big concern. The point is that we are finally seeing the Fed and Wall Street on the same page: they both agree that additional QE would be counterproductive.
Everyone seems more than ready to see this round of QE come to an end; almost no one (except me) is voicing any reservations. Fed officials and economists alike want desperately to believe that the economy can sustain its growth without the aid of QE. Ironically, the global economy may be closer to a deflationary contraction today than at any time in the last eighty years. Yet, due to misplaced concerns about inflation, almost no one is concerned that the Fed is about to terminate its monetary expansion program just when it is most needed.
Add to this the fact that Japan’s monetary expansion is more or less on hold and that China is attempting to rein in its aggressive credit expansion, and we may be setting up the perfect storm for a deflationary bust.
ETF Liquidation May Define the Coming Bear Market
Every bear market has a defining characteristic. In 1987, program trading led to a sharp sell-off. In 2000, the tech bubble burst. And of course in 2008, the credit bubble burst. I believe the liquidation of exchange-traded funds (ETFs) will play a defining role in the bear market of 2014.
ETFs have not been battle tested. While they did exist in 2008, their aggregate size today is more than four times what it was back then. If we get a sharp unwinding in the equity markets, investors who have built ETF positions over the last few years may decide to exit en masse.
A rush to the exits would, of course, hurt the market value of the ETFs themselves. But more importantly, it would force ETF managers to sell holdings to meet the liquidations. I think that could exacerbate the coming bear market and turn it into a historic crash.
Recent action in the high-yield bond market may have given us a preview. Due to large and concentrated outflows from high-yield bond funds, managers were forced to liquidate some of their bonds. When they tried to sell, these managers discovered that the bonds were not as liquid as they thought, because sellers outnumbered buyers. This occurred with only a four percent decline in the junk ETFs. Imagine the impact during a sharper bear market selloff. A herd of investors would stampede for the exits, and the impact on prices could be epic.
This Bear Market Will Be Different
When Wall Streeters list their concerns, they usually start with rising interest rates. That’s because almost every bear market in the post-WWII era was preceded by a sharp rise in interest rates, usually in response to an overheating economy. As a result, most investors assume they needn’t worry about a stock market top until rates begin to rise sharply.
The fact that rates are currently falling, not rising, is leading to a lot of complacency on the Street. Unfortunately, investors are relying on a model that doesn’t fit this cycle. This market cycle is not likely to end as a result of an overheated economy and higher interest rates. Rather, we are potentially facing the first deflationary contraction in the post-WWII era—one brought on by excessive debt and some significant policy mistakes.
The global economy is already slowing despite aggressive monetary stimulus and historically low interest rates. I think interest rates will move even lower, accompanied by a broad-based decline in stocks, both in the US and around the globe.
Amazingly, we are on the verge of a global deflationary downturn and what could be a historic bear market, yet Wall Street prognosticators remain focused on the inflationary risks of excessive monetary stimulus. Their focus could not be more wrong.
Anre’,
You have mentioned the 4.6 year lunar cycle. I have been trying to find some information on that cycle, but have not had much success. The closest I have come is that it could be 1/4 of the the lunar Nodal Cycle of 18.6 years, or even the 18 year Soras Cycle. Or do you base it on some of your independent observations of a Lunar cycle? I appreciate, and thanks in advance,
Steve
http://astropixels.com/ephemeris/moon/moonperap2001.html
Steve, this site has an apogee/perigee table for the 21st century. Simply take the average of apo/peri and look for multi year extremes. That’s were I find this cycle.
I do believe there is a 19 year cycle. 4 times 19 = 56, the Kondratieff cycle. And the sun has a 11 year cycle. 5 times 11 =55.
So every 55/56 years all the cycles turn in sync.
But the lunar cycles I use come simply from the apo/peri table. Not sure it’s 4.6 years every time, but I have to give it a name. You’ll find shorter cycle as well.
Cheers;
Sorry;
Need to rephrase that. 3 times 19 is 57; That’s the one I was looking for.
Still, 5 solar cyles, 3 lunar cycles and 1 Kondratieff cycle all point to 56 being a significant cycle.
André
Andre’,
Thanks for your feedback.
It might be useful to give consideration to the possibility that the 4.6 year cycle you have noticed is related to the 18.6 year Lunar Nodal Cycle (1/4 of that cycle). If true, then this would aid in judging time by using degrees of movement. One issue would be, is the eccentricity of this cycle uniform or highly elliptical. The more circular (less elliptical), the more we can look at a 1/4 revolution of the 360* passage without fear of being a substantial difference between degrees and calendar time. It appears that, regardless of where the measure begins in the cycle, there is generally less than one months difference (about 24 days) between 1/4 of 360* and 1/4 of 18.6 years.
You have mentioned that rather than using a low for the 4.6 Year Lunar Cycle of March 2009, it is better to view the low in 2010 as a cyclical start point. I have identified below 4 possible low points in 2010. To each low point I have added 90* (1/4 of the cycle) to Lunar Node longitude to determine a point in time:
February 8, 2010 gives August 20, 2014
June 7, 2010 gives January 30, 2015
July 1, 2010 gives February 1, 2015
August 27, 2010 gives February 21-28, 2015 (retrograde to direct and back).
The above dates may fun to watch.
An additional, and related, observation is that on the following dates the Sun and Node are at important aspects (90*, 180*, 120*):
July 15-16, 2014
October 11-12, 2014
January 5, 2015
February 1, 2015
March 30-31, 2015
Steve
Thanks John. Strictly looking at the pattern, it said a new high was possible/likely in SP.
It says up to low-mid 1990’s spx then a small retracement, then one more leg up that should go over 2000. That should be the final leg according to the pattern.
The leg down measured to 1903-1904 spx in a wave 4, and it stopped just above that level.
This was the jest of my last comment several weeks ago. The pattern doesn’t always get it right and the indicators don’t always get it right. But when combined together ( and we add astro turn dates), we can sometimes pinpoint it a lot closer.
Thanks all
SP500 trailing PE is trading slightly below 18X now, its not cheap, but historically 20 – 22X happens a lot, in particular the FED is not going to raise rate for another 12 months. 20X is +10% higher from this level, thats +2200, 22X is +20% higher from this level, thats +2400.
I enjoy reading John’s research, I wonder if there is any correlation he follows that tracks sun spot activities against economic time series, or overall market valuation time series? Maybe that can provide better read than just the market indices?
Recessions and unemployment correlate with solar cycles. Will cover them again in a future post.
Thanks John. Hope to see your prediction come true soon.
Thanks John but Draghi made all thing changed. With his QE all Eu stocks jump high so be careful, SP could go higher as well on this NFP Sep 5