All Round Update

I’m back. Here’s an updated look at the main pillars of my work.

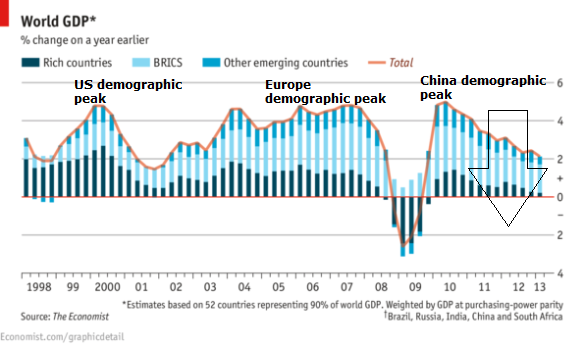
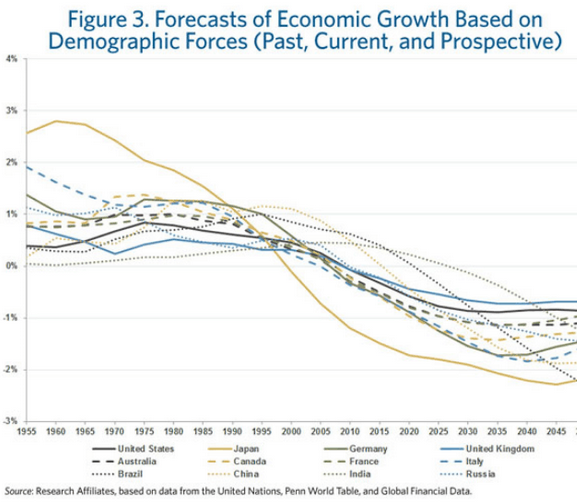
First, demographics. The key overarching macro issue going forward, in my view, is whether the combined price-deflationary and asset-deflationary demographic trends now in place between US, Europe and China will tip the world into recession and deflation despite the best efforts of central banks. Someone else has picked up on the theme and produced this:

1aug1Source: Nakedcapitalism

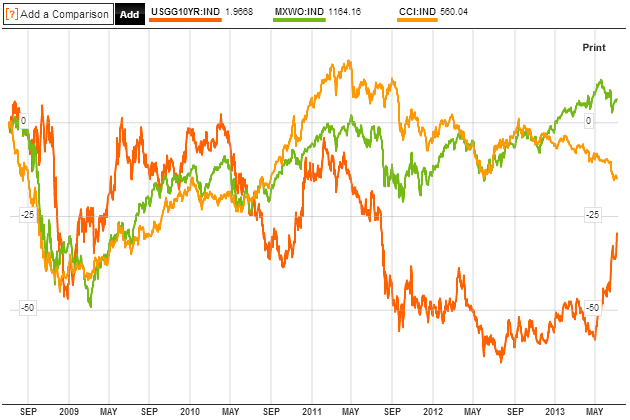
I continue to look at leading indicators for evidence. There is no doubt central banks have some impact on behaviour in the economy and financial markets by deploying policies to discourage savings, cash and fixed income, and to encourage lending, risk-assets investment and spending. But is it enough to offset the demographics?

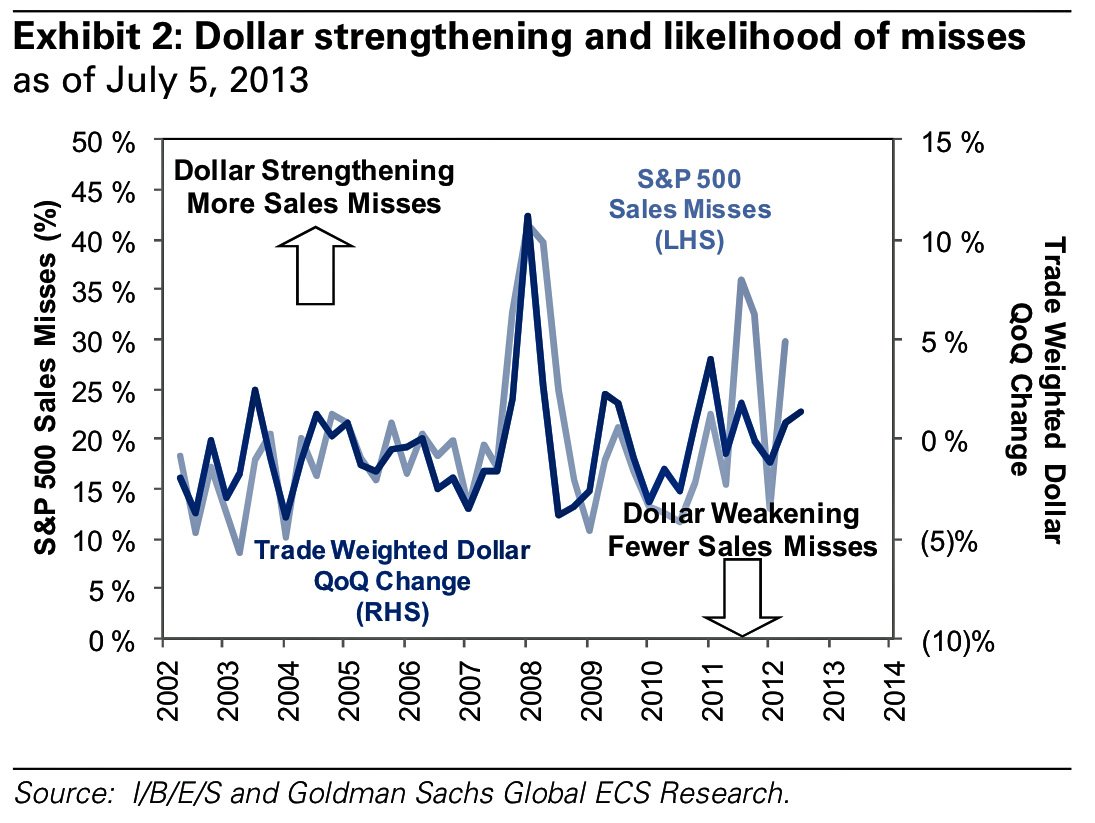
The latest data shows Europe strengthening (PMIs, economic surprises), USA possibly having peaked (ECRI, economic surprises), and the overall global economy potentially weakening towards late 2013 but not until then (narrow real money). This week’s US GDP release surprised to the upside for last quarter, however the upside surprise matched the retrospective reduction in the previous quarter’s data. Nonetheless, the overall global picture is still fairly ‘safe’. Europe’s relative strength ahead should bode well for the Euro v USD, and a relatively weakening USD should bode well for commodities, and if we are to see the normal late cyclical outperformance in commodities (once stocks peak) then we need leading indicators to at least hold up a little longer.

If the unprecedented coming together of demographic downtrends in US, China and Europe mean the global economy is heading for recession no matter what (given China has now peaked demographically), then I believe this will mean a severe nominal decline in equities, as central banks will be revealed as impotent, and panic will ensue. If we slip into global recession without the ‘agent’ of commodity price acceleration then I would expect the SP500 to complete an overall megaphone formation since 2000 with a potentially lower low than 2009.

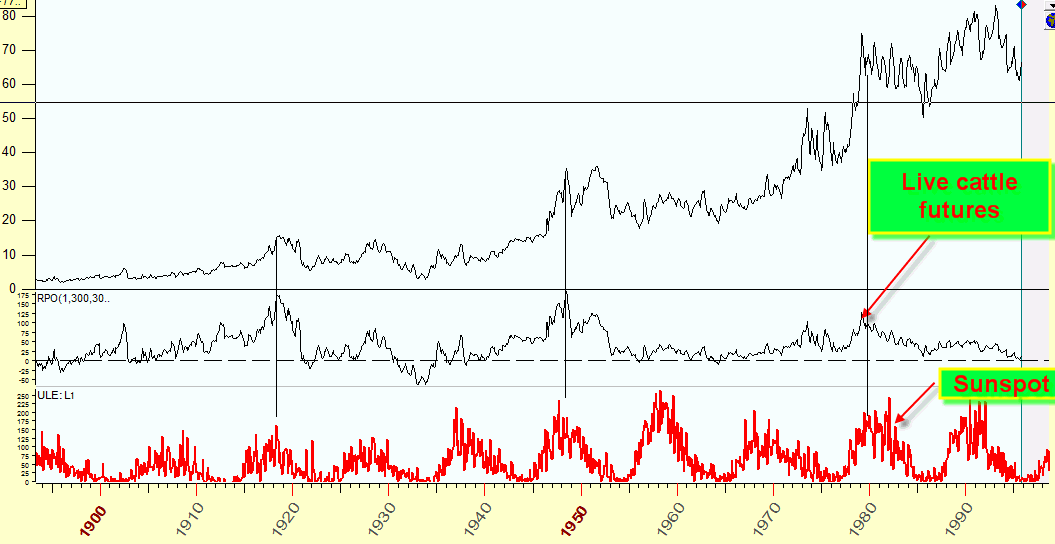
Next, solar cycles. Experts still don’t know if a solar peak is ahead or behind. Here’s the latest sunspot chart:

A2

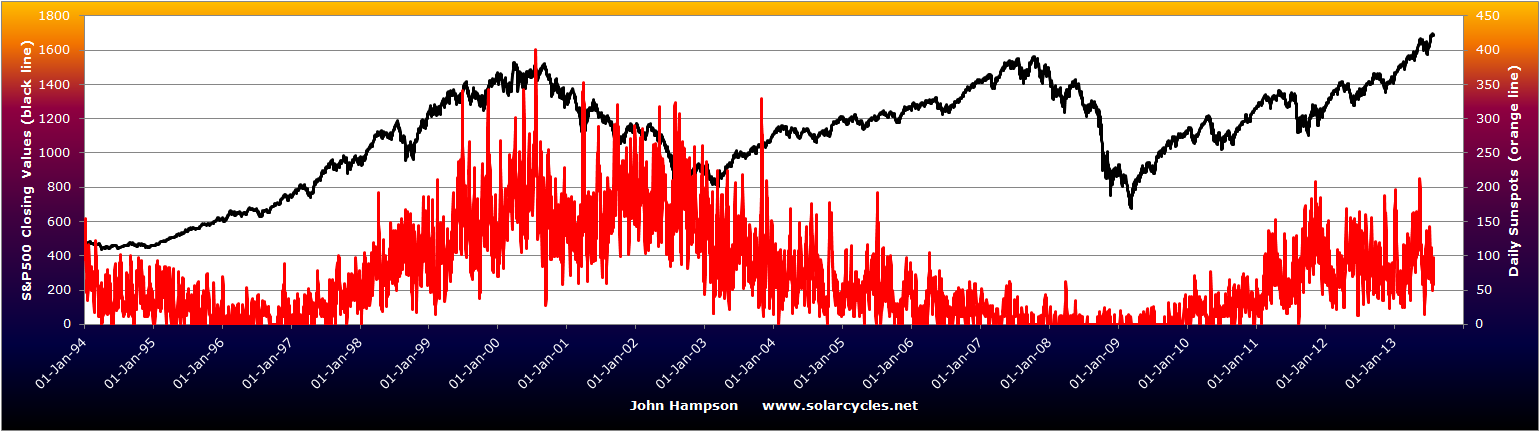
It’s clearly a weak sunspot cycle, and fairly messy. Some scientists believe there is a second peak ahead this year, which may exceed the existing smoothed max (Feb 2012). On the other hand, an overlay of SC5 suggests that existing peak may have been it:

1aug2Source: WattsUpWithThat

If the peak was Feb 2012, then I would point to 2011’s commodities speculation including a silver parabolic together with extensive Arab revolutions as normal behaviour patterns associated with solar maxima. It should mean that we have passed the speculative peak in commodities, that global temperature may have already peaked, and that we should expect the geomagnetic disturbance peak that follows a solar max normally 1-3 years later and is associated with recession. In this scenario I would expect commodities to continue overall weakness and deflationary recession to occur.

If the peak is still ahead later this year then we may see global temperature hitting extremes and more geopolitical trouble, together with a speculative peak. All three could push up commodities in a late cyclical outperformance into 2014 with bonds already having topped and stocks topping this mid-year. In this scenario I would expect an inflationary spike to help tip the global economy into subsequent recession.

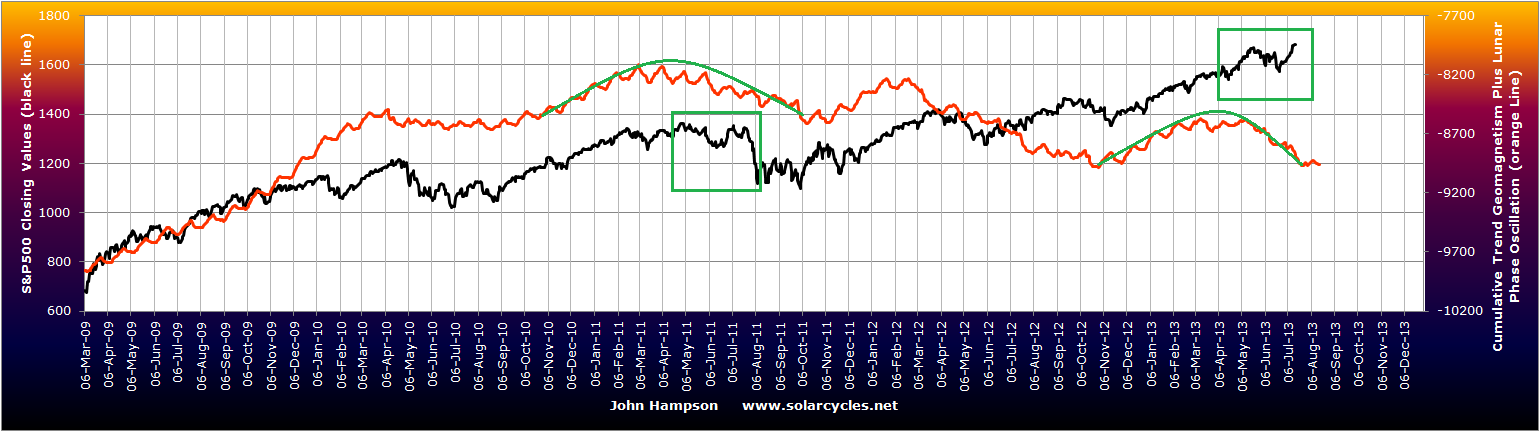
Next, geomagnetism. All models have been updated for this week, and drawing in the next 3 weeks geomagnetism forecast, we see this (mapped against the commodities index):

1aug3A flattening out in cumulative geomagnetism in August following a downtrend May-July. By normal seasonality, geomagnetism should be troubling again by September and October. August-September would therefore be a suitable time for US equities to make a final peak in a topping process, if one began in May. Did one?

Well, so far the process is developing like a typical top. A marginally higher high is currently being played out with some weakening in breadth versus the May peak (% stocks above 50MA, Mclellan summation index). Margin debt still looks like it peaked in April, and in 2000 and 2007 this peaked 3-6 months before the stock market finally rolled over. However, this would all be invalidated if stocks push on again here and away from the topping range, with breadth strengthening again. US earnings may play a role in this and so far have made an impressive earnings beat, but a poor revenue beat rate. This means companies are making profits by cutting costs. This could be a warning if the economy shows signs of weakening, which brings us back to the importance of leading indicator readings as they come out. If central banks have been able to juice the economy just enough to offset demographics, through rate cuts, QE and verbal support (do what ever it takes) then it is feasible that this already long cyclical bull (by historical comparisons) continues. But I side with the multi-month topping process currently playing out until counter-evidence increases.

Next, lunar phasing. I have updated The Lunar Edge page and this is how the two of the most ‘sensitive’ indices to lunar phasing have performed so far this year:

LE43 LE23

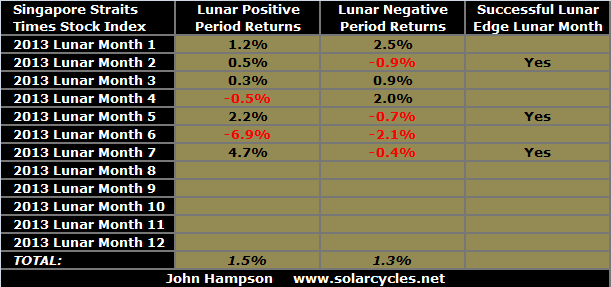
The German Dax has delivered all of its annual gains so far within the lunar positive fortnights (4 days after full moon through to 4 days after new moon), whereas the Singapore Straits has really delivered no lunar edge of any note so far this year. Nonetheless, a strategy playing the lunar edge equally across both would still have returned well overall. I continue to look to the start of lunar negative periods for adding short and to the start of lunar positive periods for adding long, in order to time my longer term trades. On that note, the current lunar positive period ends by Friday next week. If equities have been able to rise further by then, I will look at taking profits where in profit, and adding short at that point if evidence continues to support a topping process.

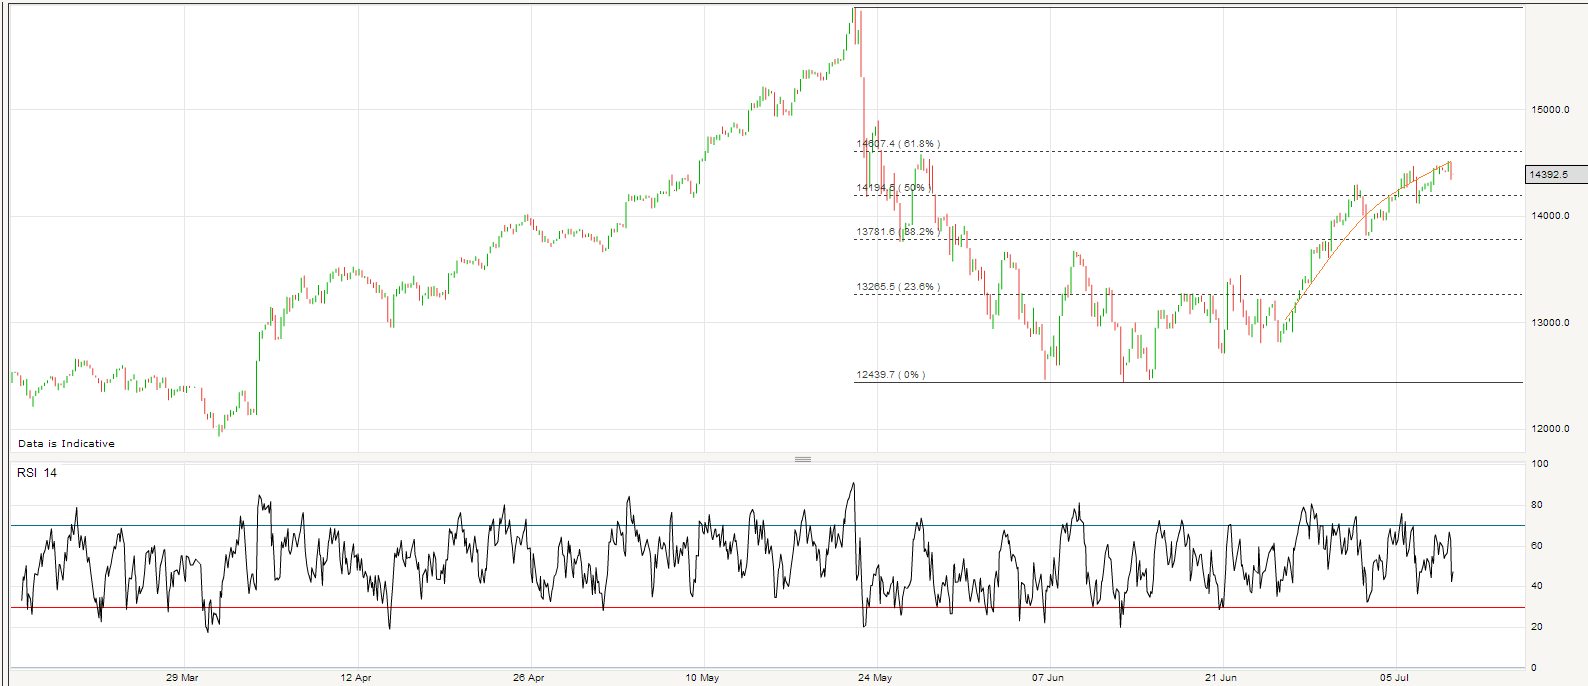
Because we are in a lunar positive period currently, and Japanese equities fulfilled what I last suggested look liked occurring (the arching-over turning into falls) I have entered long Nikkei again, but just a starter position. My main exposure currently remains long commodities, with greatest weighting precious metals. I have various significant loss-making positions in commodities. I continue to believe that because of demographic trends precious metals will come again as the anti-demographic. I suggest central banks in US, China and Europe will continue to have to support the economy for some time to come and that renewed dovish talk will benefit gold. For other commodities, I return to the solar maximum unknown. If the solar maximum is ahead still, then I believe temperature and geopolitical disturbance and speculative mania can inspire a historically normal commodities peak following a peak in equities. Crude oil’s breakout in June gave this more credibility. Crude has now pulled back a little, and it will be important to see if this is consolidation before further gains.

If commodities as a whole have peaked and deflation continues to press them downwards, then I will be holding increasing loss-making positions. What to do? I will be looking to average down and time mean reversion. Nothing goes down in a straight line and I will be looking to convert them into winning trades in a ‘trade your way out’ style by leveraging up. Not easy, and no doubt some would view that as too risky, but that’s what I will be doing. Don’t follow me, etc, I’m just sharing with you what I’m doing, as the money management is as important as the analysis, right? But first, let’s see if commodities can outperform in the rest of 2013, as the previously detailed evidence suggests is possible. I want to give them a little more time to gather momentum, before using aggression.

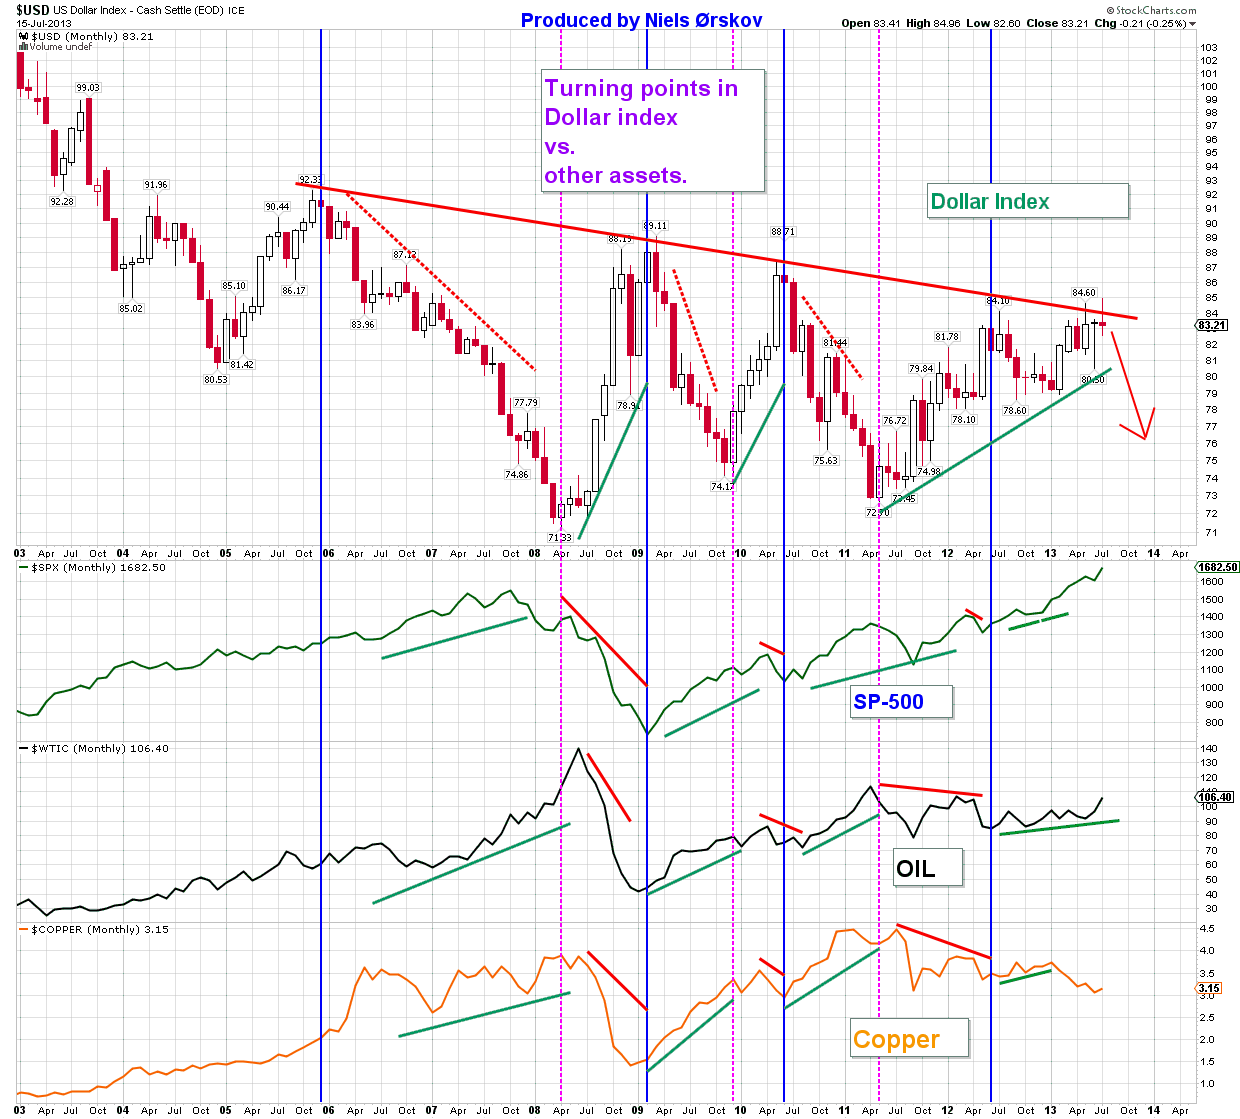
Some key assets. Gold reached important resistance around 1344. Can it break through? If not then the basing process in precious metals will need some time longer. It is confidence restoration versus short squeeze, but if the latter is to occur then we will need triggers in the news. The US dollar has been in decline since the Fed backtracked on QE-tapering-hastiness, turned away at key long term resistance. However, it could yet be consolidation before another charge. I believe it will weaken as the Eurozone relatively improves, but the Fed’s actions will play a key role. Since I sold out of short-treasuries they tracked overall sideways. This could be consolidation before further rises in yields, but as there has been no pullback I don’t wish to yet rejoin.

I am writing this post US GDP release and pre FOMC output. Both market movers, and it will take until tomorrow for the dust to settle and we see where different assets want to go. But I wanted to get the post out as my trip gave me no opportunity. Thanks for your comments and emails whilst I have been away.

Advertisement

State Of The Markets

The SP500 followed the Russell 2000 and Nasdaq to new highs, on good breadth with healthy leading sectors. A marginal new high is normal in a topping process, but we would expect to see some kind of warning flags developing in terms of leading indicators if not in internals. We would also expect any new high to still be within an overall topping range, so not to run away too far. Here is one such topping model:

16jul6

Source: Zevcapitalresearch

So might stocks get pulled back soon? Earnings reports are just getting going so too soon to assess beat rates, but earnings season usually produces a bullish or bearish theme. Geomagnetism continues to disturb and diverge from performance in some key stock markets. I have highlighted a historic rhyme below, which would be consistent with a topping process and then a fall in earnest in US equities:

16jul2

I have updated all models on the site this morning.

ECRI leading indicators for the US have changed trend:

16jul3Source: ECRI / Dshort

And the ISM manufacturing and services composite is also trending down:

16jul1Source: Bespoke

World GDP is also in a steadily weakening trend, which is in line with my expectations based on the confluence of negative demographic trends now in place between US, Europe and China. I have marked their respective demographic peaks to illustrate:

16jul4Underlying source: Economist

Because of the demographics, my primary expectation is that the economic data will indeed continue to weaken and in due course topple the stock market. The alternative would be that the collective efforts of central banks are sufficient to prop up the global economy to a sufficient degree to maintain the low-growth-low-rates environment which is positive for equities. So all eyes on the leading indicators.

The US stock market is now in the top 3 most expensive by CAPE globally. Again from my demographic work, high price-earnings valuations can go higher if demographic trends are positive. However, the US is in a period of negative demographic trend so the expensive valuation is an anomaly that should be corrected in due course.

Crude oil has continued its upward trend and cemented its breakout. Gold and silver look to have carved out bottoms, though still tentative. The CCI commodities index has now been in a two week uptrend. So still early developments for commodities, but I maintain there is a greater likelihood of the historically typical process of commodities starting to outperform whilst equities make a multi-month topping process (with bonds already having topped), and eventually commodities topping last as they help tip the economy into recession. Another possible development in support of this would be if the US dollar broke down from its recent uptrend following Bernanke’s softer QE stance that came out last week. A chart by Niels here:

16jul5Source: Niels Orskov / Stockcharts

So as things stand, I maintain my overall expectation that stocks are in the first half of a multi-month topping process, with a marginal new high being carved out currently that should soon be turned back down. Commodities should outperform here forwards. Leading indicators should weaken sufficiently to prevent further advance in equities, but not too drastically to sink commodities. Moving into 2014 commodities should peak as they suck the remaining life out of the global economy, which is already vulnerable due to collective demographics of the major nations. Whether they can do this around the time of the solar maximum, as per history, remains to be seen, as the experts continue to diverge on forecasting when the solar maximum will be or was. The sunspot trend remains messy for now.

Trading-wise, if equities can rally a little higher here whilst we see a little more leading indicator or earnings degredation come to light, I will take off some more from the long side and add on the short side. Meanwhile I continue to sit on my ample commodities long positions.

Trading Update

I have taken profits on Nikkei longs today and added short on the French CAC. We are now switching into the lunar negative fortnight, with a geomagnetic storm also in progress, and I believe we are in a multi-month topping process in equities. I expect the topping process to be an overall volatile range lasting into September before falls in earnest, but within that I want to sell into strength and buy into weakness.

The Nikkei trade has been a big earner as I was aggressive into the pullback, based on my demographic research. Now this is how it stands: close to a 61 fib retrace of the falls, and arching over:

10jul20135

I maintain the expectation that it will eventually break upwards out of its long term downsloping resistance, but wish to step back for the lunar negative period and with the belief that if global equities are topping another leg down in equities should be next.

US retail and discretionary broke out to new highs along with small caps, which is bullish, but marginal new highs are normal in a topping process. There is a possibility US earnings now pull back equities, as shown by the historic correlation between USD strength and revenue misses:

10jul20134We also see encouraging signs that commodities may be beginning outperformance, with crude oil pushing on again yesterday and agriculture strong the last couple of sessions, despite USD strength. A topping process in equities beginning as commodities start to outperform would be very much in line with 2007/8:

10jul20131

Overbearish sentiment has been stretched like an elastic band on most commodities and commodity currencies for some time now, so mean reversion also supports a rally, plus Goldman and JPM have been putting out notes arguing for some fresh upside now in the class.

Sentiment has also been very bearish on treasuries for some time now, as yields have risen 70% from their lows. I am considering taking profits on short treasuries also. My thinking is that a pullback in yields is due, and I am wondering whether a combination of the fast-rising yields together with continued soft economic data (expectations based on demographics) will bring about a softening/backtracking in wording related to the announced pull back in QE. Such a development, either in yields or in policy, should then benefit precious metals. Just speculation, but as part of my overall case for a transition in the fortunes of asset classes this summer.

I continue to look for evidence in leading indicators for a weakening in economic data that the combined demographics of USA, Europe and China suggest should occur.

Based on the latest OECD data, we see fairly flat narrow real money and leading leading indicator, neither giving much clue as to future trend, but strong enough as things stand:

10jul20132Source: Moneymovesmarkets

And to finish, Citigroup economic surprises for the US. We see economists clearly struggling with data expectations following 2008 in the wild swings oscillating up and down, but gradually getting to grips as the swings range narrows:

10jul20133Source: Yardeni

If this were a stock we’d be expecting a resolution to the triangle, and as can be seen we may have one. Maybe there’s nothing to read into this, but if anyone has any thoughts I’d be interested to hear.

State Of The Markets

No collapse in the stock market, which makes the case stronger for a more regular multi-month topping process. It would be historically normal for equities to retest their May highs and even make a marginally new high, then complete a volatile trading range by around September time before falling in earnest.

Also historically normal would be if commodities outperform from here, with bonds having topped first, then stocks topping, and eventually commodities topping out, likely in 2014. The continued falls in bonds – and rise in yields – adds weight to bonds having topped – and yields bottomed – in 2012. Now are world equities in the process of making their top?:

7jul4Source: Bloomberg

The strong advance in crude oil of late has added more weight to commodities going on to outperform here, rather than the historically abnormal but deflationary case of commodities sinking. The combination of protest and unrest in Egypt together with speculation in crude oil are both historically normal for a solar maximum, so I am encouraged. Nonetheless, crude oil has yet to truly break out and some geopolitical dampening could pull it back:

7jul1Source: Stockcharts

If crude does continue to rise, then commodities as a whole should catch a bid, due to high historic correlation, with oil a a key input in the agri process and a key inflationary force, which brings us to gold. Gold has dropped around 30% from its 2011 high, which is similar to the percentage drop made in 2008. It has the potential to be making a bottom here with a higher low than in late June, and the longstanding overdue bounce based on extreme bearishness, but only if it can rise this coming week, which brings back to oil’s performance, plus also the US dollar.

The recent strength in the USD has taken the currency to back up to a key level. Below is the long term view and the potential for an important breakout:

7jul6Source: Rambus / Stockcharts

However, as per my demographic work, I believe leading indicators will weaken and gold will re-assert itself, and US stocks will top out here reducing demand for the dollar. Here is some evidence to support that view.

The latest global PMI combined services and manufacturing dropped to 51.4 from 52.9 and continues the overall weakening trend over the last few years. This is as I would expect under the combined deflationary demographics of USA, China and Europe since around 2010.

7jul7Source: Markit

The performance in corporate bonds suggests US housing may be about to turn down again also:

7jul5Source: Martin Pring

And margin debt continues to look an important pointer for the stock market. See below how a sharp run up in margin debt, a final parabolic rise, precedes the 2000 and 2007 tops in the SP500 by several months. We have seen a similar parabolic rise since mid-2012 to now and there is the possibility that margin debt peaked out in April which would suggest stocks should indeed be in a topping process now and over the next couple of months:

7jul8Source: Dshort

If stocks are topping out then normal clues would be found in negative divergences in stock market internals and leading indicators. For the former, we should look for breadth divergence once we see a retest of the highs. For the latter, we have the potential in the global PMI above, but also in this leading indicator of leading indicators, by RecessionAlert:

7jul2

Source: RecessionAlert

I have enquired with them what this MBS indicator is, but have no reply. If anyone knows, please share. But it would fit with my demographic-deflationary expectations.

We also see a potential divergence in geomagnetism, if equities can now rally again to a retest of the highs:

7jul9

The ideal combination by my work and research is for commodities to outperform again now into next year, and make a speculative peak near to the solar peak (the timing of the solar peak remains unknown, with the experts still diverging. Sunspots are currently back up over 100, which adds to the muddy trend), then deflationary demographics to mean the global economy fairly quickly tips into recession under that commodity price pressure, and then we should see the steep falls in nominal stocks. My alternative scenario is that the deflationary forces are too great and commodities in general sink with just gold, as the anti-demographic, eventually coming again alone.

In support of my primary scenario, the action in live cattle has been very much aligned with solar history, with what looks like a peak earlier this year:

7jul10Source: Tarassov

7jul11Source: TradingCharts

Now we need to see other commodities make a fresh rally to new highs, assuming a solar peak is still ahead.

This week we have the new moon on Monday and the end of the lunar positive period by Thursday. So I am ideally looking for equities to rise further in the next couple of days and make that retest of the highs or marginally higher high, then retracing again in the negative lunar period ahead, to further the technical look of a topping process. If we get that retest of the highs then I will be looking to sell equities longs and add short. But for further support I would like to see oil break out, commodities to rise en masse and the US dollar to be turned down with gold catching a bid at last. Let’s see how the action unfolds.