

I have taken profits on Nikkei longs today and added short on the French CAC. We are now switching into the lunar negative fortnight, with a geomagnetic storm also in progress, and I believe we are in a multi-month topping process in equities. I expect the topping process to be an overall volatile range lasting into September before falls in earnest, but within that I want to sell into strength and buy into weakness.
The Nikkei trade has been a big earner as I was aggressive into the pullback, based on my demographic research. Now this is how it stands: close to a 61 fib retrace of the falls, and arching over:
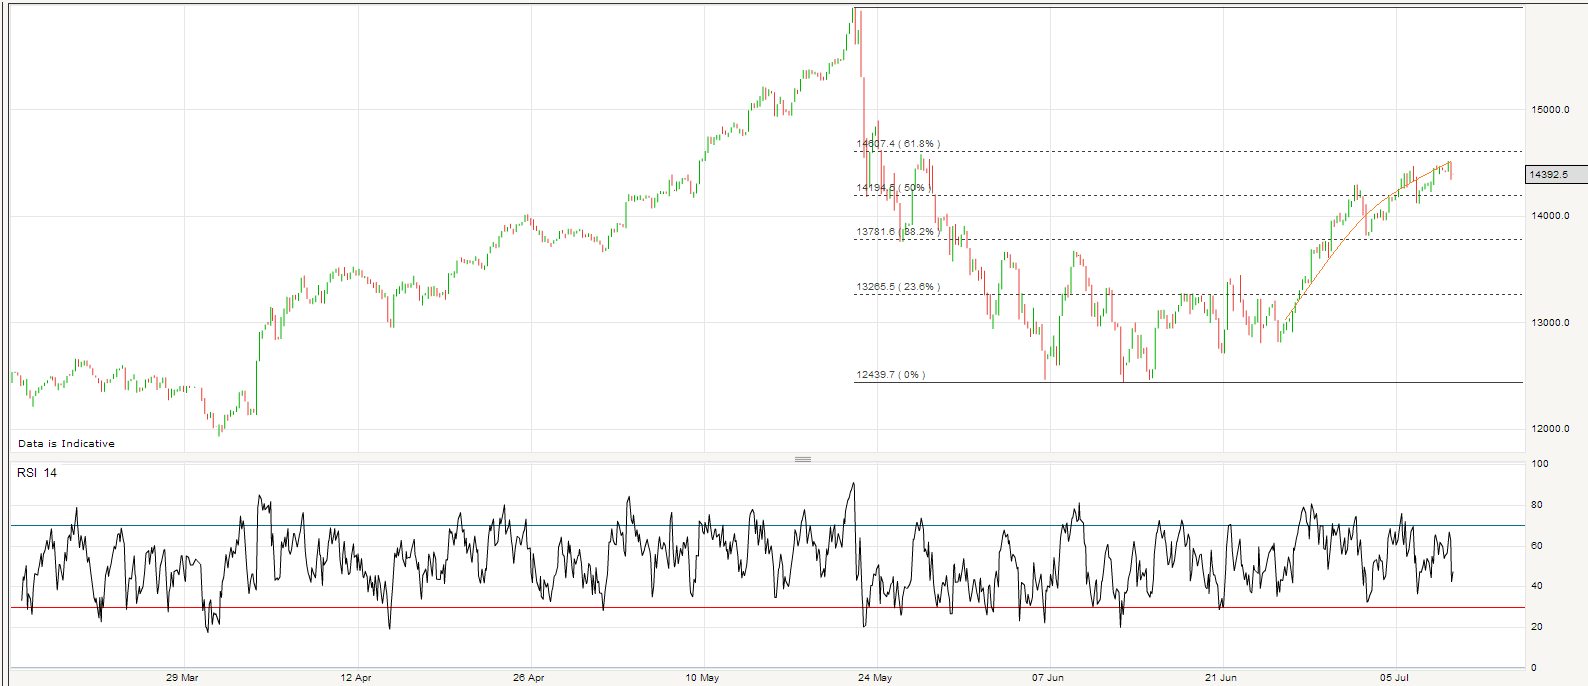
I maintain the expectation that it will eventually break upwards out of its long term downsloping resistance, but wish to step back for the lunar negative period and with the belief that if global equities are topping another leg down in equities should be next.
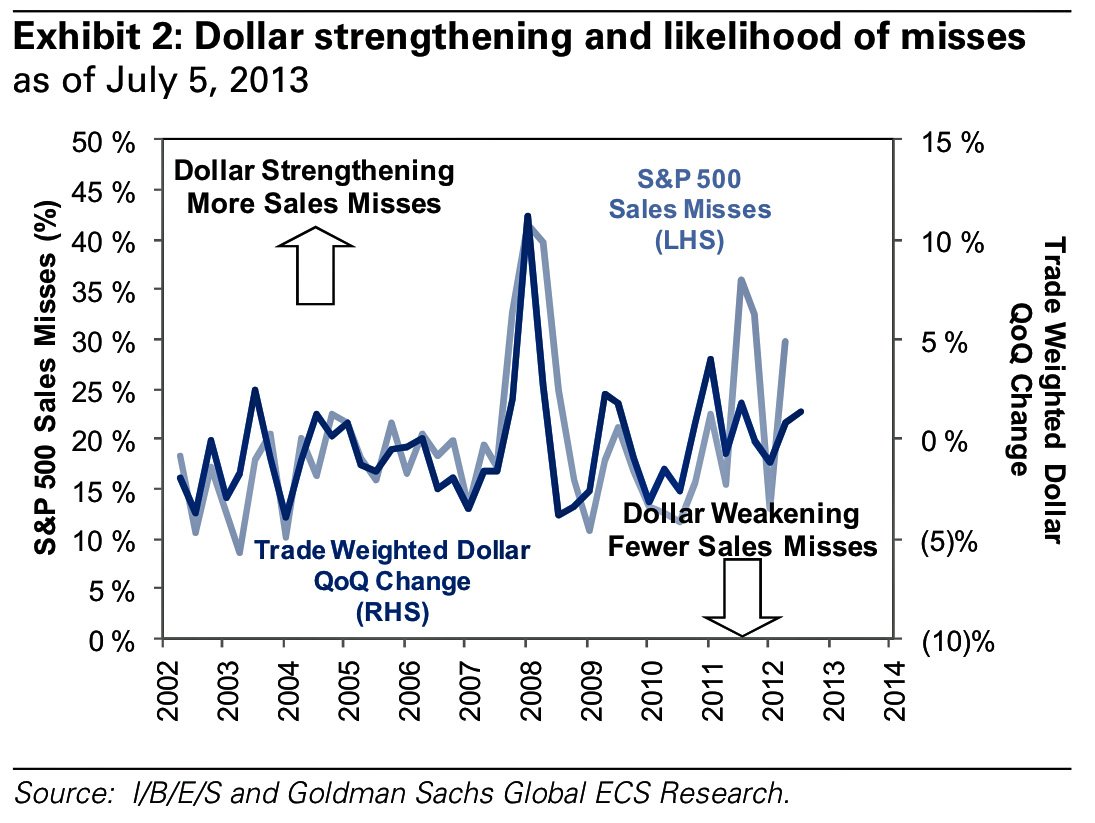
US retail and discretionary broke out to new highs along with small caps, which is bullish, but marginal new highs are normal in a topping process. There is a possibility US earnings now pull back equities, as shown by the historic correlation between USD strength and revenue misses:
 We also see encouraging signs that commodities may be beginning outperformance, with crude oil pushing on again yesterday and agriculture strong the last couple of sessions, despite USD strength. A topping process in equities beginning as commodities start to outperform would be very much in line with 2007/8:

Overbearish sentiment has been stretched like an elastic band on most commodities and commodity currencies for some time now, so mean reversion also supports a rally, plus Goldman and JPM have been putting out notes arguing for some fresh upside now in the class.
Sentiment has also been very bearish on treasuries for some time now, as yields have risen 70% from their lows. I am considering taking profits on short treasuries also. My thinking is that a pullback in yields is due, and I am wondering whether a combination of the fast-rising yields together with continued soft economic data (expectations based on demographics) will bring about a softening/backtracking in wording related to the announced pull back in QE. Such a development, either in yields or in policy, should then benefit precious metals. Just speculation, but as part of my overall case for a transition in the fortunes of asset classes this summer.
I continue to look for evidence in leading indicators for a weakening in economic data that the combined demographics of USA, Europe and China suggest should occur.
Based on the latest OECD data, we see fairly flat narrow real money and leading leading indicator, neither giving much clue as to future trend, but strong enough as things stand:
 Source: Moneymovesmarkets
And to finish, Citigroup economic surprises for the US. We see economists clearly struggling with data expectations following 2008 in the wild swings oscillating up and down, but gradually getting to grips as the swings range narrows:
 Source: Yardeni
If this were a stock we’d be expecting a resolution to the triangle, and as can be seen we may have one. Maybe there’s nothing to read into this, but if anyone has any thoughts I’d be interested to hear.

Shorting Treasuries was a great job. Bravo !
Thanks vic
hi John

any weakness the next 1-2 weeks will give me a crash setup for Norway
Here is the Norwegian index (not adjusted for dividends)
When we break below the level 6 months ago (6month cycle) we are in great danger, and it is about to happen
For the dividend adjusted index the signal will come if we decline some 3% from here
what makes the setup very potent, is that the next cycle low is around December.
If we had a cycle low in August, we could have made a quick crash and recovered. But if we get a deep correction now, bulls wont get any cycle-help before December…
Interesting, thanks Jan
Topping process for equities and Commodities, as 1909-16-19 Dow Jones upward wedge or 1980 pattern S&P, retracement roughly 30% to the Monthly MM200.
If we are in the 1st case plunge -40-50%, The 2nd 30-35%.
In this point, my idea is to purchase, to be long -can make a double bottom- through 2023+-.
The current top cycle initiated in 2000, will end in 2017-18 to expand till 2023 ( as from 1923-29, ending about this year the 300 years cycle from 1720 and may be the conclusion of the Capitalism).
Prior crests from 1720> 1835, 1929, 2023?
@apanalis
Thanks Antonio
Took profits on short treasuries
very nice. congrats!
Cheers Pima
Thought you might be interested in this article John – not quite as mind-stunning as Jan’s stuff, but interesting just the same if one is long gold….
http://www.cnbc.com/id/100877221
If you laughed at us trying to figure out negative and positive phases, I could not distinguish between the full and new moon symbols on my calendar – which were which – so was positively relieved when you gave actual dates.
Such a drama!
Thanks John and everyone for making this such an interesting site.
I am in cash Antonio – what now???
I trade in medium-long term. It is good chance to be en cash, traders are so anxious to be in cash, no matter. In long time periods, do like the hunter behind the trees.
If Us indices go up again mkng new higs in the upward wedge for the Dow Jones, around 16.000-17.000 I w be short again- I´m short, but in Etfs- to see a plunge about -30-35% at least like in 1980 S&P to reach the monthly MM200.
In this point I will be long, not sure if this will be the final bottom of this 17-years cycle, after 2009 bottom in the 9th year from prior top, in 2000, as the pattern says.
If not, will add more long positions in a retracement about 0,76 from the top, in the line of the 17 cycle from 1906-23, ner the 2009 bottom.
For a while, I must be aware of loosing, but in not possible to be 100% sure of my analysis, so that I add positions in the way I think the market will play out.
I was long in some positions in oct-nov´08, and I added in march´09.
I was short since feb´07, and added shorts in summer-out´07.
Cash is more important than investors think.Strategy ( I don´t know the accurate word in english) in the way you expect, by the studies of the Cycle, you think the market will do.
Expect Gold about $1000, to a rebound at least 0,76, not surpass prior max. in 2011. Is possible, as I expalined here, but not sure.
In 1980 and in 1976 had a drop about -48% in both case, but the long term develoment was different.
US Price Bonds, must look for the bottom where the ascending trendline is playing, TLT, etf, about 95.
Then long.
And so
Cash combined with the study of the cycle is the King.
If you can wait, be long in Commodities +-2030, now, short, in each rebound, short.
It is my way, personal way.
@apanais
Sorry, @apanalis, I write my point of view in Twitter and sometimes I write some thoughts Thanks to John´s amiability.
Thank you Antonio for your careful reply
I do pop into the market for the day occasionally, as I was/am expecting a pull-back.
(I wish you had been handling my funds. I was worried before the crash, so put 2/3 of my funds into very different hedge funds (all through the same bank) and lost almost all.)
I have lost my daring which tempers my trading, so the 1/3 in cash consoles.
Thanks again for your suggestions.
Thanks Fiona
John i think DOW will give a panic selloff to around 13800-14000 before recovering yet again and moving towards 16500+ on DOW before it TOPS OUT and CRASHES sometime after September.
Thanks
wow what a squeeze

maybe the cycles do work once again, and dont invert
Here is the past
and the cycle projection (direction) for the fall

janbenestad, love your cycle work… quick question, I liked to reference a chart on the sibert.org site (http://www.sibet.org/free/stockcharts.html) which provide a quick summary of tix/trin/nyad etc… which is no longer available at that link. Is it possible for me to get a new link, or, can you post one with the indicator setting so that I can do my own… any help appreciated. For John Hampson, love you site and been following your work for a while now, thanks very much for your efforts.
typos’d … “sibert.org”, “tick”, “indicators”, “your” … bit to quick on the keyboard. apologies.
hi, I quit my subscription at stockcharts, so the charts are no longer available.
Dont remember the settings for the intraday charts. Think I used 5min data with tick as the main data, and 1 and 3 day averages (1 day = 150x5min, 3 day = 450x5min)
you may start with this chart
http://stockcharts.com/h-sc/ui?s=$TICK&p=D&yr=0&mn=6&dy=0&id=p39920689485
then change to 5min chart and 10 days, change the MA parameters to 150 or 450
add vix and nyud, and apply 150/450 averages on them and TRIN/NYAD
And maybe also a MACD on the tick
another one I found useful was tick cumulated 1min data, and a 450/1350 macd I think it was…
sorry… 1 and 3 days are 90 x 5 min and 270 x 5 min 🙂
Hi John,
Great trading as usual, especially Treasuries. One thing on your Japan long, you did it partly based on demographics but then closed it within a number of weeks (makes sense on the basis on a global sell off). Was this a longer terms trade that changed into a short trade i.e. snatch a quick profit and re-enter later?
You and your readers may be interested in my take on gold – “The Gold Cycle Has Bottomed”
http://www.17yearstockmarketcycle.com/
Regards,
Kerry
Reasons for taking profits as above. But not done with Japan – I will be looking long again – so yes re-enter at a later date.
Fwiw, if the Nasdaq closes around 3550 today, then it will be a lunar green period that recorded a 200 point gain, and that’s pretty rare. The last time this happened was early July 2011, and then it marked the peak of the year, followed by several months of declines. It took until early 2012 for the July 2011 highs to be surpassed.
Also in my comparison chart vs 1920s we are now reaching the point where a one year sideways/corrective phase started, see: http://lunatictrader.files.wordpress.com/2013/06/2010vs1920.png
In the coming weeks the markets could still stage a moonshot if new highs bring in new buyers. Dow 16500 and Nasdaq 3700 are possible in August, and then the stage would be set for a nice pullback.
Thanks guys
John, this is on the line of your thesis, but I think i would be faster and will make next recession>http://advisorperspectives.com/dshort/updates/PPI-Headline-and-Core.php
http://recessionalert.com/market-update-11072013/
explanation for recessionalert MBS indicator. not sure if someone already gave it.
Thanks