Bear Market Rally

Well, is it a bear market rally or a bull market rally?

20 months after topping indicators started flagging we still can’t say for sure. That sounds incredible, but before the 1929 top the first topping indicators flagged from May 1928 onwards, and before the 2000 top the first topping indicators flagged from July 1998 onwards. So long difficult tops can and do occur.

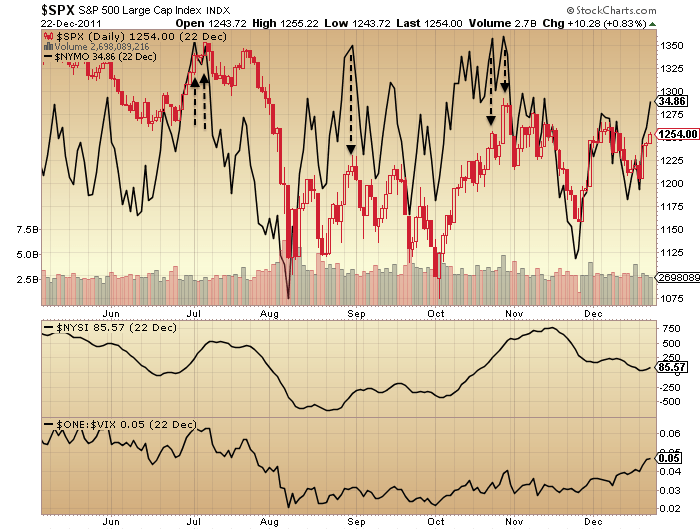
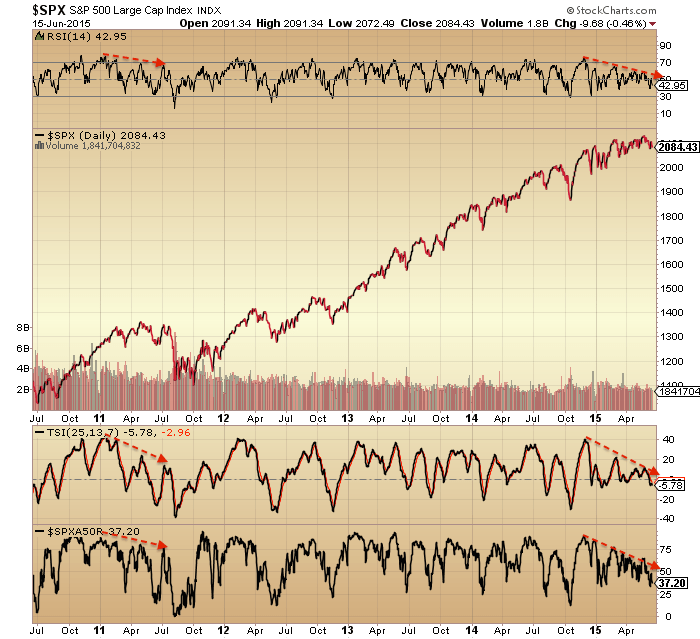
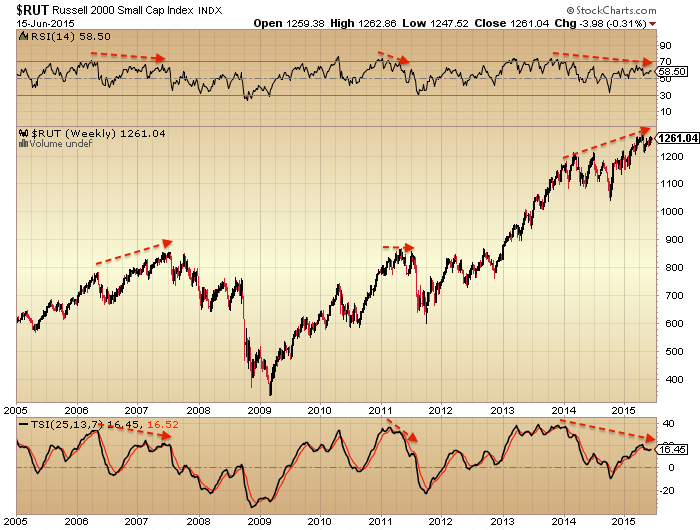
In our current scenario we can pick out these 3 as the longest standing divergences from January 2014 onwards, then picking out May 2015 as the actual bull market peak:

11octo2

Source: Stockcharts

Collectively these 3 indicators represent a shift away from risk appetite, which is a typical topping process identifier. Apart from these, it’s worth recapping what other clues were there way back at the start of 2014, so this is how things stood then:

The previous 2 years rally in US stock indices was made up of less than 20% earnings growth and more than 80% multiple expansion. The last 2 such occurrences in history were 1985:1986 (leading into 1987 crash) and 1997:1998 (leading into 1999 real Dow peak).

Compound annual growth rate in equities since 2009 was only exceeded in 1929, 1937, 1987 and 2000, all of which led to steep market declines.

Valuations (aggregating various measures) were the third highest in history after the 2000 and 1929 peaks.

Russell 2000 reached trailing p/e ratio 88; Amazon trailing p/e 1440; Facebook trailing p/e 148; Twitter reached $40bn market cap with zero profits.

Declining breadth in the number of countries participating in world equities rally.

Cluster of extreme Skew readings not seen since June 1990 before recession began July 1990.

Investor Intelligence percentage bears and bull-bear spread were both at 1987 levels (market crash).

NAAIM survey sentiment was in the 98th percentile = extreme optimism.

US household exposure to equities had risen to the same levels as the 2007 top.

Fund manager allocation to global equities at levels that previously led to a market peak or correction.

Rydex bull-bear and levergaged bull-bear ratios at an all-time record.

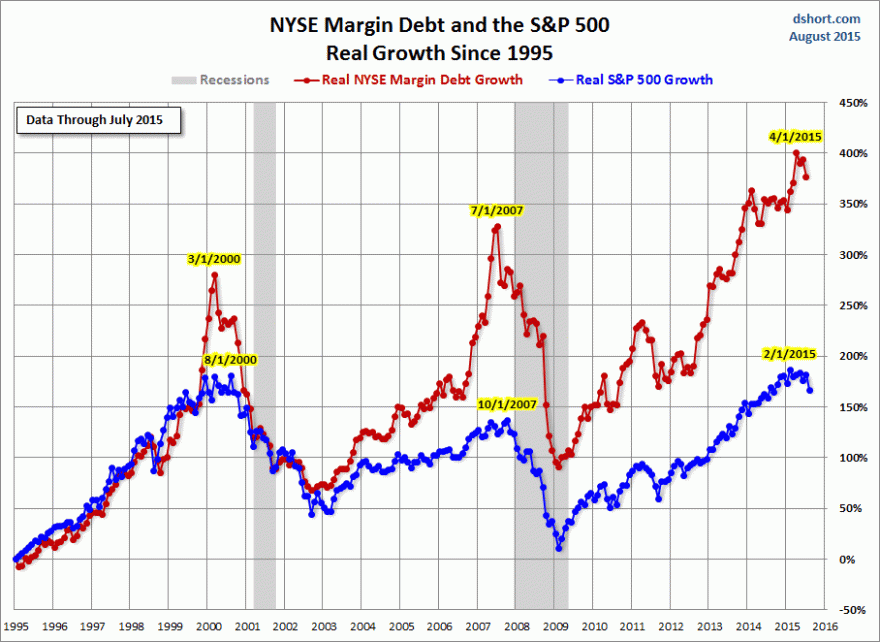
Margin Debt had escalated to 2.5% of GDP, only exceeded at the 2000 market peak.

And the list did’t stop there. But, we can unify these varied measures and indicators as (1) evidence of an unsustainable mania and (2) divergences in breadth and risk appetite. The first warned us of a coming peak and the second of a peak in progress.

At the time solar scientists believed the solar max was already through, but this didn’t turn out to the case until mid 2014.

11octo1

Fitting in with this, at mid-2014 the bulk of other negative divergence topping indicators formed. We saw a similar bulk-flagging in Jan-Mar 2000 (before the August final roll over) and in June-July 2007 (before the October final roll over).

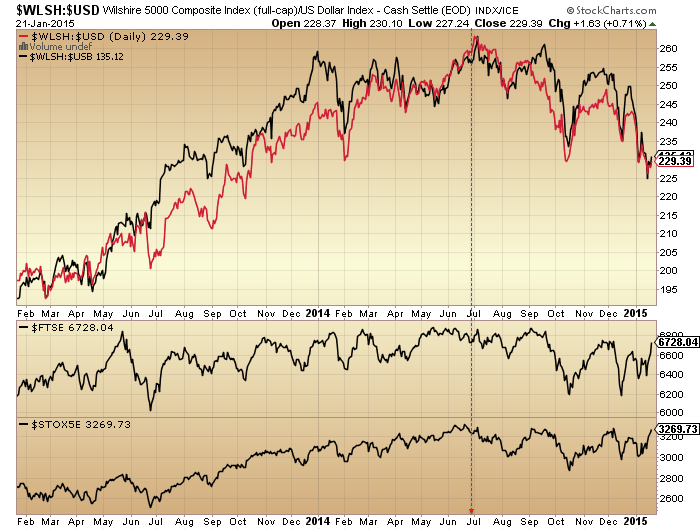
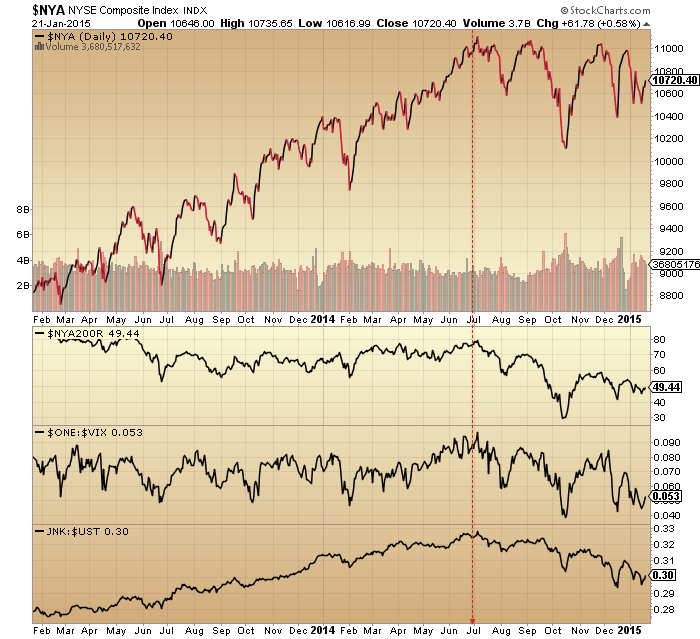
Here we see high beta to stocks, stocks to bonds, stocks to dollar and junk bonds as examples of that under-the-hood mid 2014 peak.

9octo12

Shortly afterwards geomagnetism started to ramp up as is common post solar maximum and weighs negative on the market.

11octo3

All four charts so far in this post show the same thing: peaks in the past and downtrends in place ever since. This aids our conviction for a bear market in progress.

A closer look at recent geomagnetism reveals this:

11octo2
There has been an intensification of storms since around February this year, after which the market struggled to make any further gains. The latest spike down was right at the end of last week, meanwhile sunspots have dropped to close to zero, so for now solar influences are very much aligned for a bear market.

By the recent stock market low of late September, capitulative breadth, contrarian put call and sentiment readings had formed, out of which the market has made a sharp rally upwards to the current point. Bear market rallies are typically fast and furious so the strength doesn’t provide decisive confirmation of bull or bear.

The Zweig breadth thrust flagged at the recent low, and history shows that these have been potent rally initiators in bull markets but overall poor in bear markets. So again, that doesn’t particularly help us here.

Also, insider buying flagged at the recent low, but again, history shows us that this group is a dip buyer at both bull market correction bottoms and bear market pauses, so wise enough to be buying after falls but not wise enough to differentiate between a bull correction and a bear market.

Capitulative breadth returned to zero earlier last week (i.e. bullish edge gone) and Nymo hit a rare extreme of over 90 by the end of Thursday. Here are similar such Nymo prints from the past:

9octo10 9octo7 9octo2 9octo6

Fairly consistently they initiated a pullback in stocks either to the day or within a couple of days. At the start of this coming week we have the new moon and US earnings get going, so that, together with the very recent geomagnetism could help trigger the fresh reversal. But what then?

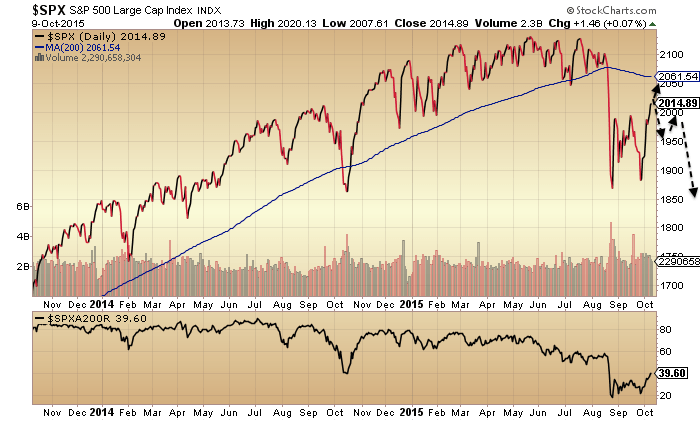
Drawing on historic examples of the kind of price pattern in progress, I suggest two possibilities, shown:

11octo7

One is we reach up to the 200MA then are repelled back into the bear market. The other, and my favoured option, is we pull back lower, then make a lower high, then resume downwards.

Chris Carolan merges previous similar solar lunar years from the past and creates a model. I don’t know how successful this is but the method appeals.

25sepe1

It might fit with my favoured scenario of pullback, rally back up to lower high, then down again properly as of November.

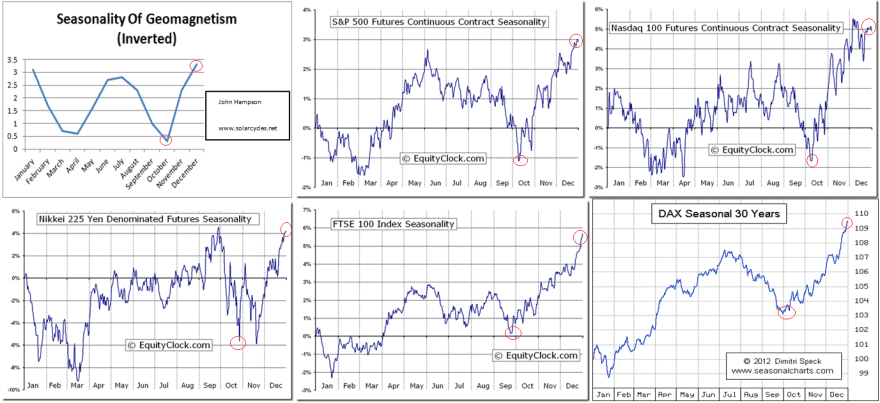
October is typically the worst point seasonally geomagnetically, from which pressure then eases. Plus earnings may collectively surprise worse or better. These are two wildcards for the rest of this month.

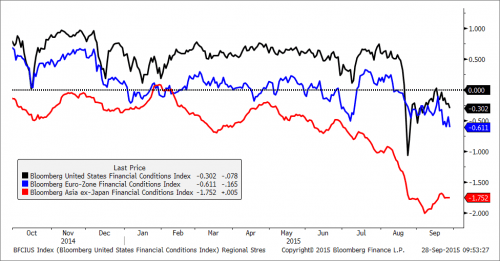
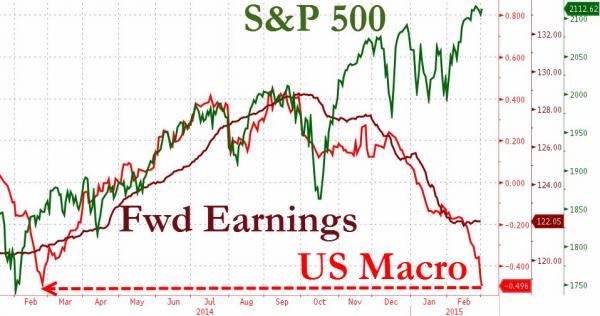
ECRI leading indicators are still negative but maybe forming a higher low, whilst narrow money leading indicators for the US suggest weakness over the next several months. Financial conditions in US, Europe and Asia are united negative.

11octo11

Source: Bloomberg

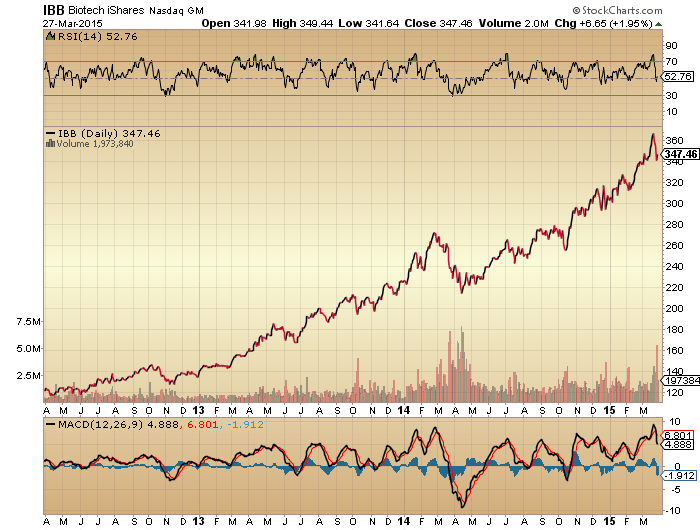
Biotech, the mania leader, and my biggest short, has only managed so far to make a bear flag down at the lows, post parabolic break. Gold and miners, my only longs, have taken off this last week, but as yet we can’t differentiate them from the bullish break upwards in oil (whether they are acting as safe havens or commodities).

To finish, if we step back and look at the big picture again, there is considerably higher likelihood this is a bear market rally rather than bull market post-correction resumption. The US indices are currently less damaged than most others but the wider world is more convincingly bearish. The Dow Jones World index shows a fairly telltale topping process:

11octo12

And Leuthold provide a nice summary of matching divergences in the US into the May 2015 peak to the 2000 and 2007 peaks.11octo15

Source: Leuthold Group

Stock Market, Sunspots And Geomagnetism

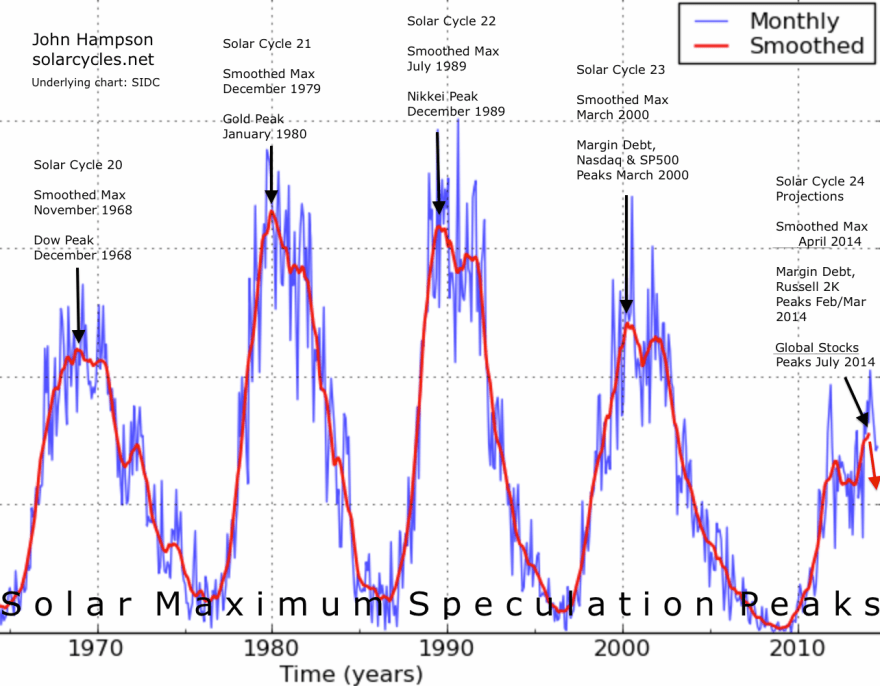
The smoothed solar maximum was April 2014. Geomagnetism intensified as of August 2014. This is normal progression: positive pressure up into the sunspot peak, then negative pressure as both sunspots wane and geomagnetism ramps up in the following window. The influence on financial markets is captured here:
Screen Shot 2015-09-11 at 16.29.43

We can see that the solar-inspired speculative mania effectively ended in that window of mid-year 2014, with stocks making a topping process between then and May 2015.

Daily geomagnetism reveals an intensification in recent months.

12sept1

Something similar happened in 2000.

12sept4

Stocks were led into a 2 year bear.

Back to the current, the overdue snap in equities in August 2015 changed the picture. No V-bounce like in 2013-2014, plus a sharp escalation in complacent indictors. This is not like those 2013-4 corrections.

12sept10

Various indicators which were stuck at bullish extremes in 2014 have now not only mean reverted but have moved all the way to bearish extremes. Amongst these are Investors Intelligence bulls, US equity outflows, capitulative breadth, Trin and a cluster of 90% down volume days. Collectively they represent bear market bottom readings, leading some analysts to call time on the current the correction in equities and predict a bull market resumption.

In that scenario we need to square why stocks only corrected 10%. In the first chart at the top we can see a year long stealth bear in progress, more apparent in some markets and indicators than others. So did stocks correct in time rather than price? Proponents of that option then have a problem with big picture indicators, in that both valuations and leverage are still a long way from mean reversion.

12sept20
29augu10Source: DShort

Due to the lack of demographic tailwind, the bull mania was fuelled by debt: traders leveraging up and companies leveraging up to make buybacks. For the bull market to continue, both those would need to rise to new record highs. Given the sharp snap in equities in August, the appetite for that is likely absent, at least for some time.

Rather, in my opinion, that was the point at which the mania popped, at which record complacency and froth was finally shot down. The bear market bottom readings in certain indicators are indeed a sign of a bear market: a pause in the downdraft. These indicators show selling and fear and are only bullish if they revert. Case in point: in 2014 they were stuck at extreme bullish and did not revert, hence stocks continued to edge up. The question is why they were stuck at record bullish extremes, and the answer is the hidden force of the solar maximum. Now we have the twin powers of waning sunspots and intense geomagnetism, which are likely to keep these indicators bearish.

There is a common misperception that the economy (i.e. recession) causes bear markets, but the data in fact shows that the stock market leads the economy.

US quarterly GDP at past major stock market peaks:

Q4 2007 4.4%
Q1 2000 6.18%
Q3 1987 6.08%
Q1 1973 11.91%
Q4 1968 9.84%

Rather it works like this: demographics and sunspot cycles bring about the major peaks and troughs. In our current case, the rise into the mid-2014 solar max caused the speculative mania in the markets, identified by extremes in valuations, sentiment, allocations and leverage. Then the wane from the solar max and associated intensification in geomagnetism have brought about the burst. That burst isn’t complete until valuations and leverage have reverted sub-mean, a process that is already fixed in demographic and solar trends right ahead.

October is the seasonal peak intensity for geomagnetism. This is the reason for a cluster of major historic drops to lows in October. We are finely poised leading into it. Stocks have made a triangle consolidation following the August drops. Gold has a weak higher low, as a tentative basing. For equities a retest of the August lows would be historically normal following such sharp drops, whether bull or bear bigger trend. But, various indicators are already at bearish extremes, i.e. contrarian bullish, so we could move further sideways or upwards before heading down again. Friday was the new moon, so we are now tipping over again into negative pressure, and this is assisted by current raging geomagnetism. FOMC and OpX this week.

My view. Stocks are in a bear since May 2015. That means no new highs and another lurch down lies ahead. Given the collective shock at the August drop in equities – despite 40+ topping indicators forming last year – another leg down to lower lows would have a major effect on the masses. If indicators can’t pull up now from their current extreme bearish readings, then that’s the recipe for another sharp break downwards in the current geomagnetic environment. Odds are this can transpire as we move into October. Invalidation would be stocks holding up through this window, gold breaking down, and equities indicators pulling away from bearish levels.

Bear V Bull

We can now see that the arching over in price in 2015 set against negative divergences in breadth and strength were indeed a prelude to a collapse in stocks like in 2011:

29augu1

Source: Stockcharts

After such a steep collapse and catapult readings in fear indicators, the market historically needs some time to consolidate and recover. The pattern should be that the rally of the last 3 days gives way imminently and we retest the lows.

29augu2

Source: ShortSideOfLong

That point would then be the next key test.

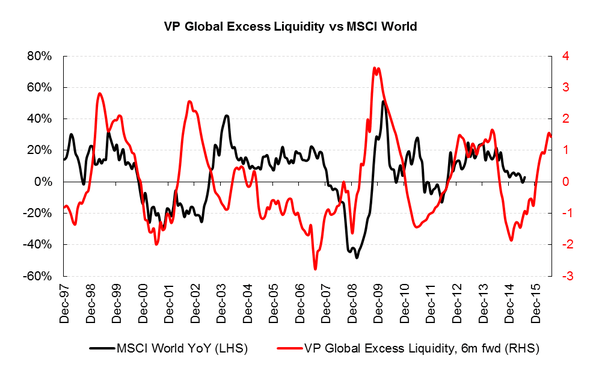
Bulls should be looking to see a double bottom or lower low on positive divergences from which price then resumes a bull trend to new highs. The best fit timeline by geomagnetism/seasonals would be a bottoming out in October and Xmas new highs. Supporting this scenario is liquidity trends.

29augu3

Source: Variant Perception

However, I rather see the overall evidence as supportive of stocks now being in a bear market. Drawing together all the indicators and disciplines that I trust, the data suggests stocks entered a topping process Jan 2014, made a first major peak in June/July 2014 with the solar max, made a first major low in October 2014 and a final second peak in May 2015. Several indicators reflect this progression, so here is one: stocks to bonds.

29augu4

Source: Stockcharts

Multiple indictors have registered bear-market-bottoms readings over recent months. Here’s another one from Dana Lyons:

29augu5

Source: Dana Lyons

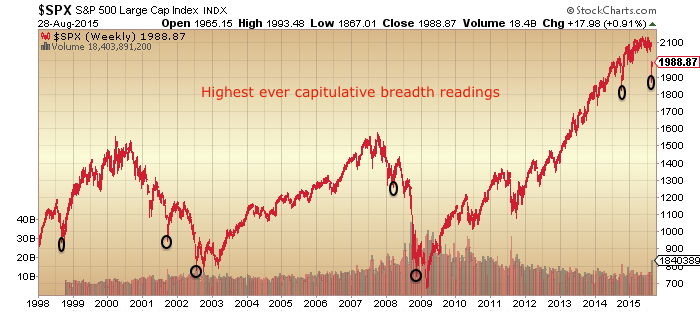
Capilulative breadth too, which hit its highest ever reading last week.

29augu8

CBI data from Rob Hannah

If we take the bull angle again, then we could argue that such readings are a springboard to much higher prices, but we need to explain why they have anomalously occurred at <10% from the highs. If buybacks were to blame for the shallower washout in nominal prices then we should have seen small caps and non-buyback large caps collapse whilst buyback large caps held up, but this has not been the case.

If, on the other hand, they are signals that we are in a bear market then prices should now fall again Sept-Oct and make significantly lower lows. The shaping in Biotech is supportive of this:

Screen Shot 2015-08-28 at 18.15.32

All in all, I think the extreme bearish readings we are printing this year in various indicators are a fair match for the all time record bullish readings we saw last year, namely that the markets have become excessively unbalanced.

But, what can we can say for sure is that multiple indicators that were screaming for a reset in equity prices have now been satisfied (such as breadth, sentiment divergences), which makes the next move particularly telling. Again, bulls see this as a refuel for eventual higher prices, but certain big picture indicators make any such notion that we have now reset rather foundation-less.

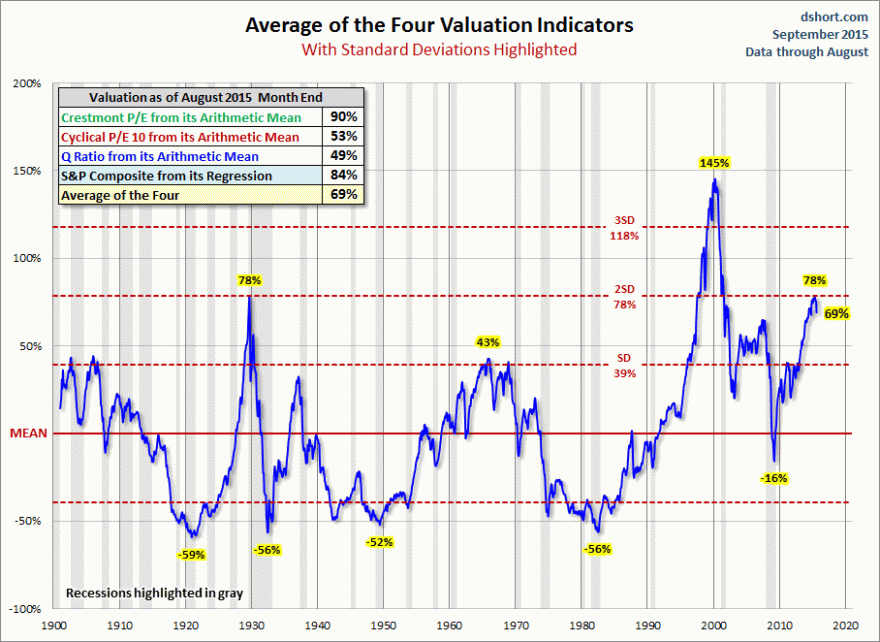
Valuations ought to end up negative, and leverage ought to be wound down from their extreme high readings:

29augu11 29augu10

Source: DShort

Which brings us to our particular environment not seen in over 50 years: ultra low rates, low inflation and overall deflationary trends. Are such valuations and leverage fair in the context of ZIRP? It’s a really useful test. If stocks are in a bear now and break down, then it will be without high rates or oil prices ‘choking the economy’ and despite QE ongoing in several major nations. It will be clearer that valuations do not need recalculating in the context of low rates and low inflation. In short, it will be much more supportive of my dumb model of the markets: demographics and solar cycles.

On that note, what I see as most important here is what has been offsetting demographic trends, namely increasing leverage. Buybacks through borrowing continue, but did so at record levels in 2007 despite stocks breaking down into a bear. Buybacks didn’t stop the collapse occurring last week. Margin debt dropped in July, and likely dropped harder in August. If stocks are to rally to new highs then leverage has to recover and make new highs too. However, what I see as likely is that a section of high leverage participants were wiped out last week and all-round appetite for high borrowing levels has been dealt a decisive blow. I very much doubt from here that leverage will make new highs.

Using Rydex as a proxy for retail, I would argue the craziness has been broken and we will now see a gradual reversion to mean.

29augu12

Looking cross-asset, I believe gold will now make a higher low than the July low and in so doing cement its new bull trend, completing the gold and equities flip at the cyclical level.

To finish, here is the SP500 big picture again. If we are in a bear then we should make lower highs and lower lows. But note that in a bear we still get some ripping rallies that test the overall downtrend.

29augu15

For now then, what’s important is that the rally of the last 3 days topples over in due course and eventually prints a lower low than October 2014 in all indices.

We have had significant geomagnetism in progress the last couple of days. It adds to the recent cluster which acts as a negative pressure on market participants.

29augu15

I am short Biotech, Russell 2000, Dow and long gold.

Is This ‘It’?

Why might it be?

The triple confluence peak of peak speculation: the new moon closest to the seasonal geomagnetic peak closest to the smoothed solar maximum: 27th June 2014. Many assets and indicators peaked then.

Screen Shot 2015-06-16 at 06.27.40Source: Stockcharts

Breadth bar cumulative advance declines peaked then too, with the latter having recently turned down.

16junn10

The global stock index has made a marginal new high since that point but the divergences in strength closely resemble previous major peaks.

16junn8The SP500 also shows a strength (and breadth) divergence that mirrors the 2011 major peak.

16junn3

The breadth in the Nasdaq measured two ways peaked out around the solar max of April 2014. There has been some improvement since but still divergent overall.

16junn6

Bullish percent / put call ratio shows one of the longest divergences, together with high yield to treasuries. Cyclicals vs defensives has repaired itself in 2015 but is overall flat for 18 months.

16junn12

NAAIM manager exposure shows a divergence similar to the run into the 2007 and 2011 peaks. It made ‘an attempt’ into the mid-2014 peak too, but as we know, the market managed to recover.

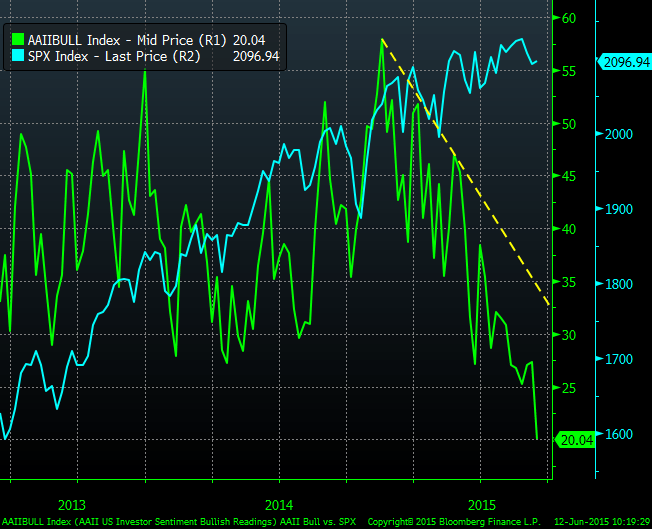
16junn4AAII bulls have also been making a divergence. Oddly though they have now reached the same level as March 2009, so that could be contrarian bullish. I’d just repeat that AAII sentiment survey has a poor predictive history hence I rarely post it.

16junn17AAII allocations – different to the above source – shows a bizarre rush to exit stocks. Don’t know what to make of that.

16junn22

Source: J Lyons

The Russell 2000 is one of the most bullish indices. But the same divergence is showing as the SP500 above.

16junn30

And it may be displaying that common pattern of historical major tops:

16junn31

In terms of its valuation, the latest p/e ex negative earnings is 22.38, which you can see versus history below.

16junn40

If we home in the Biotech sector, arguably the mania leader, we again see the same divergences as both above and prior peaks.

16junn41

In short, there are a whole host of negative divergences in strength, breadth, volatility, risk-off, sentiment and allocations for US and world stocks. The original set kicked off at the turn of 2013 into 2014, and have since been added to, with a concentration around the 27 June 2014 triple confluence peak.

I suggest there are only two ways to read it. Either all the supports for equities have been removed and they are about to tumble to ‘satisfy’ all those divergences. Or, stocks have held up despite all those divergences and so we now see breadth, strength, risk-on, etc, start to improve again, launching stocks higher. Needless to say, I side with the first option when we start to draw in valuations, allocations, leverage and other angles indicative of a major peak.

Today is the new moon at the seasonal geomagnetic mid-year peak. Either from this point or from the new moon of mid-July, stocks have the best chances of falling, with downward pressure into October.

30mays5In short, I’m on the attack, looking to build onto my short stocks positions (and long gold). I’m looking for an entry into the Russell 2000 as I believe it has the furthest to fall once equities break. I want to leave some allowance for a potential rally back up into the mid-July twin confluence peak, but until the evidence changes, the real peak was a year ago, putting equities on severely borrowed time and making yet another rally back up here doubtful.

The Dow, SP500 and NYSE all attempted a break out upwards from the 2015 range in May, which failed and now looks like a fakeout. The last chart here shows the NYSE in a rather textbook bearish formation: wedge, fakeout, breakdown, retest of wedge underside, repelled. That whole move has been building out since last July and now looks ripe for completion to the downside. I see this as another reason to be attacking here rather than waiting.

16junn50

Post Equinox

Did the mania leader, Biotech, peak out on the Equinox, 20 March?

29marc7

 Source: Stockcharts

Too early to determine, but the relevance of the Equinox is here:

29marc9

Source: Stockcharts

Not just Biotech, but the wider US markets, the Dax, the Euro-USD and gold all appear to have made tentative reversals at this Equinox. Is it going to stick? I moved back in short US stocks and long gold.

This is a stock market on borrowed time since last year’s solar maximum:

29marc

Source: Stockcharts

Screen Shot 2015-03-29 at 08.35.47

Source: UBS29marc2Source: Not_Jim_Cramer

Geomagnetism has ramped up just like at the 2000 peak:

22marc41 22marc31Earnings season kicks off 8th April. Given the negative pre-announcements and forward estimates, can this reporting season really be a buy? Unlikely.

The NYSE looks to be at the end of a topping process that has seen declining breadth, rising volatility and a gradual increase in risk-off appetite:

29marc6Source: Stockcharts

Sentiment, allocations and valuations are all saturated. Economic surprises and leading indicators are negative. Fed balance sheet expansion has ceased, and central bank actions are being revealed to be fairly impotent….

29marc1Source: Jessie Felder

In short, why would stocks not have topped out here?

We have negative pressure into the full moon of April 4th. Then earnings season gets underway. Plus that familiar topping pattern may have formed:

29marc11

29marc12

Nothing repeats exactly, but a break beneath the existing March 2015 lows this coming week looks to be key. If instead the stalling of Thurs/Fri last week lets the bulls back in this week then a more complex topping pattern could unfold. But as things stand this all looks increasingly promising to me. A key week ahead.

End Of The Mania

The irrationality continues, but not for much longer.

After last year’s solar maximum, the cross-asset picture changed. Global stocks entered into a topping range whilst money flowed into the US dollar and treasuries, plus commodities (shown inverted) collapsed, all in a deflationary recessionary wave.

22marc20Source: Stockcharts

Global leading indicators turned down from that point and are now negative, like in 2000, 2008 and 2011.

22marc22Source: Goldman Sachs

China data turned sour.

22marc2Source: Sober Look

US earnings projections and economic data diverged sharply from the stock market.

22marc21Source: Zero Hedge

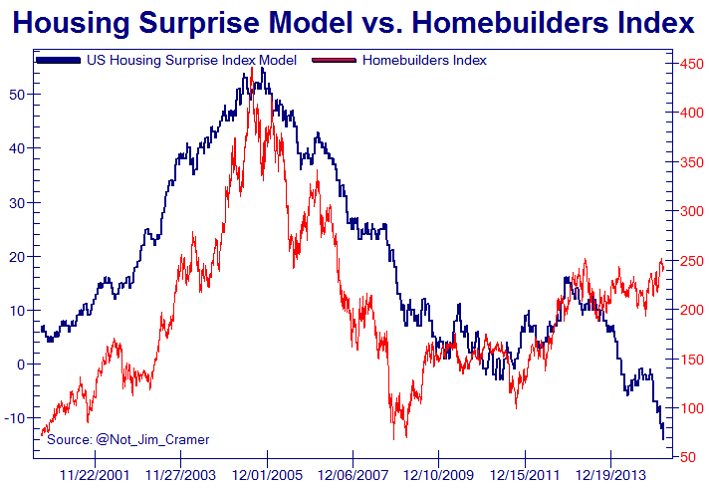
Also captured here in homebuilder stocks versus housing data.

22marc10Source: Not_Jim_Cramer

Buybacks fell away from their peak.

22marc5Source: Factset / Jessie Felder

And hedging moved contrarian.

22marc4Source: Sentimentrader / Sundial

In short, everywhere you look the footprint of the solar maximum can be seen: the subtle peaking in human excitement in terms of both economic activity and financial market speculation around mid-year 2014.

8marc13Source: Not_Jim_Cramer

15marc15

Source: SpiralCalendar

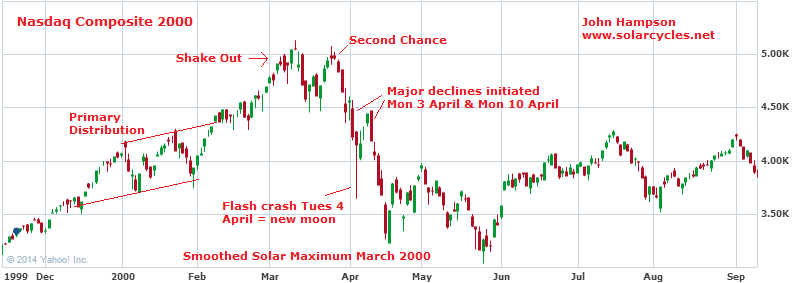
Following the solar maximum comes the peak in geomagnetic disturbance which adds to the negativity. See here the major storms (red downward spikes) of July and August 2000 which coincided with the SP500 reversal, all following the solar maximum of March 2000.

22marc31

This last week saw a similar occurence of a major geomagnetic storm, the massive red spike down on the right:

22marc41

Put into a trend, geomagnetism has been diverging from the stock market since mid-2014, like the rest, and that storming serves to steepen the trend.

22marc42

The TR-CRB commodities index has tracked the trend well. This is reality, whilst stocks are in a mania prone to a major reset.

22marc44

Back in 2000, the SP500 finally gave up its levitation on 1st September. We probably don’t want to focus too much on the timing of that lag, but instead note that we have the same comprehensive leading removal of supports: solar maximum peaked; geomagnetism intensified; divergent earnings and economic indicators; buybacks and combined central bank printing peaked; saturation in allocations, sentiment and valuations; commercials and hedgers short; money flows into bonds and dollar.

With hindsight we can look back on the first half of 2014 as too soon for a peak in the mania as the solar maximum wasn’t yet done, but with a host of warning flags present in allocations, sentiment, leverage, valuations and more. We can look back on the second half of 2014 and see a typical topping process in a whole range of indicators: negative divergences in breadth and volatility, declining forward earnings and leading indicators, a deflationary wave in other assets and economic data, all occurring whilst price continued to levitate. And, I believe, we can look back on Q1 2015 as the completion of the missing pieces of the puzzle: commercials go short, insiders press sell, geomagnetism ramps up, data surprises to the downside more than expected.

22marc40

Q2 2015 then should look like this: economic data doesn’t improve, realisation that earnings and leading indicators are staying divergent, geomagnetism continues to pester and turn the tanker of sentiment, stocks start to decline and in turn recession models start to wake up.

A host of leading indicators for the stock market suggest equities are overdue the major reversal, and it’s hard to find ‘fuel’ for prices to continue to rise into mid-year given the all-round picture from indicators, namely saturation and divergences. I therefore have not given up on the March-April seasonal low: a sharp leg down from here to kick off the bear market. Let’s see how this week unfolds: we need to see the telling price reversal, and until then patience needs to be maintained.

3 Exact Dates

As we wait for the ECB decision and market reaction, I see 3 exact dates being revealed that align with my ‘triple confluence peaks’ idea, i.e. we are seeing major market peaks form at the new moons closest to the geomagnetic seasonal highs (inverted) closest to the smoothed solar maximum.

The smoothed solar max is likely to have been around April 2014.

22janu14

The seasonal peaks (inverted geomagnetism) fall at the turn of the year and mid-year.

22janu1

The new moons closest to these seasonal peaks were 1 January 2014, 27 June 2014 and 22 December 2014, so it follows that we should see major speculation peaks at these dates in the year of the solar maximum, 2014.

Bullish percent to call/put, cyclicals to defensives, high yield to treasuries and small cap equities to bonds all peaked very close to the 1 January 2014 date.

22janu2Stocks:dollar, stocks:bonds, FTSE Eurostox and NYSE composite indices, NSYE breadth, volatility and junk:treasury bonds, oil, US dollar (inverted), leveraged loans and junk bonds all peaked very close to the 27 June 2014 date.

22janu7 22janu5

22janu3

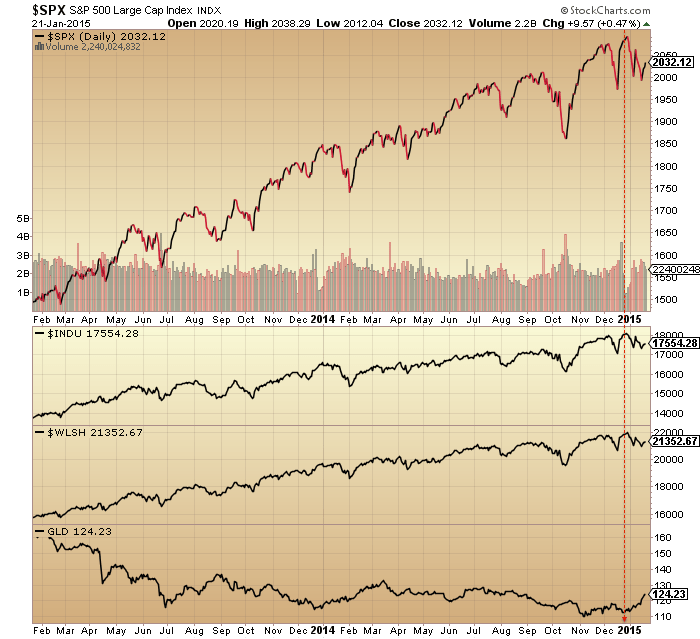
The final date, 22 December, has tentatively topped out the remaining key indices and speculation measures, namely SP500, Dow and Wilshire 5000 (plus an associated bottom in gold) and a blow-off top in sentiment and allocations.

22janu4 22janu6If this ‘dumb’ model of the markets is correct then we should make no new highs from here but rather collapse to a March/April initial bear market bottom (first leg down).

If an anomaly is at hand and the solar max is still ahead or speculation somehow extends further in time, then the next logical peak would be mid-year 2015, likely June 16. However, I rate this possibility as negligible. Look again at the risk measures that changed course Jan 1 2014: they remain in downtrends ever since. Add to these the large range of assets and indicators that peaked June 27 and remain in downtrends ever since too. Then consider the change in market and cross-asset behaviour since the final date, Dec 22, together with that capitulation in sentiment and allocations. This has to be game over, in my opinion. However, if we consider it a game in which central banks can cheat and change the rules, then maybe, just maybe, natural forces can less freely flow through the markets. I don’t think this is likely as central bank members are solar subjects too. However, this is subject to confirmation in a critical real time test in 2014-2015. Market reaction over the next few days to the ECB announcement will be a key tell.


Solar Models

Solar maxima generate speculation peaks. The latest smoothed solar maximum is likely to have been April 2014. The chief speculation target has been equities, particularly US equities. That mania is demonstrated in valuations, sentiment, allocations, leverage and more. A speculative mania has indeed been delivered at a sunspot maximum again.

The chart looks like this:

13janu3

If we substitute the Dax for the SP500, the aligned peaking looks clearer:

13janu4

But where is the subsequent collapse? It really has to occur within the window January to April 2015 to be both within acceptable range and normal seasonality, with the latter guided by the sun’s second tool, geomagnetism:

30dec12

As things stand, the set-up is as compelling as it could be for this to occur. Global growth proxies, oil and copper, are collapsing. Bond yields are reaching for record lows and yield curves flattening. Volatility is in an uptrend. The US dollar has surged in a deflation wave. Earnings forecasts have been slashed on the moves in oil and the dollar. Plus, the key ingredients for a collapse remain in place, namely excess leverage, very lopsided sentiment and allocations, and a wide range of negative divergences.

Additionally, the real (actual) geomagnetic trend has intensified since August 2014. Here is the commodities index versus trend geomagnetism for the last 6 years. Note the geomagnetism is inverted as higher geomagnetism is negative for sentiment. We see geomagnetism has helped drag down commodities over the last several months.

13janu7

However, when we look at equities, we see them levitating away from the model in an 18 month mania:

13janu6

Combining equities with commodities we see the mania from another angle:

13janu2

The similarities with 2000 are notable. Back in 1998-2000, we saw a similar pulling away from the geomagnetic model. Eventually stocks were dragged back to it, in a post-mania bear:

13janu9

Note how the geomagnetic trend intensified downwards in the second half of 2000. This would have played a role in popping the uptrend in equities, as it tugged downwards on sentiment, and ought to play the same role now given the steepening over the last several months.

I maintain the parallels with 1937. Ultra low rates and QE, deflationary pressures, excessive valuation into the next solar maximum following the demographic peak. We should be heading for a major low in equities several years from now at the next solar minimum. Top chart from S. Tarassov.

12janu5


Triple Confluence Peaks

People unwittingly buy into new moons and sell into full moons (typically, not always).

5nov30

People perhaps a little more consciously buy and sell seasonally, but unaware they are being guided by geomagnetism. Again this is more often than not, rather than every time.

5nov40

And people unwittingly buy into solar sunspot maxima, typically or normally.

9nov22

Therefore, it should follow that looking for the new moon which falls closest to the inverted geomagnetic seasonal peak which falls closest to the smoothed solar maximum ought to lead us to a major market peak, in a triple confluence of ‘peak’ buying (within the month, within the year and within the decade, respectively).

Considering the last 5 solar cycles then gives us five exact dates over the last 50 years. They are:

A) SC20: 19 Dec 1968

B) SC21: 17 Jan 1980

C) SC22: 3 July 1989

D) SC23: 6 Jan 2000

E) SC24: 27 June 2014

Did a major market peak fall close to any of these dates? Yes indeed…

A) Major Dow and FTSE bull market peaks in December 1968, two weeks from the date.

5nov25Source: FiendBear

B) Major gold and silver peaks 21 January 1980, 4 days from the date.

5nov24Source: Greshams-Law

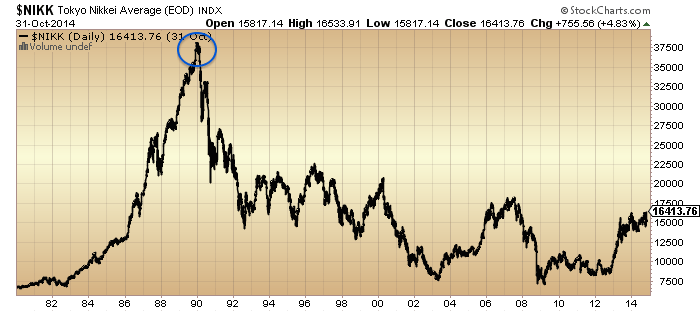
C) The Nikkei peaked 29 Dec 1989. The new moon closest to the inverted seasonal geomagnetic peak after the smoothed solar max was 31 Dec 1989, 2 days away. In other words, the rule worked but on the seasonal peak after rather than before the smoothed solar max.

5nov20

D) Major bull market peaks in FTSE 31 Dec 1999 and Dow 14 Jan 2000, both within 8 days of the date.

5nov26

E) Our current scenario. Rather a lot peaked or reversed direction around the date of 27 June 2014:

Stocks:Dollar, Stocks:Treasuries, Junk Bonds and Junk Bonds:Treasuries

10janu1

NYSE Composite, NYSE breadth, Volatility (inverted) and Crude Oil10janu2

NYSE Cumulative Advance-Declines, Dow breadth, SP500 breadth, Nasdaq breadth:10janu3

FTSE, CAC, DAX and Euro Stoxx indices10janu5

US Dollar (inverted), SP500 Bullish Percent, Leveraged Loans and Copper
10janu8

Not only this, but the combined central bank balance sheet expansion of Fed, ECB and BoJ peaked out around this time, as we might expect given the sun should be guiding them too.

Plus, drawing on the Nikkei 1989 experience, if we also look at the geomagnetic seasonal peak that fell at the end of the year 2014, then the new moon was 22 Dec, and the Dow and SP500 peaked very close to this as things stand.

In short, if the stock market is as ‘dumb’ a mechanism as this, then there should be no new highs ahead in any of the indices or indicators listed. The three solar influences of sunspots, geomagnetism and lunar phasing (nocturnal illumination by the sun) silently guided the markets to a peak.

The caveat for this is that solar models are correct and the smoothed solar max is behind us.

So, in the near term, the move up of Wed and Thu last week should be repelled before new highs are reached. Friday’s move down may be the start of that. However, the new moon of Jan 20 is still a high on the geomagnetic model (the last high before we tumble down to the March/April lows) so falls in earnest may potentially wait until after that. The Nikkei in 1990 tumbled in earnest once February hit.