

Why might it be?
The triple confluence peak of peak speculation: the new moon closest to the seasonal geomagnetic peak closest to the smoothed solar maximum: 27th June 2014. Many assets and indicators peaked then.
 Source: Stockcharts
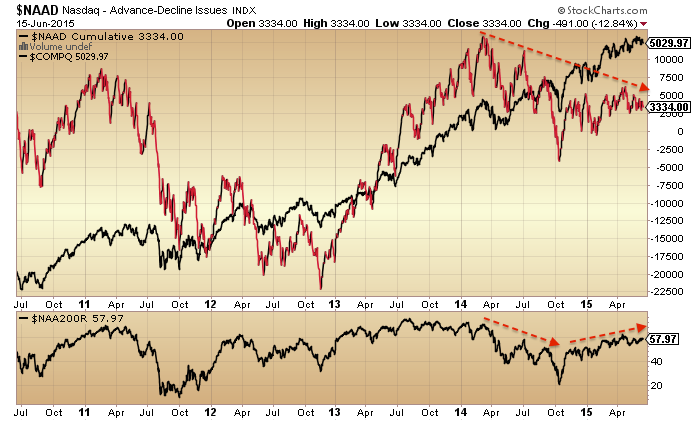
Breadth bar cumulative advance declines peaked then too, with the latter having recently turned down.

The global stock index has made a marginal new high since that point but the divergences in strength closely resemble previous major peaks.
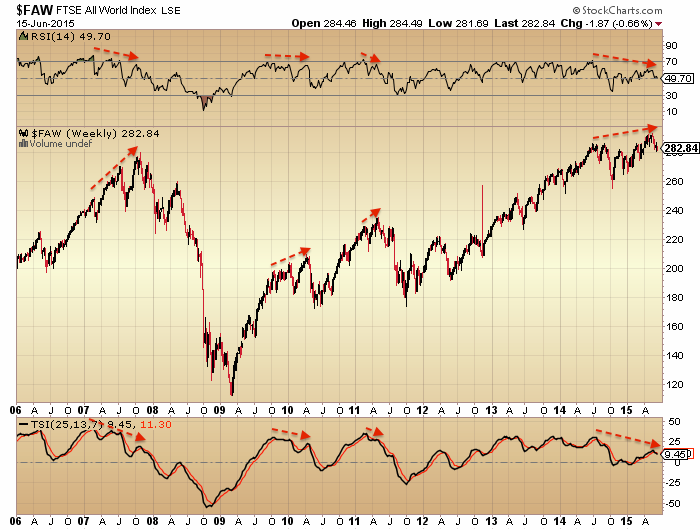 The SP500 also shows a strength (and breadth) divergence that mirrors the 2011 major peak.

The breadth in the Nasdaq measured two ways peaked out around the solar max of April 2014. There has been some improvement since but still divergent overall.
Bullish percent / put call ratio shows one of the longest divergences, together with high yield to treasuries. Cyclicals vs defensives has repaired itself in 2015 but is overall flat for 18 months.

NAAIM manager exposure shows a divergence similar to the run into the 2007 and 2011 peaks. It made ‘an attempt’ into the mid-2014 peak too, but as we know, the market managed to recover.
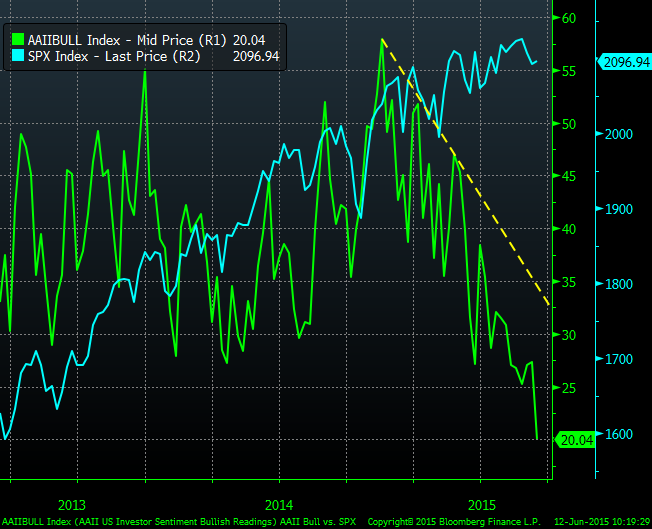
 AAII bulls have also been making a divergence. Oddly though they have now reached the same level as March 2009, so that could be contrarian bullish. I’d just repeat that AAII sentiment survey has a poor predictive history hence I rarely post it.
 AAII allocations – different to the above source – shows a bizarre rush to exit stocks. Don’t know what to make of that.

Source: J Lyons
The Russell 2000 is one of the most bullish indices. But the same divergence is showing as the SP500 above.

And it may be displaying that common pattern of historical major tops:

In terms of its valuation, the latest p/e ex negative earnings is 22.38, which you can see versus history below.

If we home in the Biotech sector, arguably the mania leader, we again see the same divergences as both above and prior peaks.

In short, there are a whole host of negative divergences in strength, breadth, volatility, risk-off, sentiment and allocations for US and world stocks. The original set kicked off at the turn of 2013 into 2014, and have since been added to, with a concentration around the 27 June 2014 triple confluence peak.
I suggest there are only two ways to read it. Either all the supports for equities have been removed and they are about to tumble to ‘satisfy’ all those divergences. Or, stocks have held up despite all those divergences and so we now see breadth, strength, risk-on, etc, start to improve again, launching stocks higher. Needless to say, I side with the first option when we start to draw in valuations, allocations, leverage and other angles indicative of a major peak.
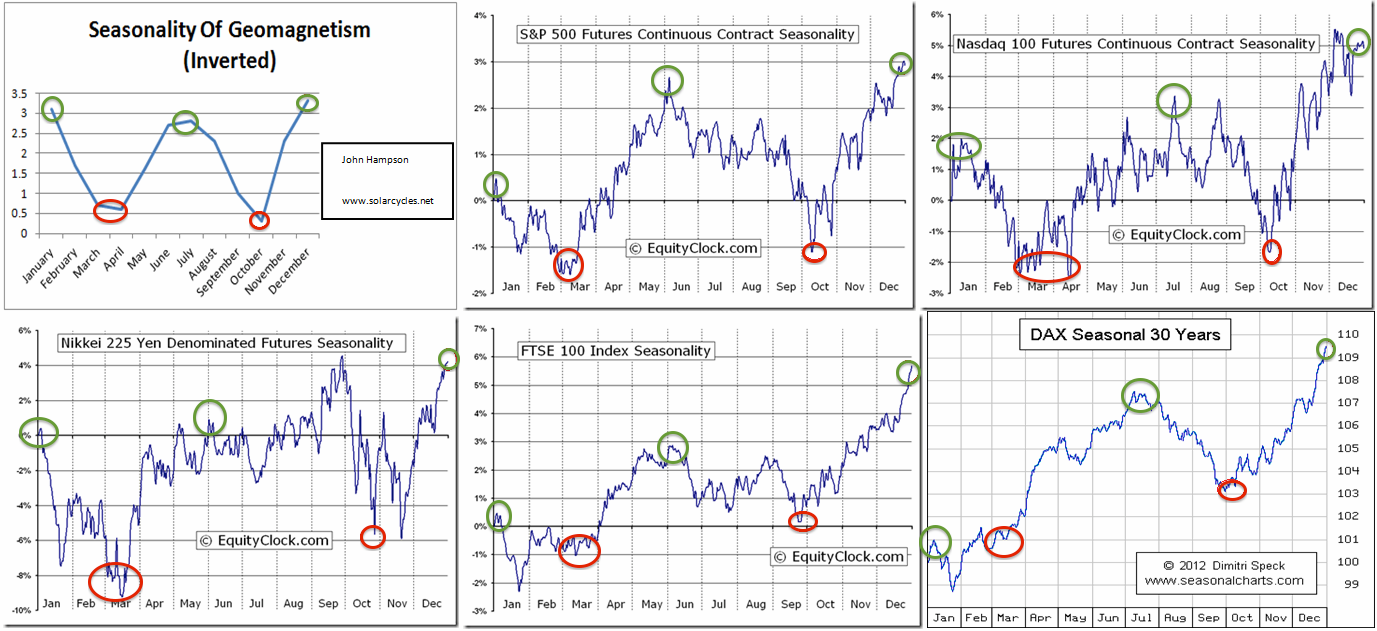
Today is the new moon at the seasonal geomagnetic mid-year peak. Either from this point or from the new moon of mid-July, stocks have the best chances of falling, with downward pressure into October.
 In short, I’m on the attack, looking to build onto my short stocks positions (and long gold). I’m looking for an entry into the Russell 2000 as I believe it has the furthest to fall once equities break. I want to leave some allowance for a potential rally back up into the mid-July twin confluence peak, but until the evidence changes, the real peak was a year ago, putting equities on severely borrowed time and making yet another rally back up here doubtful.
The Dow, SP500 and NYSE all attempted a break out upwards from the 2015 range in May, which failed and now looks like a fakeout. The last chart here shows the NYSE in a rather textbook bearish formation: wedge, fakeout, breakdown, retest of wedge underside, repelled. That whole move has been building out since last July and now looks ripe for completion to the downside. I see this as another reason to be attacking here rather than waiting.


The US indices are definately looking very bearish (but have been for quite a while, and I continue to believe a top/crash is still too obvious to happen yet).
SP500 has formed a very similar pattern during 2015 H1 to 1929 H1. And SC24 timing has closely mirrored that of SC16. In this simple Dow chart we are now exactly at early June 1929, when Dow formed that last temporary fakedown around 300: http://kingworldnews.com/wp-content/uploads/2015/06/KWN-Pento-I-6142015.jpg
So basically a parabolic lift higher before we top –
I think another move higher is more likely than a crash. When the Greeks reach a deal it will give markets a boost and then it’s up to the Bulls to keep the momentum going. I cannot see US markets making much more headway but still believe Europe is where most of the gains will come before a large equity correction. A crash in my eyes is a 35% plus drop and I don’t think that will happen.
Not too hard for all of us then. Buy if IBB makes new highs and sell if IBB goes under 50SMA.
JH, excellent article which makes the bearish case quite clearly. Should be interesting summer.
I am looking for unusual weakness until 8/10, and then up trend till at least Dec 1. Cycles Saturn in Sag say market may mania bubble til 2017, tho’ 1986, 1957, 1928 rallies don’t guarantee we get a rally here, esp. with high valuations.
Can you explain what Saturn in Sag means? I am really a newbie.
Saturn is a biggie in planetary size and history. Sagitarius (Sag) is home of galactic center (60 million suns of energy). When Sat moves into Sag, there may be an enhancement of galactic energy into the Sun, and by extension to all of the planets.
How often is Saturn in Sag, and how long will it stay here? Are there twelve signs in total for Saturn to rotate amongst?
I am more familiar with the Chinese astrology, with the 12 animals, 5 metals and 2 yin-yang polarities. It has something to do with a common multiple of Jupiter 12 years and Saturn 30 year orbital periods.
Saturn has 29.5 year orbit. Zodiac has 12 signs. Divided equals 2.5 years per sign. GC is located in Sag. Sat entered Sag and is set to exit in about 2 years from today. Last times this happened in 1928, 1957, 1986 there were prolonged rallies. Also, several manias in history tulip mania, south sea bubble, and one or two others were in or around Sat in Sag. I am not using this to trade by itself but if it plays out, when Sat leaves Sag, would look for a resetting. I am an amateur Chinese Astrologer so any info. you have connecting market performance to it would be appreciated. I know about the year performance in each sign, and the heavenly stem month effect, but would be interested in the hourly effects for intraday trading. If you want exact entry exit dates for Saturns position you can easily find it by googling “Saturn in Sagitarius”.
Thanks valley. I only know the Chinese bazi system for reading personal fortune, and I have no have any luck finding a connection to the market. In terms of intraday, it would be based on the time-zone where you are born, and so I don’t think the system would work for the global markets.
Thanks JH.
While IWM/IBB held up better this month while the SPX broke down 50SMA, I had pointed that the same could be said for Nikkei and SPX in 1/1990 through mid-2/1990.
And how are Japanese equities in any way related to USA equities? Bullish and bearish divergences work best primarily with similar asset classes and related indicators.
In this era of global money flows, carry trades and elevated leverage due to worldwide QE programs, I think a great deal can be learned from reviewing different asset classes.
I am looking for something like 10-20% from ATH which has started, but we will see how far we get…..
J
FTSE100 fibbing? http://barestbodkins.blogspot.com/
Some backtesting imho, lets see whether we get follow through or continuation. Shame my DAX long got stopped out early on:D
J
Hardly anyone expecting the full bear, but I am with JH, that’s what is in progress already.
Last few weeks to buy cheap gold, or its miners. $3k gold within 2 years.
I would bet $10 that best place to acquire gold or miners will be between July 10 and August 10. Then agree especially miners may have epic run into fall.
“I read dozens of newsletters and market advisories and almost all of them are scratching their heads as they attempt to call a top to this bull market…I’ve never seen a top formed when so many advisors are searching for a top”.
(Richard Russell 3 June 2015)
Positioning is all that matters. Not talk.
Voice of a pro there. Spot on.
I’m sure everyone would agree with Bluestar’s comment about the importance of positioning versus talk – although anyone who has been betting against the US stock markets for months on end will need no reminder.
GM – I don’t think you can see the irony, can you? You have stated on several occasions that you do not trade and have no positions in those stock markets – so when you talk about “expecting the full bear”, it is, in your case, literally all talk!
Mark, I invest medium to long term, rather than trade short term.
There is no irony. You are prone to anger I notice. Be careful.
For the record, I manage an eight figure sum for clients. No big deal.
BTFD was oh-so-predictable with the new moon, as well as the technical setup, no?
The gradient of the up-trend does appear to be waning tho, although I wouldn’t be surprised to scrape new ATHs from here, given the corrective look of the drop from 2134.72 – SPX daily: http://schrts.co/AW0O8v
actually, if you’re into BTFD, you would do that on the Full Moon. New Moon is the time to sell.
Yup
Perhaps, but we were not at a high, so… Any moon at a high/low signals the potential for trend change, non?
Meanwhile, BTC (which everyone has forgotten) is having a big up-day today
Did everyone forget, or does no one care?
Well, Mr Hampson did reference the peak in BTC as evidence for a speculative peak, so I thought it might be of interest.
Another new post…