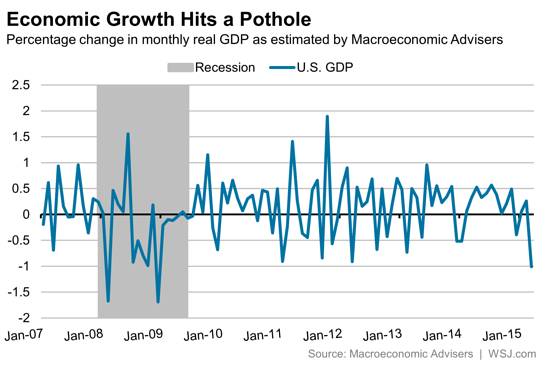
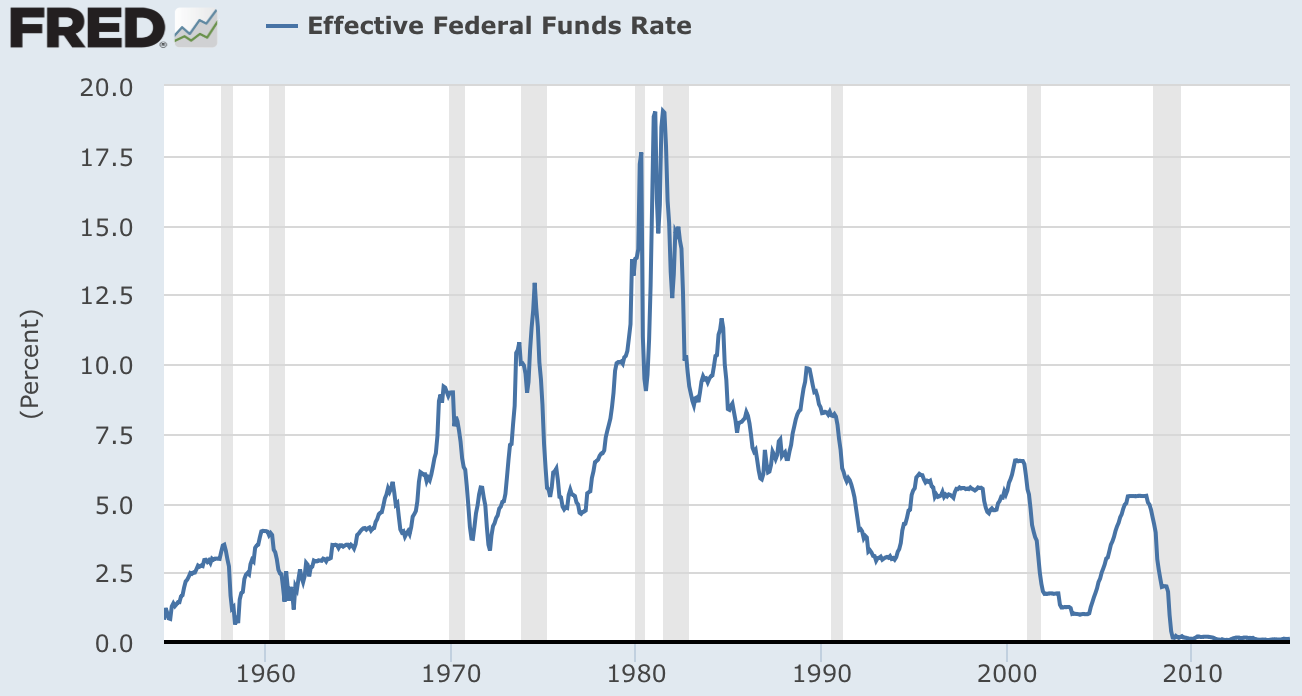
Ever since 2009 analysts in the developed world have largely expected a return to ‘normal’ economic growth and inflation, the kind that necessitates a gradual tightening of interest rates to keep overheating in check. This is based on patterns over the last 50 years following recessions. Yet, as the US chart below shows, something has gone wrong this time, with rates at zero, six years on.
Source: Fred
Not only that but central banks are still generally easing around the world:
 Source: Charlie Bilello
There are two reasons why global economic growth and inflation aren’t normalising: debt and demographics in the developed nations where world GDP is concentrated. When debt gets too large, too much capital has to be deployed on servicing the debt, redirected away from productive uses. When demographic trends aren’t favourable they can make for deflationary, recessionary pressures, and what is so potent about the current period is that demographics are united negative in the major nations, as per this sobering composite:
 Consequently, central banks are battling to prevent recession and deflation. What does this mean for equities? The stock market has front-run a return to normal growth. As normal growth hasn’t happened, equities are now right at the top end of historic valuations. Each year since 2009 analysts have laid out their predictions for 10% earnings growth and over 3% GDP growth (US), only to see the reality fall short each time. But, the reality hasn’t yet been too dire either, and some would call this a goldilocks scenario for stocks: disinflation but no deflation, meagre growth but positive, monetary conditions kept easy and supportive. So the question going forward is whether this can be maintained.
Last year Q1 US GDP came in negative but the rest of the year recovered. This year the same has happened and whilst there is a question mark against Q2, leading indicators predict a recovery later in the year for the US and for improvement in Europe. However, there was an additional major factor last year: the solar maximum. Speculation and economic activity typically rise into the solar max and recede afterwards.
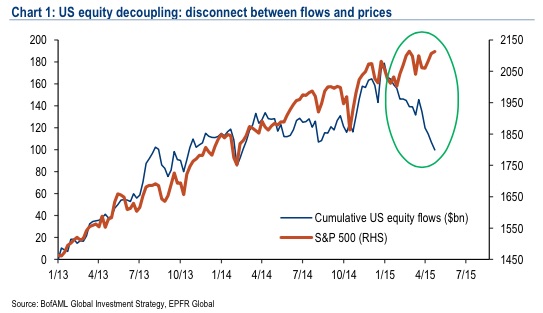
Currently, the stock market is holding things together due to its wealth effect. A stocks bear would tip the fragile global economy into outright recession and deflation. There is a yawning gap between equity valuations and economic reality, but the common view amongst analysts remains that central bank actions and the ‘normal’ business cycle of the last 50 years will yet produce the return to economic growth and inflation and that we have both a series of rate rises and problematic commodity prices to the upside to go through yet before stocks are in danger.
However, if we look back to the 1930s US or 1990s Japan then we see evidence of a different ‘normal’ in which deflationary recessions and stock bears did occur despite easy conditions in place by central banks. In both cases the yawning gap between equity valuations and persisting economic trouble was ultimately closed. The recent collapse in oil prices and cash flows into increasingly negative yielding bonds reflect bad economic realities, to which the stock market appears to be the last to catch on.
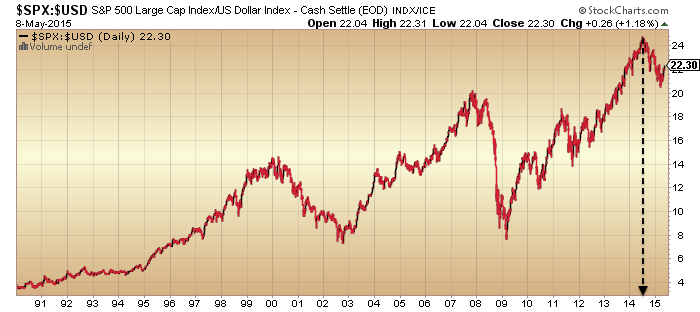
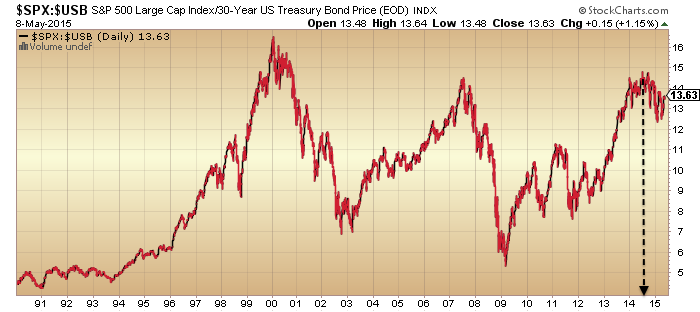
What are the odds of the stock market catching on by range trading sideways for a long period, as it has for much of 2015 so far? The answer is slim. Similar instances in the past of post solar max extreme valuation, sentiment, leverage and allocations, were not only resolved by bear markets, but by the worst bear markets in history. Here is another angle on that:
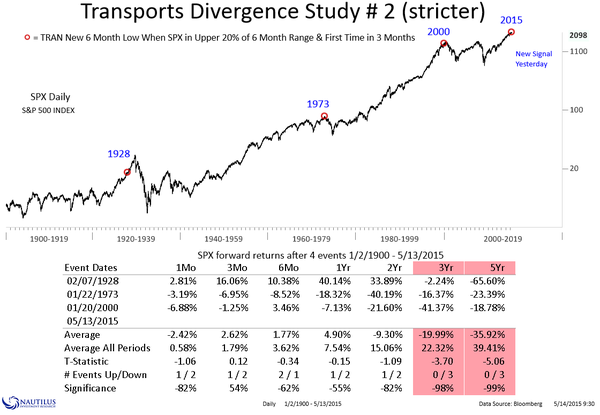 Source: Nautilus
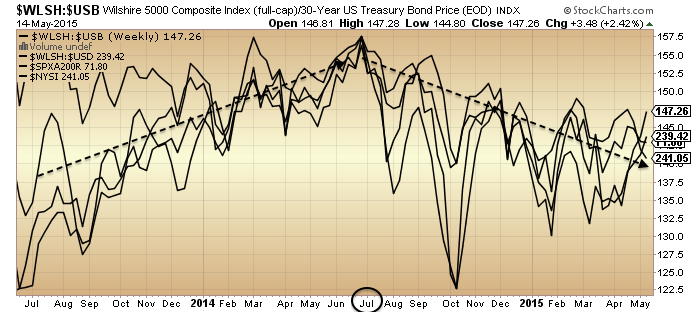
We also see the evidence under-the-hood that the solar max of last year was indeed the game-changer in equities:
 Whilst economic data is disappointing to the downside in the period since too.
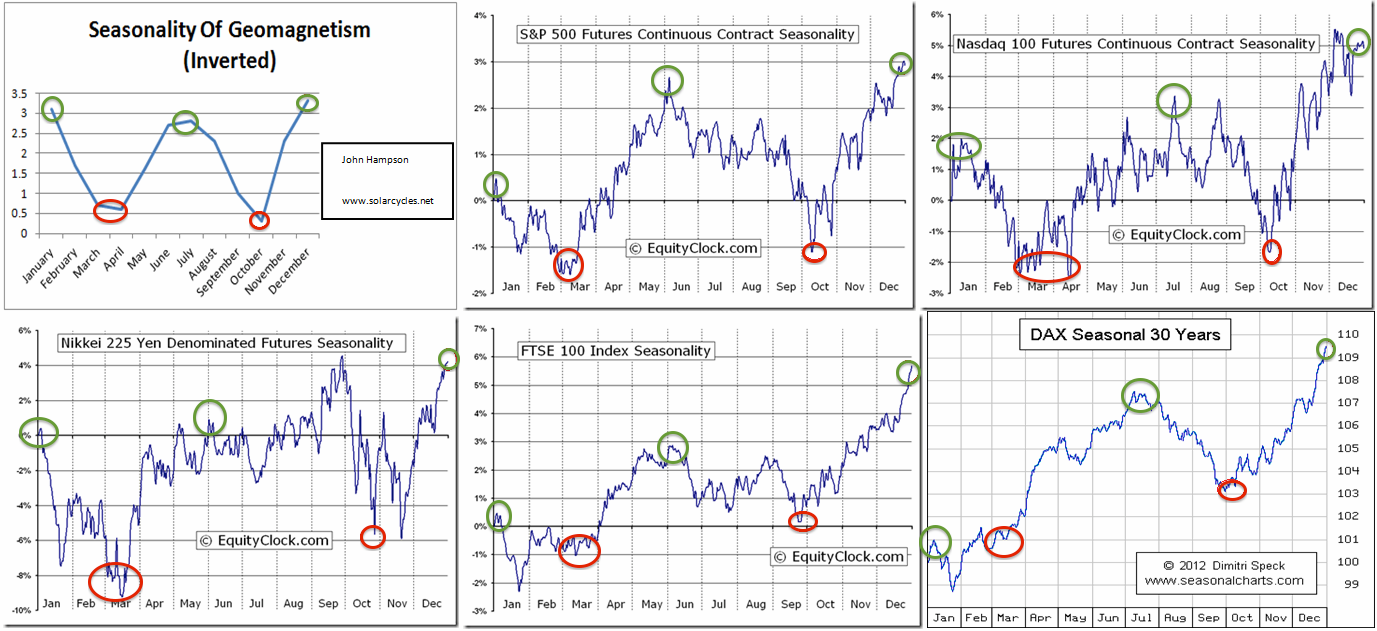
We have reached the geomagnetic seasonal mid-year point which has been a typical high marker in equities historically:
 And technically we have seen a narrowing price range on waning strength and breadth.
 Source: Stockcharts
Plus we see compressed volatility and gold making a long bottoming pattern on increasing strength.
In short, I’m going to continue to attack here (short equities, long gold) because the case is strong. The main concern I have is the upturn in leading indicators (real money, ECRI), because I can’t rule out the possibility that once economic surprises start to improve again then the ageing bull gets a little refuel. However, real money leading indicators again predict this to be a transient improvement, still not the return to ‘normal’ growth, and at some point that belated realisation that normal growth isn’t coming back is going to make the max-leverage, max-bullish, max valuation stock market a house of cards, due to the exceptional skewing and distortion. Odds are this is the time, given (1) the under-the-hood peaking in indicators at the solar max of last year, (2) the current strength/breadth divergences like in 2011, (3) the mid-year seasonal geomagnetic peak, and (4) the likely disappointing data still to come out over the next few weeks. A sharp drop in equities would negate the leading indicator improvement ahead, so that’s what has to be delivered here, to give the bear case the decisive control.