
Ever since 2009 analysts in the developed world have largely expected a return to ‘normal’ economic growth and inflation, the kind that necessitates a gradual tightening of interest rates to keep overheating in check. This is based on patterns over the last 50 years following recessions. Yet, as the US chart below shows, something has gone wrong this time, with rates at zero, six years on.
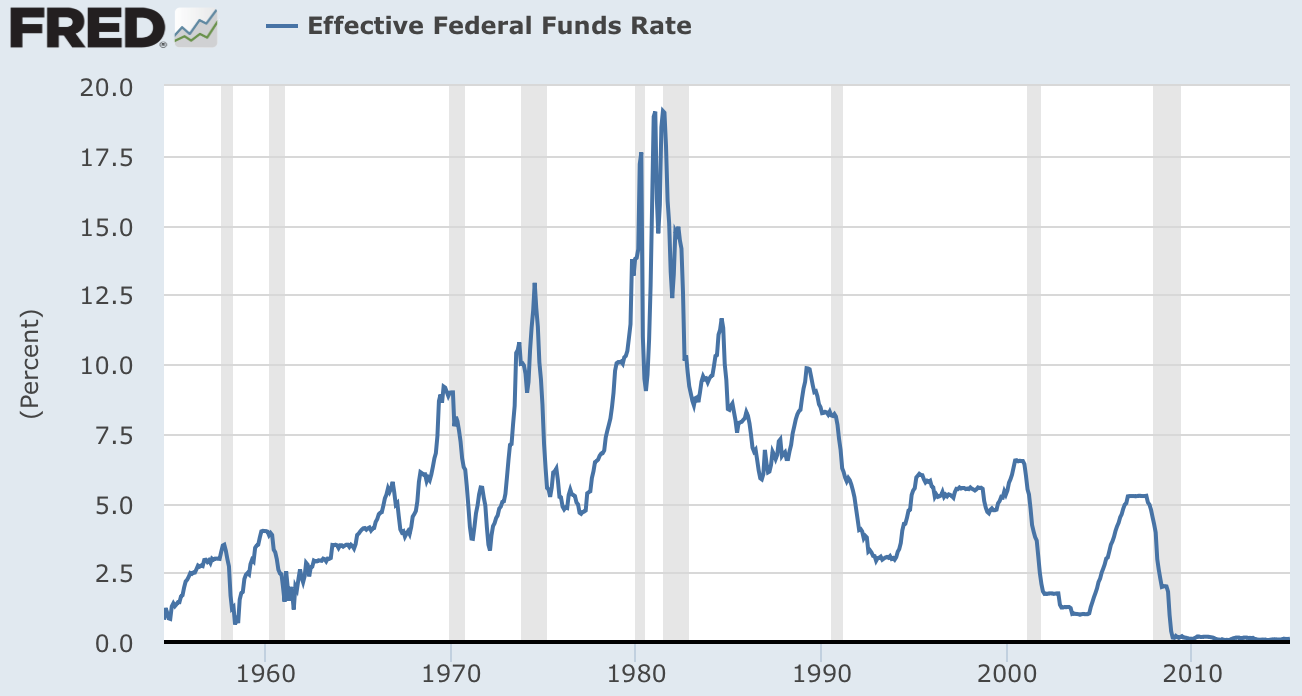
Source: Fred
Not only that but central banks are still generally easing around the world:
 Source: Charlie Bilello
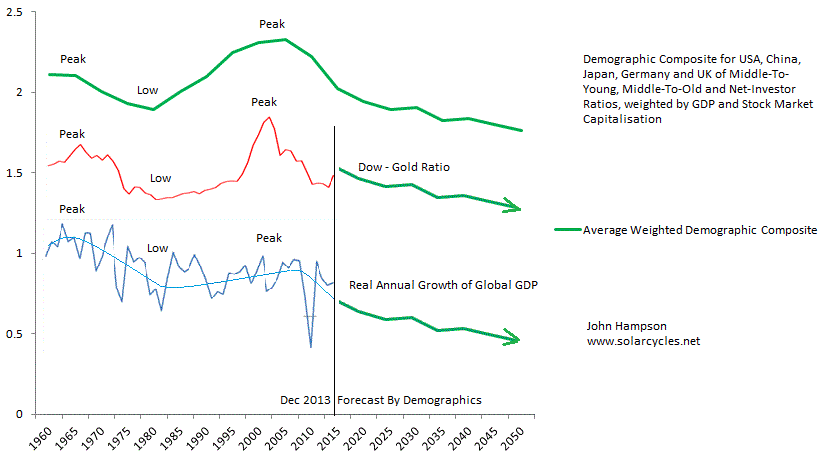
There are two reasons why global economic growth and inflation aren’t normalising: debt and demographics in the developed nations where world GDP is concentrated. When debt gets too large, too much capital has to be deployed on servicing the debt, redirected away from productive uses. When demographic trends aren’t favourable they can make for deflationary, recessionary pressures, and what is so potent about the current period is that demographics are united negative in the major nations, as per this sobering composite:
 Consequently, central banks are battling to prevent recession and deflation. What does this mean for equities? The stock market has front-run a return to normal growth. As normal growth hasn’t happened, equities are now right at the top end of historic valuations. Each year since 2009 analysts have laid out their predictions for 10% earnings growth and over 3% GDP growth (US), only to see the reality fall short each time. But, the reality hasn’t yet been too dire either, and some would call this a goldilocks scenario for stocks: disinflation but no deflation, meagre growth but positive, monetary conditions kept easy and supportive. So the question going forward is whether this can be maintained.
Last year Q1 US GDP came in negative but the rest of the year recovered. This year the same has happened and whilst there is a question mark against Q2, leading indicators predict a recovery later in the year for the US and for improvement in Europe. However, there was an additional major factor last year: the solar maximum. Speculation and economic activity typically rise into the solar max and recede afterwards.
Currently, the stock market is holding things together due to its wealth effect. A stocks bear would tip the fragile global economy into outright recession and deflation. There is a yawning gap between equity valuations and economic reality, but the common view amongst analysts remains that central bank actions and the ‘normal’ business cycle of the last 50 years will yet produce the return to economic growth and inflation and that we have both a series of rate rises and problematic commodity prices to the upside to go through yet before stocks are in danger.
However, if we look back to the 1930s US or 1990s Japan then we see evidence of a different ‘normal’ in which deflationary recessions and stock bears did occur despite easy conditions in place by central banks. In both cases the yawning gap between equity valuations and persisting economic trouble was ultimately closed. The recent collapse in oil prices and cash flows into increasingly negative yielding bonds reflect bad economic realities, to which the stock market appears to be the last to catch on.
What are the odds of the stock market catching on by range trading sideways for a long period, as it has for much of 2015 so far? The answer is slim. Similar instances in the past of post solar max extreme valuation, sentiment, leverage and allocations, were not only resolved by bear markets, but by the worst bear markets in history. Here is another angle on that:
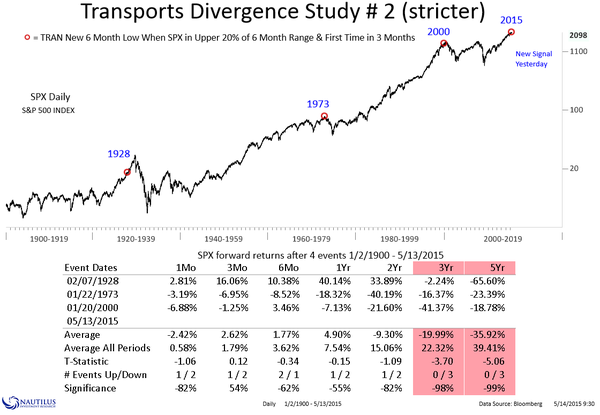 Source: Nautilus
We also see the evidence under-the-hood that the solar max of last year was indeed the game-changer in equities:
 Whilst economic data is disappointing to the downside in the period since too.
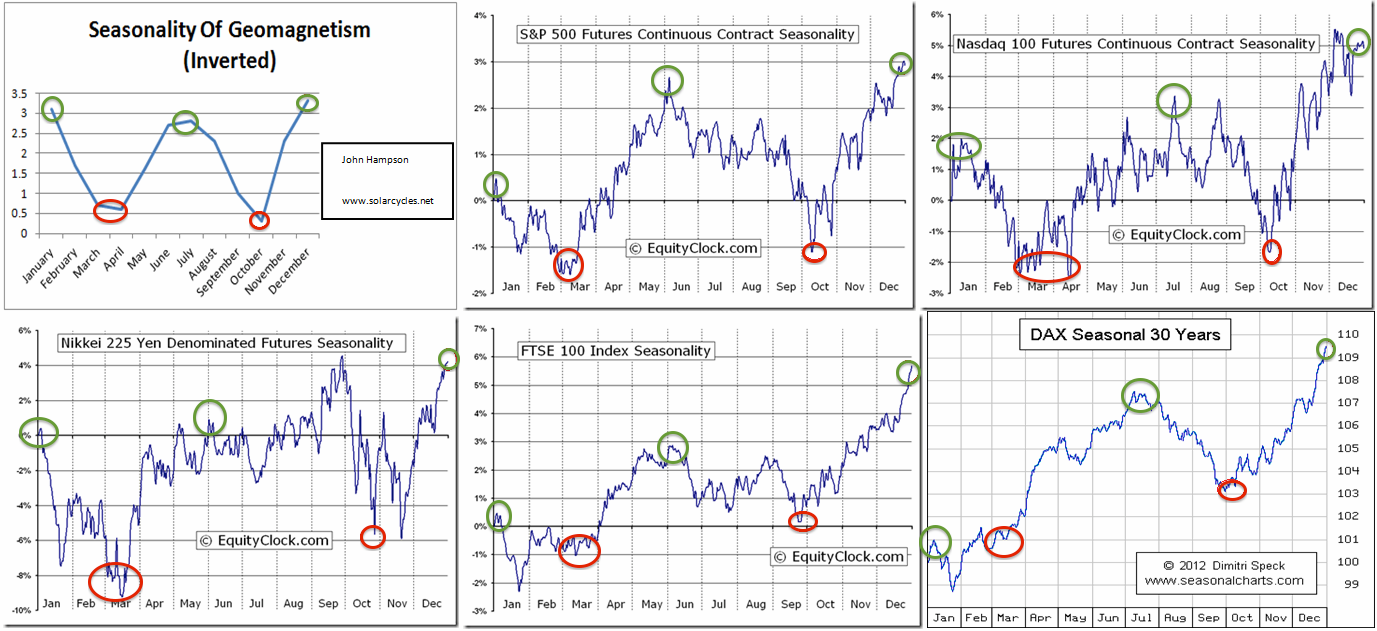
We have reached the geomagnetic seasonal mid-year point which has been a typical high marker in equities historically:
 And technically we have seen a narrowing price range on waning strength and breadth.
 Source: Stockcharts
Plus we see compressed volatility and gold making a long bottoming pattern on increasing strength.
In short, I’m going to continue to attack here (short equities, long gold) because the case is strong. The main concern I have is the upturn in leading indicators (real money, ECRI), because I can’t rule out the possibility that once economic surprises start to improve again then the ageing bull gets a little refuel. However, real money leading indicators again predict this to be a transient improvement, still not the return to ‘normal’ growth, and at some point that belated realisation that normal growth isn’t coming back is going to make the max-leverage, max-bullish, max valuation stock market a house of cards, due to the exceptional skewing and distortion. Odds are this is the time, given (1) the under-the-hood peaking in indicators at the solar max of last year, (2) the current strength/breadth divergences like in 2011, (3) the mid-year seasonal geomagnetic peak, and (4) the likely disappointing data still to come out over the next few weeks. A sharp drop in equities would negate the leading indicator improvement ahead, so that’s what has to be delivered here, to give the bear case the decisive control.

I do my Armstrong models from major turns NOT fixed dates.
I split into 1/8ths as per his H&S pattern.
You turns at 2/8ths 3/8 4/8 5/8 6/8 and 8/8ths.
The chart below shows up to 6/8ths with that mid Aug 2015.
Interestingly, the full 8.6 years ends Oct 11 2017.
Yep, 10 years exactly from 2007 top and 1 day more than 15 years from 2002 low.
What a coincidence !!!
I have repeated this as my original post was last on last thread.
nice work…thanks for sharing it!
One of the turns was out 3 trading days and one other 4 trading days. Allow that in August.
So its 18/08/2015 +/- 4 trading days.
Yes date format is what the rest of the world uses.
DD/MM/YYYY.
Why would you mix up date sequence ?
Its either lowest to highest as in DDMMYY or reverse as YYMMDD.
The US idea of MMDDYY just makes a mockery of trying to sort data.
“The US idea of MMDDYY just makes a mockery of trying to sort data”
With ya 100% on that. I’ve never understood why the US changed the sequence?
Logic tells you that DD/MM//YYYY is the natural order! No offence to US posters, the US still can’t move itself to the metric system, but that is the fault not of the people.
The US military dd/mm/yyyy. I always thought that was more logical than mm/dd/yyyy but that is the way most people speak – Jun 5th not 5 Jun. Thus the US does it the way people speak predominantly. Why we speak that way, don’t know.
why does the US use inches, feet, and yards; ounces and pounds?
Reblogged this on thedarklordblog.
Primary wave 4 has commenced. It is indicated for a sharp abc corrective form. From the SPX ath of 2134 the target is the Oct 2014 low of 1813.
Thank you Peter , good post. Very good call on top date .Awaiting your next post.
Recently I stated that gravity indicates a synchronization period, roughly between the third week of May til the third week of June. This whole period is vulnerable for the CIT that will mark the end of the bull run.
So what will be the trigger?
At this moment we see a critical planetary alignment building. Heliocentric mercury, earth and Saturn are all in Sagittarius – home of the galactic center. Mars is opposite. And Tuesday we have a full moon. This means that Tuesday we have Mars, Mercury, the Sun, Earth, Saturn, the moon and the galactic center aligned. This is a very rare alignment.
And this is happening in a very special tightening HC Jupiter-Saturn square. It is special as Saturn is conjunct the galactic center – a once in every 20 year event.
June 3rd will be 75 days in the new Gann-year that started with the Vernal Equinox, which is a trine in the 225 day cycle.
Mercury will be at Aphelion June 2nd and Mars/Venus are parallel June 3rd.
June first, Venus returns from an OOB status. And Mars is making a square in it’s perihelion cycle, indicating max speed for Mars, with Mars reaching OOB june 7th. In short, Mars is going wild.This all is expected to bring volatility. Venus is also heading for the perihelion/aphelion midpoint indication Venus is also increasing in speed. Mercury will accelerate again after visiting aphelion. Speed = energy,change,life. So as of June 2nd the 3 trading planets are all accelerating or at max speed (Mars).
Last but not least, the mercury retrograde midpoint, May 31st, with 3 days either side, is known for massive CIT’s.
Gravity says that if this turns we are headed down into 2017, with the first step end of September/early October.
Mastertiming (Gann’s square of 9 technique) gives May 28th on the 2007 high and June 2nd on the 2009 low. Spiral dates give a peak June 2nd.
Finally, McHugh expects the turn “no later than late next week”, after which it should be down,down,down.
In short; the times they are a-changin’, with the big bang expected within 2 or 3 trading days.
Cheers,
André
“In short; the times they are a-changin’, with the big bang expected within 2 or 3 trading days.”
Roger that from a completely different method…
http://barestbodkins.blogspot.com/
Nice! 😉
I agree with many points within the article with few caveats. The U.S. GDP numbers were revised down this week, likely the result of bad temp data provided the fed as initial input. The service sector is holding up reasonably well as people hunkered down during cold winter. Finally, bullish sentiment is only 25% by individual investors, not quite yet indicative of a major top. blowoff top pending before major correction?
Q2 not looking too hot so far Tom.
http://www.alhambrapartners.com/2015/05/29/peering-toward-q2/
WInter comes every year. Poor analysis uses it as an excuse when data doesn’t suit narratives required by the ‘establishment’.
In reality, as we all know, last winter was mild:
http://www.ncdc.noaa.gov/temp-and-precip/national-temperature-index/time-series?datasets%5B%5D=uscrn&datasets%5B%5D=climdiv&datasets%5B%5D=cmbushcn¶meter=anom-tavg&time_scale=3mo&begyear=1971&endyear=2015&month=2
Still, maybe a hot spring/summer will keep everyone indoors eh?
GM…John uses this data but it’s too hot Due to government fudging and lack of budget to install more sensors.
That said, the Landschiedt minimum by 2030 each year going to depress fundamentals lower and lower.
War is apt to happen between China and USA to boost economics. China’s currency going to darken a lot of manufacturing. Through TPP but also existing trade agreements USA has been outsourcing but has extended capitalism economics globally. No different then a corporation moving from one USA state to another for more favorable tax incentives.
China’s basket of currencies joining apt to be black swan for long gold.
Tom, balanced summation and also a valid
point about the potential for a blow off top.
Another compelling post which clearly shows the picture of US equities with the glass less than half full. Good to remember demographics turning down next decade or two, and probably beyond. From previous posts some valid points made such as GMs that 1962 to 1983 inflation doubled and equities were no gain. My counter to that is that 2000 to present minimal gain in equities, with a doubling of inflation in housing, education, entertainment/travel, and quality food (when considering constant lower ounce repacking (shrinkflation). This “could” be 1983 redux with Jeff (Stock Traders Almanac) Hirsch’s concept of 2017 to 2025 “super boom” in equities.
Andre’, your posts get more dialed in with each post, much obliged for your astro analysis. As my approach is swing trading based upon:
apogee/perigee
moon phases and declination
daily,monthly tidal
seasonals
major planet alignments
Short term:
post apogee grt. 3 trading days, bullish
full moon tuesday, bearish all week
moon declination heading deep south, bearish next 3 days
tides gentle rise all week, mild bullish
post mercury inferior conjunction, wild card bearish (not every cycle)
venus approaching far eastern elongation(mid June), “mania” usually bullish
seasonals, very bullish until wednesday
Summary: I am short SP500 looking for continuation of Fridays mild sell off, hoping for a freakish sell off next few days upon which I will cash out but most probably another week of whippy toppish price action that will result in finger nail biting.
valley, don’t forget the stockmarket from 1982 to 2000, that was your secular bull right there. 2000 to….2017/18(?) is the secular bear.
Hirsch’s thesis is market has 15 years on, 15 years off +/-. So 63 to 82 was 19 years off, 83 to 2000 was 17 years on, 2000 to 2017 to be 17 years off, 2017 to 2034 17 years on. Maybe there will be an economic wash out (read Peter_ article on Brazil), before a prolonged bull market.
That’s my expectation. The washout is underway already.
Valley; thanks for the praise. Short term I expect a reversal up into June 2/3, then 1st wave down into June 5th (job report), retrace into June 9/10 (last square at perigee) and then a more energetic down at least into June 16th but possibly into the full moon July 2nd.
Full moon Tuesday June 2. Market often rises into the day of the full moon opening and then falls all day and in days after. So Tuesday at open may be better place to initiate a short.
Can I get your email somehow Valley?
valleyofmoon999@gmail.com
Great article once again John.
In relation to PP’s CB rate chart the rate on Australia is incorrect. The RBA have cut rates 50 bp in 2015. Once in February and again in May. The consensus is that rates will be cut another 25 bp in June. I however feel they will wait until July.
Australia is heading into a extremely bleak future, as the world’s most predominant commodity based economy just ahead of Canada.
I believe that Australia’s once in 3-4 generational property market boom will collapse along with a collapsing global commodity market that will have repurcussions for decades.
Cheers
Brazil is crashing:
http://theweek.com/articles/557427/brazils-economic-catastrophe
BRICS yes, don’t they include South Africa?
as just posted
Maybe on the next post John will talk about the crashing BRICS.
The situation in South Africa is potentially much worse. http://www.politicsweb.co.za/news-and-analysis/south-africas-looming-crisis?utm_source=Politicsweb+Daily+Headlines&utm_campaign=d97efd30f5-DHN_May_28_2015&utm_medium=email&utm_term=0_a86f25db99-d97efd30f5-130040709
Very well written, John – thanks.
Bearish divergences galore now, transports, summation index, vix to name a few, markets internals are consistently worsening, most weekly indicators have gone bearish, a sell off of some kind is likely soon.
Less we forget amplitude of sinosodial waves and how rate of change in wave is akin to rate of crash in market cycle. Using this chart you can see great recession crash amplitude stronger then anything coming anytime soon.
?
That’s an interesting long term Bradlay chart. There’s another half-way down this page which is calculated slightly differently (more weighting to the slower-moving planets I think) showing obvious lows at 1931 and 2009 and a high during the late 1990s: http://www.amanita.at/en/interesting/articles/bradley-siderograph-archive-since-2007
The period from now until 2018 to 2021 to late 2020s (leading to a massive high after a lot of volatility) is close to Gann’s Financial Timetable, and is comparable to market movements during previous weak solar cycles.
The corrected Gann Financial Time Table expects a low ideally in September 2015 and a high between February and July 2018
A remarkable increase in Margin Debt during April: http://www.nyxdata.com/nysedata/asp/factbook/viewer_edition.asp?mode=table&key=3153&category=8
Some will see it as the start of a mania; others as the end of it.
The important point about this Margin Debt, which is not discussed very often, is the interest rate at which it is borrowed (Call Money rate). This rate increased dramatically near the ISN breakdown in virtually all previous weak solar cycles, coinciding with US stocks tops – see 1919 and 1929: http://www.nyxdata.com/nysedata/asp/factbook/viewer_edition.asp?mode=table&key=1673&category=8
ISN is still right in the middle of its “plateau” (around 60), so there is no sign yet of Margin Debt becoming too expensive – but when it does, it will do so suddenly as it always has in similar natural circumstances in the past. That will most likely be later in 2015 or early 2016.
Mark, what was the reason for the rate increasing dramatically in past cycles and what would cause same to occur in this cycle?
And refresh my memory – what is the ISN?
ISN = International Sunspot Number, which is the monthly average. It is much more important in a weak solar cycle than the more artificial SSN (Smoothed Sunspot Number, which is a 13-month CENTERED moving average). The fact that SSN is centered means that in a strong solar cycle, where sunspot numbers form a roughly uniform normal distribution curve, the longer term SSN will always look fairly similar to the shorter term ISN. But in a typical weak cycle, where sunspot numbers are relatively more volatile over a longer period, the SSN becomes multi-peaked and is therefore relatively useless as a timing tool; like this: http://www.solen.info/solar/cycl14.html
The Call Money rate increased dramatically during the maxima of weak solar cycles 12, 13, 14, 15 and 16, and then started to drop back down as ISN fell away. It is only when ISN drops out of its plateau that interest rates surge, and speculation dies away. The interest rate cycle has already started to turn (I mentioned in late January that I was starting to short longer US bonds), but it is only when ISN drops that rates will really take off.
The reason why I focus on these weak solar cycles is because that is exactly the environment we face now. No-one alive today has ever experienced a weak solar cycle before (not as an adult anyway), yet virtually everyone is trying to calculate the future by analysing only the more recent data from stronger solar cycles. No wonder there is so much confusion and frustration around.
Thanks, Mark, for your excellent response.
Mark, where do you obtain call money rate for let us say last 80 years? I can find only call money rate from 1857 – 1934 (https://research.stlouisfed.org/fred2/series/M1301AUSM156NNBR)
Sorry, I don’t have the post-1934 data. There must be a reason why it is so hard to obtain (?). The current rate is updated here: http://www.bankrate.com/rates/interest-rates/call-money.aspx
I notice that the rates shown in your St Louis Fed link are generally less than the actual NYSE data; for example, 1929 is shown as 7.6% wheras the NYSE data shows 20% during early 1929. It seems the Fed chart shows yearly averages, even though it is described as monthly. Martin Armstrong recently published a chart using the actual NYSE yearly highs…
… Mr Armstrong’s chart:
Seriously, where does MA dig up this crap? I have a mate in Spain and just asked him how hard is it to buy gold bullion/coins? Straight back at me…..no problem.
It makes zero sense to ban gold if they want to discourage people from having interest in it. What is the best way to create interest and drive the price of something higher?……make it illegal!
http://armstrongeconomics.com/archives/31089
Agree, utter fantastical nonsense.
Bears must always understand the bull story, regardless of whether they agree or not. Vadim is a good strategist, as is Richard Bernstein, two long-time bulls:
http://www.businessinsider.com/stocks-still-have-room-to-grow-2015-5
Gary, agree absolutely on that and the reverse
also applies.
Only those who believe in the certainty of fairy
stories do not consider alternatives.
Gary, as far as I recall Bernstein is expecting an ongoing bull market into at least 2020?
The issue I have with that, is that liquidity, nor wage growth supports his assumptions on either stock market valuations or continued longer term growth.
Unless things turn around very rapidly in respect to the above, current stock valuations are at extremes.
I can’t emphasise enough, as I have in the past, the importance of liquidity. Liquidity is evapourating rapidly whch shall soon lead to the “mother of all crashes”.
Two points I would like to add to the above:
– zero/negative rates are actually driving declining liquidity NOT assisting to increase it
– many would respond that lower liquudity would/is negatively impacting the gold price. To wit I say that the PM sector is overwhelmingly miniscule in capitalisation compared bond/FX/SM’s and it would take less than .5% of current global MC to flow into PM’s to drive it to new all-time highs.
All it will take for that to happen is a black swan event. BS events are rare, however, markets have been pushed to extremes on the back of QE which has distorted valuations and so, the likelihoid of an event is increasing exponentially.
My bet is on gold/silver attracting possibly 5% of current global cap in the next few years. Back in 1979/80 it was as high as 20%.
Regards
Thanks again, John. Everyone take a look at the very long term Dow Transport chart. Go to http://www.mrci.com. Scroll down left column to Free Commodity Charts, go there and then to Dow Transport. It is a very bearish chart. It shows a 5 month top distribution, a breakdown and is now in a position to have a monthly gap down. Some people criticize these arithmetic charts but I find them very useful. A gap down would be extremely bearish. This is a simple corroboration of study 2 above. Besides all the Dow Theory and economic data about the importance of the Dow Trans I never forget the Dow broke to an incredible low in 1974 below the 1970 low. However, the trans made a double bottom ever so slightly above the 1970 low and a 25 + bull market had begun.
Up c.84% since end of 2012, near vertical ascent. Jeez, how bubblicious.
Useful link, thanks.
Ref the importance of the trannies. The 2009 low was ever so slightly above the 2003 low, again setting in motion a terrrific bull market. Unfortunately, I just noticed that in looking at the charts for these comments.
Margin debt at all time highs:
http://www.businessinsider.com/stock-market-margin-debt-2015-5
Richard, margin debt is only at all-time highs in absolute terms. Scaled by market capitalisation, it is well short of a new record peak. The 2007 all-time high was around 2.5%, we’re less than 2.3% in the latest data I’ve seen, which isn’t even a high for the present bull market.
spanisharcher – those are the sort of interesting figures which make it worth reading through the comments here.
Since the March 2009 start of the US stocks cyclical bull, SP500 has increased from 666 to 2132, and Margin Debt has increased from $182,160million to $ 507,153million. A 220% increase in SP500, and a 180% increase in Margin Debt.
Yet look at the contrived charts (like the second one shown here) people are using to try to purport the opposite: http://www.zerohedge.com/news/2015-05-31/how-much-more-extreme-can-markets-get
Mark, thanks for this link. The second chart appears to show margin debt growth as being at a record high since mid-2013. If this indicator has any value at all, it is plainly not as a timing device!
Sorry, Mark, above reply was supposed to be for you, not for Richard!
A good example of bull rationalisation.
GM, the bear argument here as I understand it is that previous record peaks in leverage have marked tops in the market. This is true: absolute and relative peaks in leverage in 2000 and 2007 accompanied major market highs. Today, we only have an absolute record peak in leverage, not a relative one. Relative is the more meaningful as a gauge of how stretched speculation is. Comparing dollar amounts with 15 years ago is surely less telling.
Kent, the DJT was propelled to recent highs at least
partly due to the rapidly falling oil price.
A degree of the recent pullback has now corresponded
with the partial recovery in the OP.
There is also a macro element at play here,
would agree.
Flaming meltdown at hand (needs to be read in its entirety):
http://www.newsmax.com/Finance/StreetTalk/gdp-growth-economy-federal-reserve/2015/05/31/id/647835/
Same ole story; Chinese economic numbers disappoint but stocks rise on “hope” of more stimulus:
http://finance.yahoo.com/news/european-markets-gain-stimulus-hopes-093755355.html
More bad Chinese economic numbers especially the all important service sector:
http://finance.yahoo.com/news/china-may-manufacturing-pmi-edges-011215742.html
so, of course, stocks will rise on Hope of more CB stimulus.
Richard, unless macro begins to impact earnings
and dividends it will make little difference,
at the very least there needs to be a shift in
anticipation of this happening.
SPX mean earnings (ex energy) are still increasing,
and more importantly so are dividends.
Macro has to come off hard over the Summer for
a 2015 final bull market peak.
European factory growth stumbles so, of course, stocks should rally on Hope of more CB stimulus:
http://finance.yahoo.com/news/euro-zone-factory-growth-stumbles-core-struggles-pmi-083034926–business.html
Did you hibernate through Winter & Spring Phil?
http://www.bloomberg.com/news/articles/2015-03-13/surprise-u-s-economic-data-most-disappointing-in-the-world
Why try to fit it to your narrative, it just makes you look a bit silly.
BTW Phil, that little ‘ex-energy’ comment made me smile.
We all know that energy company earnings mean nothing right, so just ignore them.
I also ignore consumer discretionary corporates, because consumers are so stupid, not spending their money.
In due course I will also ignore financials, as their bad debts will just be on paper.
http://www.marketwatch.com/story/us-corporate-profits-sink-59-biggest-drop-since-2008-2015-05-29
Corporate profits decline for two quarters in a row and Consumer Spending is flat to falling (of course this means buy stocks in anticipation that the CBs will stimulate more):
http://finance.yahoo.com/news/us-consumer-spending-april-weakest-123120351.html
Spiral update – expecting a low 11:30 or no later than 14:00
Peggy – what is the expected target for the low today?
ideally 2090 to 2092 2095-6 is possible too
Those that trade softs and other commodities, my system suggests that sugar is within 5% of ultimate bottom. I’m a buyer here.
Hi Rick,
What do you think about soybean , corn and wheat?
Thanks
Richard Isaacson, got a real laugh out of so of course mkt rallied in hopes of more QE. The Japanese economy, employment, and markets topped within one year of ceasing QE. We are at 7 months plus they say the rise in the $ is a virtual tightening. If this mkt doesn’t correct, all praise to Nicholas, wherever he is.
Things will go bad, really bad, when bad news fails to rally the markets.
next low at 12:30-40. 2090-2092 should be reached near Singularity 6/6 so if not today, then later in the week.
is it just me, or are markets (equities, gold/silver/ bonds, having greater intra day volatility? swing traders have had very little chance lately, but if you are a good day trader, you are cleaning up on the tight range volatility intraday
Seems to be a lot of manipulation in the ES futures after hours. From 2112ish all the way down to 2094 after London opens. Will be interesting to see if we make it back up on Tuesday once NY is open.
Housing Market Collapse set to resume:
http://www.advisorperspectives.com/newsletters15/Why_the_Housing_Market_Collapse_is_Set_to_Resume.php
Hi john,
I am interested in weather pattern that you told us that uncommon weather pattern is supposed to appear this year.
I am trading the Arg .Futures thru CBOT. now price of grains is going down and no light to pick up. Besides, I have not heard about abnormal weather pattern so far. U.S. weather looks ideal.
Please tell me how accurate of abnormal pattern statistic which you picked up on your webpage.and what do you think about that.
Thanks
GM,
what makes people look silly
is stating with certainty an imminent
correction was due weeks ago, as
you did.
What happened? – what happened
is it did not happen.
It makes no difference what my interpretation
of macro is, what matters is price action.
I gave my window for a final bull market top
here about 18 months ago, which was ridiculed by
those also convinced the bull market would end
in 2014.
Lots of certainty about the 2014 bull market end
on solarcycles last year, from many of those who
no longer post.
At least if you make a bad call have the guts to own
it rather than run away or start constant excuse making.
As I will if my window passes.
So my expectation (not certainty) of an imminent top from a few weeks ago (still holding with that BTW) versus your 3 month window.
You do make me laugh Phil.
I give it to you…Most of are were indeed wrong in 2014. When is your 3 month window?
Own it rather than run away, that is )
Added dax long. Building up in very small stakes as I do not believe we are about to crash but a healthy correction is possible. Still believe 14,000 dax is possible this year but the chances of it are slowly fading.
The DAX and CAC have 5 waves lower… the move lower is not over.
After that move higher to 12500 should follow best case 13k but that is all.
After the high down.. down… to 10k even lower is possible.
No 14k this year.
I agree it will fall to 10k or lower after the bull is over but I predict the euro will weaken and that should push the dax higher medium term. Short term we still can fall further hence my small positions. Europe still looks far more attractive than the US and I personally don’t see how the US markets are holding up so well. As you said 12500 is your best case buying now for that is a good idea assuming you can hold through any short term fall which is my plan. Using high leverage won’t work with my ideas.
Hi Karni, congratulations to your wave count. I think you catched the top and all the 5 moves down. What is your target for wave 5 down ? Around 10900 ?
http://qz.com/416895/charting-europes-demographic-time-bomb/
Spiral update – Expects low 2095 to hold, then up to 2113. Then Singularity low 2088-2090.
Spiral update – the larger trend is down. Price target of 2113 may not be reached
Spiral update: 2113 reached low tomorrow near 11:10 price target 2090 still in play
Lunar Chord:
Full Moon: next four days weak
Declination: next two days weak
Distance: increasingly strong next seven days
Tides: up next few weeks
Planets: mercury conjunction 2 days ago may still unpack a sell off.
Summary: ridiculously overleveraged to the downside. Error? Will know by end of trading today.
I don’t know how others feel, but this market has become the most consistently boring and predictable market I can ever remember.
I have lost all interest and I mean totally lost ALL interest!
Hi Allan;
Not saying I’ve lost all interest, but understand your sentiment…
After a while, there’s really not much more to say…
I’m just tracking my trading system (more or less, for better AND worse), and reporting system changes here, but as I said, there’s really not much more to blather on about after a while…
The market’s going to do what it’s going to do, and no matter how out-of-whack it seems, that’s what we have to work with…
Still 50% short on system, and while I would have said earlier today that it’s going to trigger a 100% sell (based on weaker HY bonds), right now I’m not so sure we’ll get it… Just another day, and another market save….
That said, I’m very bearish this market right now, and using scale up sells and scale down buys on TZA while we keep going nowhere around here…..but otherwise just biding time….
Take care,
Barry
The bond and currency markets are showing some stresses though Allan.
Stocks will join in soon enough I’m sure.
The market may have become boring and predictable but Peggy’s spiral calls have not!
thanks Gary!
Can you elaborate? I say this because I was feeling what can be described as “disinterest” on 5/2008, right before the crash. Yeah subprime, but the Fed will save us right?
And now, yes, some Chinese companies are defaulting, but the govt will save them right?
Better to lose all your interest in it than all your money in it
is that an island left behind by the dollar on it’s third lower high?
Buy interest chart on SPX looks like silhouette of gang of ghouls. Maybe representative of the intervention team.
ok…i’ve been beaten up enough. Peggy’s spiral calls are showing great direction so I’m incorporating them by selling credit spreads in the opposite direction. in this case, I sold a small batch of 213/213.50s for this Friday for a .20 cent credit. risking $1200 to make $800 as long as we stay below 2126 by friday close.
Be careful Scott. No system predicts the future. It is boring though atm, but I suspect not for too long:)
J
I know jeger, I’m incorporating into my own research as well. this sideways market has been range bound. I don”t expect us to break to aths this week unless Greece is miraculously resolved. the rumours have only taken spy to 212.97 before sell off ensues. if aths occur this week, I lose $1200…i can live with that…much better than the hits I took last month
New post out
Spiral update -User error! Spiral was UP from 4:20 to 9:10. Then down to 11:10. Price targets 2111-2113. Then UP (2123 target).
next price targets 2111, 2109, 2107. Low in by 11:10.
Spiral update: 2107 price target reached, next price target 2126-27