

The irrationality continues, but not for much longer.
After last year’s solar maximum, the cross-asset picture changed. Global stocks entered into a topping range whilst money flowed into the US dollar and treasuries, plus commodities (shown inverted) collapsed, all in a deflationary recessionary wave.
 Source: Stockcharts
Global leading indicators turned down from that point and are now negative, like in 2000, 2008 and 2011.
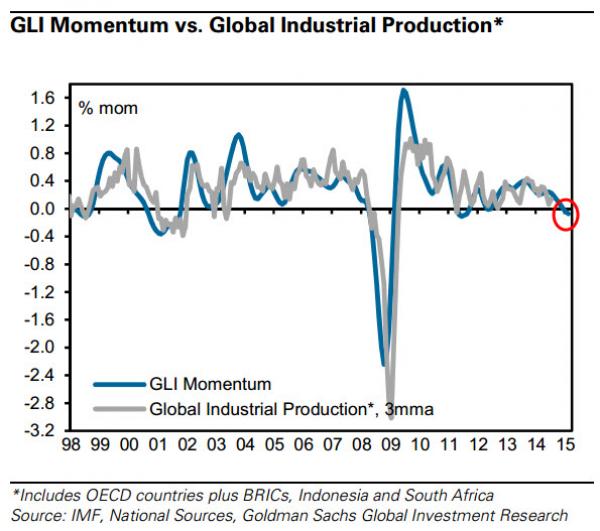 Source: Goldman Sachs
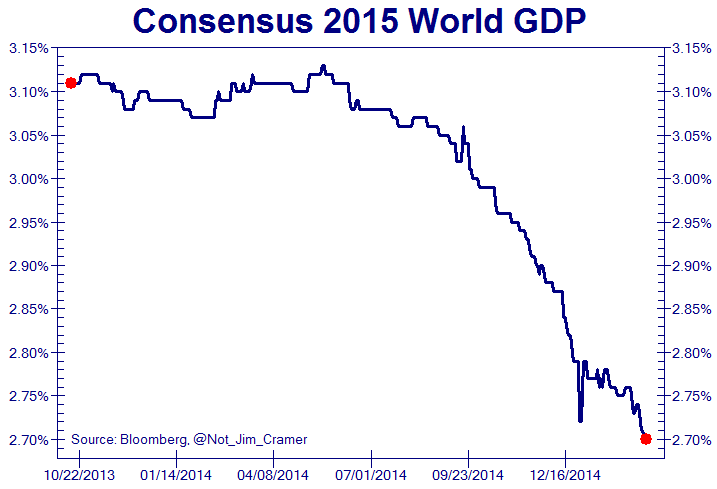
China data turned sour.
 Source: Sober Look
US earnings projections and economic data diverged sharply from the stock market.
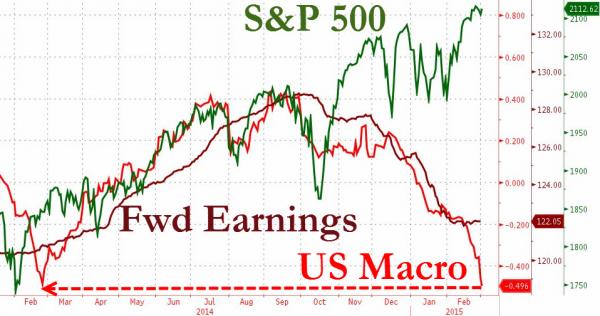 Source: Zero Hedge
Also captured here in homebuilder stocks versus housing data.
 Source: Not_Jim_Cramer
Buybacks fell away from their peak.
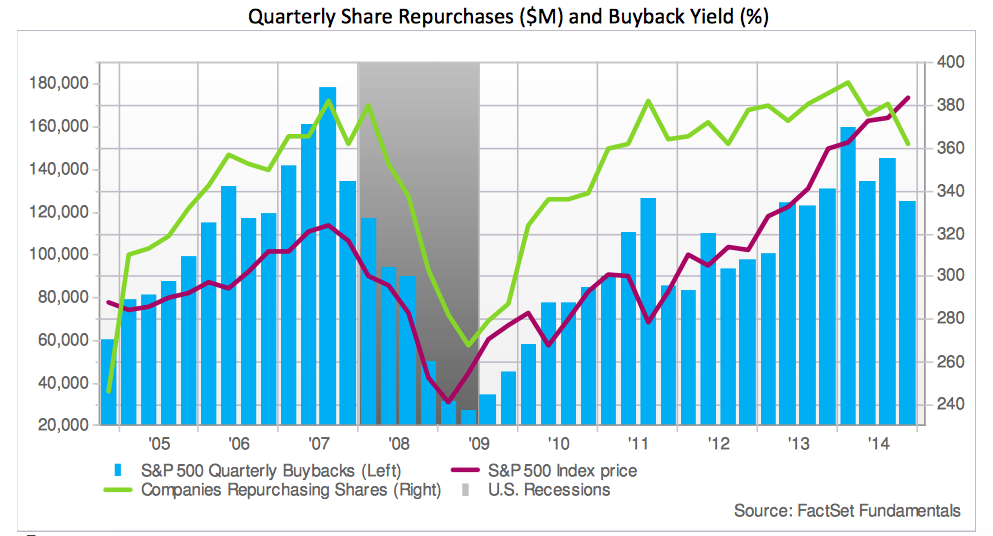 Source: Factset / Jessie Felder
And hedging moved contrarian.
 Source: Sentimentrader / Sundial
In short, everywhere you look the footprint of the solar maximum can be seen: the subtle peaking in human excitement in terms of both economic activity and financial market speculation around mid-year 2014.
 Source: Not_Jim_Cramer

Source: SpiralCalendar
Following the solar maximum comes the peak in geomagnetic disturbance which adds to the negativity. See here the major storms (red downward spikes) of July and August 2000 which coincided with the SP500 reversal, all following the solar maximum of March 2000.

This last week saw a similar occurence of a major geomagnetic storm, the massive red spike down on the right:

Put into a trend, geomagnetism has been diverging from the stock market since mid-2014, like the rest, and that storming serves to steepen the trend.
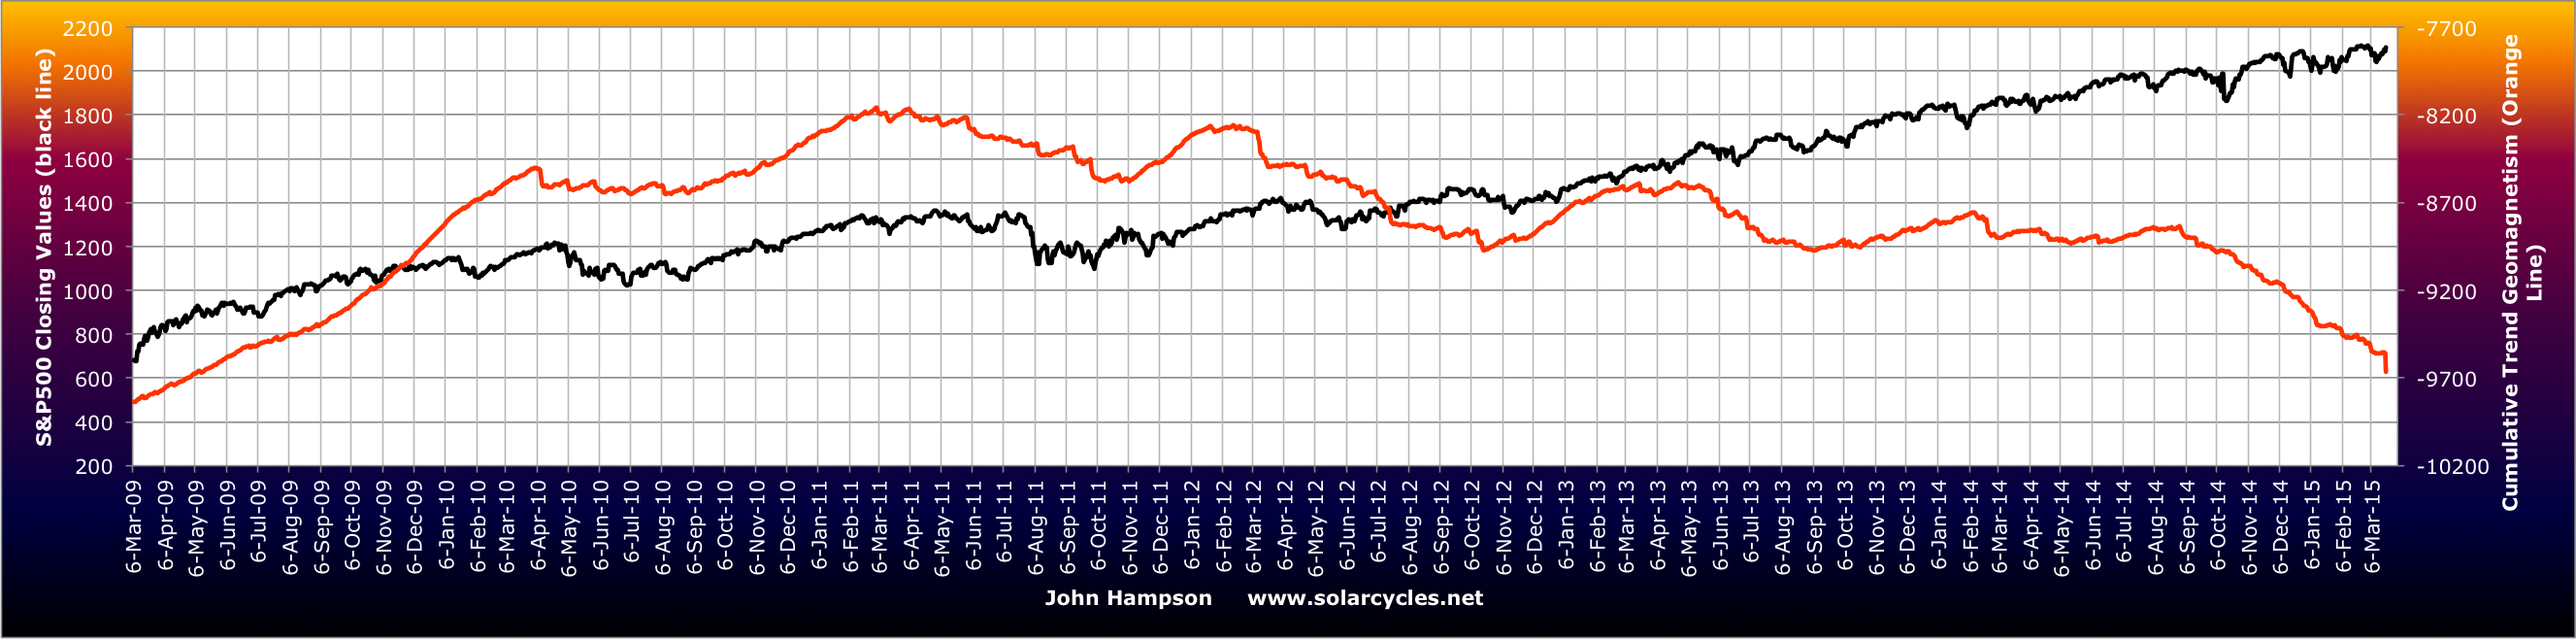
The TR-CRB commodities index has tracked the trend well. This is reality, whilst stocks are in a mania prone to a major reset.

Back in 2000, the SP500 finally gave up its levitation on 1st September. We probably don’t want to focus too much on the timing of that lag, but instead note that we have the same comprehensive leading removal of supports: solar maximum peaked; geomagnetism intensified; divergent earnings and economic indicators; buybacks and combined central bank printing peaked; saturation in allocations, sentiment and valuations; commercials and hedgers short; money flows into bonds and dollar.
With hindsight we can look back on the first half of 2014 as too soon for a peak in the mania as the solar maximum wasn’t yet done, but with a host of warning flags present in allocations, sentiment, leverage, valuations and more. We can look back on the second half of 2014 and see a typical topping process in a whole range of indicators: negative divergences in breadth and volatility, declining forward earnings and leading indicators, a deflationary wave in other assets and economic data, all occurring whilst price continued to levitate. And, I believe, we can look back on Q1 2015 as the completion of the missing pieces of the puzzle: commercials go short, insiders press sell, geomagnetism ramps up, data surprises to the downside more than expected.

Q2 2015 then should look like this: economic data doesn’t improve, realisation that earnings and leading indicators are staying divergent, geomagnetism continues to pester and turn the tanker of sentiment, stocks start to decline and in turn recession models start to wake up.
A host of leading indicators for the stock market suggest equities are overdue the major reversal, and it’s hard to find ‘fuel’ for prices to continue to rise into mid-year given the all-round picture from indicators, namely saturation and divergences. I therefore have not given up on the March-April seasonal low: a sharp leg down from here to kick off the bear market. Let’s see how this week unfolds: we need to see the telling price reversal, and until then patience needs to be maintained.

Day traders short 24th March into the 26th, good coin to be made on this trade.
A-“greed”. Wait to go short for price signal, get out of short by Friday is my plan.
I promised not to post every weekend anymore; over 400 reply’s on every blog. No need to make it worse.
But after last week I owe you guys an explanation. My analysis was correct but incomplete. I have now found a new gravitational cycle that is so obvious I can’t believe I didn’t see it earlier.
Anyway, this is what I see now:
1) the apo/peri cycle peaked in December 2014 – the regular end of the cycle that started in 2009.
2) My harmonic timing system (lunar but not gravitational) had to reverse it’s pattern due to the apo-peri turn. This changed the dec 7 high in a December 12 low and shifted the inverted high into march 14.
This timing system has a regular sequence of alternating long (3 months) and short (2 weeks) phases. When the multi year apo/peri cycle turns this sequence is interrupted s-l-s-l becomes s-l-l-s. This only happens at the end of multiyear cycles. And this explains the unusual long inversion from December into March. It also implies that we won’t see this event in the next few years.
3) my new 2 week cycle was up into march 21.
The general rule with cycles is that longer cycles have more energy. Last week I said the trend was down, based on the 4th cycle, that lasts 5-8 days. So last week the 2 week cycle was up and the short cycle down. This created last weeks market behavior; slightly up in a consolidating fashion (a lot of down moves).
It is obvious now that within every 2 week cycle we have one short cycle supporting and one counter acting. The 2 week cycle is always dominant but the trend force is largest when the sort cycle is aligned.
What does this mean?
For the first time since the 2009 low we have the first 3 strongest cycles all down. This indicates that this weekend is the start of a new cycle.
More arguments for this date
1) the most significant astro event this year is the HC Jupiter/Saturn, exact September 21 2015. This 6 months (Gann 180 degree) after march 21.
2) March 21 is 6 months after the September 19 2014 high (top of w3 of 5 ).
3) March 2015 is 6 years after march 2009 low.
4) the very significant 1932 low in the DOW gives march 22 2015 as masterdate
5) Total solar eclipse and spring equinox.
6) HC Mercury trines Earth march
7) McHugh gives a fibocluster from march 18 until April 18 as turn window.
And this coincides with my gravity analysis.
So, what’s next:
Next week the weakest cycle is up , causing a consolidating decline with likely a low on Wednesday. Then the 26/27 test and the sharp decline into April 4th.
And this is just the start of what should be a decline into early 2018 with the first serious low by the end of September when the JS square is exact and apo peri gives an inversion.
I see a lot of analysts predicting the collapse in September. I see a low there, possibly caused by central bank intervention as one last desperate attempt to stop the decline. January 2016 W3 down; that should be spectacular.
I believe this view supports the analysis by our host John and just adds a little timing.
Cheers,
André
If you torture a cycle enough it will confess to anything
😉
And most cycles would welcome waterboarding compared to what is done to them. Translation and especially inversion are very painful.
Thank you Andre for sharing your invaluable insight. Can you say if the geomagnetic storming this past week had any effect in your forecasts? Do significant flares like the M or X have any effect as well?
crusauvage,
The geomagnetic class 4 disturbance confirms the change in trend. Post expiration weeks have a tendency to be sideways or down. So there are much more indications than I have mentioned above. My aim is not to be complete; just to give some strong arguments.
Thanks Andre, I always enjoy your posts and the thoughtfulness and detail you put into them.
ps typo j/s square.
Unless there is now an extraordinary crash
a March low is already ruled out surely.
Even an April low would require a highly
compressed severe sell off.
I am assuming that a “low” means a significant
correction as per last October.
With the September low I mean down from now until September/October.
great chart on commodities vs solar activity. awesome
Thanks
Everyone is jumping on the September bandwagon
now, where were all these people last year, probably
shouting for a 2014 top.
I mentioned over a year ago an end Q2/Q3
bull market final top.
If markets are not falling heavily by October this will
be invalidated, no excuses, no reasons why not,
no changes – no new system discoveries – just
a wrong call.
Andre, thank you so very much and John also….n
I like the Commodity vs Solar Activity chart. I am expecting the low in Crude to be with the last trading day of the May futures. That points to continued falling commodities and a rising Dollar. This also means that I don’t expect any weather premium to be added to the AGs until the low in Crude comes in with the last trading day in May. All this agrees with the ongoing trend lower in Commodities till May.
John, you might want to do a special report on Commodities next weekend. I am not a Gold bug but this also seems to point to lower Gold prices as well which seems to be against your recent long in Gold. (I have no positions on at this time and am waiting to “pull the trigger”.)
I got stopped out of my positions so am ditto waiting to pull the trigger again
As Friday was the Spring Equinox, see here:
https://solarcycles.net/2014/09/19/stock-market-vs-equinox/
Very good point. I think that we need to turn our attention to NOT calling “The Top” but to calling the Crash. Whether “The Top” has already occurred or will occur in October is not the issue. The issue is that the Crash will not happen until late this year. This means that The Top could be in October –or– the Second Chance Top could be October but, either way, the Crash doesn’t happen until late this year.
I am expecting the CRB to start making a bottoming process for the next six months which points towards the Dollar and Dow making topping processes for the next six months too.
I think JH is calling for a March/April 2014 top. His link was to an older page, but it doesn’t mean he expects October 2015. Or maybe I am confused.
The possible relevance of the equinox as a major turn point. If it has any merit then it would mean the stock market to peak near enough to Friday’s spring equinox: an inversion.
Thanks JH. I hope you are right. CNBC is touting that Mid-March to April-end is bullish for 13 out of the last 15 years, Of course, it failed 2000 and 2002 which was the last crash.
vxx 1
http://stockcharts.com/h-sc/ui?s=VXX&p=5&yr=0&mn=0&dy=4&id=p80932788721&a=347142822&r=1427029336105&cmd=print
vxx 2
http://stockcharts.com/h-sc/ui?s=VXX&p=15&yr=0&mn=0&dy=12&id=p59269461686&a=399810691&r=1427029574692&cmd=print
One thought for a bit…the FUEL for a bit more push Up comes from IRA deposits showing up and going somewhere to work…AFTER that expires, then the fuel tank of cash is…empty
My cycle timing, wave count and puetz crash window all point to a large correction beginning as early as 3/27.
Here’s my wave count on the Dow with a typical ending diagonal to wrap up primary wave [3]: https://alphahorn.files.wordpress.com/2015/03/dow-daily6.png
And here once again is my cycle chart. we began to roll out of high beta longs on Friday and into precious metals. Will look to exit the larger indexes as they make new highs this week, https://alphahorn.files.wordpress.com/2015/03/cycle-with-peutz-count1.png
We also took our first equity short, entering TZA
Interesting and thank you. Are you still net long though? I see the wave has not reach 5 of 5 yet.
Also, what are the red and green cycles? Are they solar cycles?
Net long equities and net long soft commodities (corn and wheat). Long precious metals and miners which have been moving contra equities and far more agressively. But that is as of now.
See my comment below on the red green cycles. The solar/lunar aspects of the chart are the Puetz crash windows
Alpha: I subscribe to Musings and generally like your work, but your cycle analysis would appear to never allow the market to move higher or lower than your cycle bands. If SC2 bottomed in 2009, wouldn’t one expect this next market phase to well exceed the upper range of your band? If the market is always expected to top and bottom in line with the cycle bands, are you suggesting we’re in some sort of perma-consolidation phase? Or do your cycle bands expand following the end of the next downdraft? If so, to what degree and based on what? Thanks!
No, the height of the wve is meaningless, it’s merely a timing wave
The top of the band is only a timing measure. The top of the red cycle and the bottom of the green one mark timing only not price limits, they are not barriers like the bands I use on my Alphahorn system charts
Got it. Thanks for the clarification!
very eery similarities between 2007 and now with the commodity crash leading, gold should also have shot up if there is an inflationary scare, quite the contrary, dont think the fed can stop deflationary forces in play, they may just be delaying the inevitabe.
Another master piece showing how fragile this rally has been. Thank you much John. If you don’t mind, may you please share your current position? Sidelines? Fully short? Thank you.
Thanks erick. I’m sidelines but ready to go again on evidence of a turn.
I am seeing many indication of exhaustion when I studied $NYUPV; $NYHGH; and the often mentioned sectors such as IBB and XLV.
My study of $SPXA50/150/200R reveals a slow motion train collision coming.
I will be accumulating shorts as the re-set is being built. Longs can have a hair-cut in peace when most frustrated shorts have left the saloon.
I am waiting for the first salvo! Until then, not getting excited about this market at all and just trade for fun to try to catch each turn.
I totally agree with John. “Patience needs to be maintained”.
My timing model says this up-leg may roll-over in 2 weeks into a mild correction. Unless we have major profit warnings or a start of recession fear talk, I expect SPX 150 SMA at 2,024 should hold for just a 4% consolidation.
Instead of a Parabolic blow-off-top, for American stocks, this year, a better pattern may be an Ascending Diagonal Triangle with a Throw Over (from the Spring Equinox to the Fall Equinox). As the Public keeps on buying the dips the Pros and Insiders keep selling the tops.
Check the daily RUT chart, shows ascending triangle and breakout. Would need a quick reversal for that not to be bullish.
Maybe this is a rotation into RUT as SPY sinks under weight of dollar export issues. RUT has underperformed for several years, and since smaller cos. prob. less exposure to intl. currency issues.
The Commodity Bear market to be the Pin that eventually deflates the bubble in stocks?:
http://www.forbes.com/sites/kenrapoza/2015/03/22/next-five-years-will-bring-huge-changes-to-chinas-commodity-demand/?utm_campaign=yahootix&partner=yahootix
How about this: a deep spike low in the CRB index during the Fall Equinox that reverses the Throw Over of the Ascending Diagonal Triangle of US stocks –and– the USD. Thus, the deep spike low of the CRB index becomes the Pin that deflates or pops the bubble in US stocks.
Of course this implies that the USD won’t top until the Fall Equinox and neither will Gold, Silver, the Grains, or Crude bottom until the Fall Equinox.
I’m still in agreement with John’s analysis. It would surprise me more if there wasn’t a very sharp & deep correction within the next few weeks than if one took place.
I’ll keep accumulating gold and its miners in the meantime.
erick mentioned $7,000 dollars in the previous post as a target.
When the debt bubble finally bursts (within 10 years), physical gold will go to 25,000 euros easily. It’s not worth estimating in any other currency, as so many will collapse. Traders holding dollar-based trades will not see those gains, as the XAU market dissolves.
Mark,
Thanks for the comments.
Regarding ” During SC20 (late 1960s) and SC13 (late 1890s) US stock prices had been volatile, before surging upwards (taking commodity prices with them) in both cases as ISN fell from its plateau. Then 2-4 years later, after very large gains, they lost around half their value while commodities accelerated upwards. That is what we are facing over the next few years, unless US stocks do during April 2015 what they did during September 1929.”
This was my original prediction in 2010 — and I wished I stuck with it rather than turn bearish so early. The 1969/1973 bubble/crash was also engineered by the Federal Reserve to get Nixon reelected via easy money. That is not too far off than what is happening now in terms of rates that are far too low versus benchmarks such as the Taylor Rule.
From http://www.basilhalperin.com/blog/2013/09/fed-independence-is-important-examples-from-history/
“The Federal Reserve again came under political pressure during the Nixon administration. This time, instead of keeping the cost of debt down, President Nixon sought to ensure his reelection. Evidence comes from the Nixon Tapes and from members of the Nixon administration.”
Talking of the late 1960s, and late 1890s, and commodity prices: http://www.ritholtz.com/blog/wp-content/uploads/2012/04/bla3.png
I love that long term commodity chart. It shows a beautiful and massive 5 wave count from the 1897 low. The break out level for the move was around 120-30. It should fall back to that level as early as late this year and then stay in a low range til the 2030 bottom.
And bearing in mind your (John Li’s) recent charts showing that geomagnetic disturbance was low during and immediately after the late 1960s and late 1890s solar maximums, that is exactly what has been happening again: http://users.telenet.be/j.janssens/SC24web/SC24.html#AreaAp
Geomagnetic disturbance is not just a function of sunspot numbers. Coronal hole formations at mid latitudes around the middle of the Schwabe are also a key factor in driving geomagnetic activity.
I wonder if these phenomena are more important than CMEs/ solar irradiance in determining market outcomes?
From 6 January 2015: “We have definately entered into a phase of transition. The sun’s complexion changed during September 2014, as the proportion of geomagnetic disturbance from longer term coronal holes started to increase. This, and the large coronal hole at the southern pole are typical signs of an oncoming decline in sunspot numbers. But there have been similar polar holes before, like during summer 2013, and these were false starts” https://solarcycles.net/2015/01/06/equities-bear-began-july-2014/#comments
There’s no doubt the SC24 max is behind us, but I think it will continue to roll over excruciatingly slowly as befitting a weak solar cycle – there are still plenty of active regions on the sun, but their sunspots are too small to be counted. These could easily erupt again into a renewed but temporary resurgence of countable spots.
So I think we’re now likely to see a period where:
1 – the fuel for speculation (sunspots) is withdrawn more slowly than we’ve become accustomed to during recent strong solar cycles, and
2 – the fuel for risk-aversion and panic (geomagnetic disturbance) is less than we’ve been accustomed to.
A lot depends on sunspot numbers over the next week until we get March’s ISN.
Since I don’t really know the link between the sun and mania, I am throwing out theories based on statistical rather than causal relationships. What do you think of the Cosmic Rays graph? In particular we dropped below the middle of the graph, say 8700 before the market peaks in 1969, 1980, 1990 (Nikkei) and 2000 (i.e. SC20-SC23). Currently, we are still above 8700, and yes, to quote Mark, ” I think it will continue to roll over excruciatingly slowly as befitting a weak solar cycle”
http://users.telenet.be/j.janssens/SC24web/SC24.html#CosmicRays
We could even say that the double market peak in 1969/1973 was due to increased cosmic rays, since we did a strange double peak that year. This would be better statistical fit to the market prices than looking at ISN, since ISN was clearly dropping even as the market rallied from 1971-1973.
Good stuff Mark/ John L
In case I wasn’t clear, I’m hypothesizing that a long, low amplitude SC24 is generating above normal coronal hole activity. I was throwing that out for someone who might have a handle on it.
One of the unusual features of SC24, relative to the last few cycles is the way the North/ South polarity has meandered at the SSN peak, rather than just crossed over. I’ve read that coronal holes are restricted to the solar poles at SSN minima, in addition to the absence of spots, thus compounding the lack of geomagnetic activity.
What if a low amplitude SC generates more geomagnetic activity due to the presence of coronal holes at mid latitudes and what ramifications does this have on John’s (JH) thesis?
Mind always turning/ always full of junk…lol
Estimated March ISN is 35ish. http://sidc.oma.be/silso/eisnplot
John Li – Cosmic rays (more accurately called neutron counts) decrease as solar activity from CMEs etc increases. During an even-numbered solar cycle the neutron counts will turn up within two months of the real effective sunspot max (it takes longer – more like two years – in odd numbered cycles). And there is no sign of neutron counts having convincingly bottomed yet. Late last year I compared the neutron counts at the Inuvik counter with SSN max levels for SC20, 21 and 22 (couldn’t find enough neutron data for SC23), and noted a target count for SC24 SSN=82 to be 625000/hour. That has already happened, so I think we have recently been seeing the effective neutron low/sunspot max since September 2014: http://neutronm.bartol.udel.edu/realtime/inuvik.html
TDL – yes coronal holes are restricted to the poles at solar min, and then “…geomagnetic activity reaches a maximum on the sunspot declining phase when polar coronal holes have already formed and low latitude holes begin attaching themselves to their equatorward extensions and growing in size, so the Earth is embedded in wide and long-lasting fast solar wind streams”. See Fig5 here: http://arxiv.org/ftp/arxiv/papers/1103/1103.4552.pdf
I’m not sure if SC24 has been generating above normal coronal hole activity, but it has certainly been generating below average geomagnetic disturbance – see the telenet “AreaAp” graph above, and also the “Annual days with aa above 60” graph posted by John Li in the previous post (the one with the yellow bars). That latter graph shows that Ap geomagnetism is lower now than it has been for a hundred years – since the weaker solar cycles of the 1800s in fact. That indicates two things:
1 – we should expect weaker solar cycles during the next several decades (and correspondingly lower temperatures on earth),
2 – geomagnetic disturbance is lower, and typically occurs earlier, in weak cycles; indicating that solar fuel for speculation will not die away as much or as quickly as we have been accustomed to over the past 80 years or so.
Is it any wonder that “Superman vs Batman” is a movie in the making? As the sun passes the solar maximum, Superman’s power wanes — his weakness is that of his home planet whose sun has completely died. And as the lunar minor standstill passes, the bat symbol will cover the moon, and “lunacy” will follow. Interesting times.
Sorry, I meant to point out that the “geomagnetic activity reaches a maximum on the sunspot declining phase…” quote is from a study using Ap and which therefore only relates to the strong solar cycles of the 1900s. John Li’s charts using the older “aa” data show that geomagnetic activity in weak cycles (like SC24) reaches a maximum before, or at, the sunspot maximum.
TDL, you are clear. I just don’t know what is superman’s kryptonite either.
It would be poetic that it is the moon, re. the lunar standstill.
Do you have data on coronal hole activity? If not, the only way to disentangle the effects would be to regress geomagnetism against ISN, and see if the residues explain market prices. A high residual of geomagnetism should occur from coronal hole vs CME activity. (This might be my next project, but I have a couple lined up.)
Thanks Mark. I now wish I also majored in course 12 at MIT.
Click to access article1380707205_Verma.pdf
“We have found large negative correlation with correlation coefficient of -0.84,-0.79 between rate of death by traffic accident and Kp and Ap indices; large positive correlation with correlation coefficient 0.79 rate of death by traffic accident and Dst index. Further good medium correlation with correlation coefficient of -0.56,-
0.60.-0.56 has been found between rate of death by traffic accident and yearly average of sunspot number, solar flare index and coronal index respectively. A positive correlation with correlation coefficient of 0.69 between rate of death by traffic accident and yearly average of cosmic ray intensity was also obtained. “
Answering my own question about whether we should use neutron counts, and answering TDL’s question of whether we should also observe coronal activity,
1) I took the data from Table 1 from http://academicjournals.org/article/article1380707205_Verma.pdf
2) I excluded Dst as it is the similar as Ap.
3) I did a multiple regression — these are the t-stats
Intercept 1.91
Kp -3.14
Sunspot 1.48
Solarflareindex(FI) -0.03
Coronalindex(CI) -1.36
YearlyAverageOfCosmicRayIntensity -0.64
Therefore, based on this small sample, the conclusion is:
i) Sunspot creates MANIA (opposite in sign to everything else)
ii) Kp creates DEPRESSION
iii) CoronalIndex creates some incremental DEPRESSION, than just merely observing Sunspot and Kp (in this small dataset)
iv) Solar Flares and CosmicRays do not add incremental value (other than the extent they already affect the above).
This is however a small sample, but I will focus my research on the likely primary causes of mania/depression.
Thanks for the references guys.
The economist Martin Armstrong predicted on Goldseekradio.com youtube that the Dow will reach 23,000 in medium term and 35,000 in 2017 due to capital flight to US.
You just reminded me of the importance of keeping an open mind. Anything is possible.
Internals can always weaken or strengthen. This makes trading such a fun and challenging game.
This week should be interesting. Won’t go long until Friday. Short opportunities should abound especially mid week.
Martin Armstrong predicted in 2011 right at the gold top that gold could go parabolic to 5k and in 2012 he predicted that US interest rates would begin to soar in 2013.
The man has been wrong wrong and wrong again but spins things so much that he can make just about everything he says appear correct.
He has made some correct calls he also a genius at spinning things.
I am always over suspicious of any financial analyst that constantly uses the word “but”!!!
It’s what comes after 35,000 that would be most interesting!
Given that it wouldn’t in any way represent fundamentals, the crash of the millennium lies ahead.
In the late 90s… Martin Armstrong was wrong on just about everything although you wouldn’t know it because he removed all his failed projections from his PEI website. No wonder he lost all his investor’s money back then and was eventually caught trying to pull off his pyramid scheme. The man is a criminal… period.
Quote from “Humble Student” blog:
“In conclusion, I haven’t seen such unambiguously bullish readings in such a long time. I suppose that as we get closer to a Fed liftoff on interest rates later this year, US equities could get the jitters and pull back. For now, the path of least resistance for stock prices is up.”
This blogger has been uncannily accurate about market turns last 3 years. His is long SPXL.
Points to global equity strength last few months as sign that bulls are in control.
An excellent blog. He uses RSI (5) as one of his buy/sell signals. I use Slow Stochastic daily set at (5,1) …which is currently at 85.96 for the SPX.
No sell signal yet!
His signals seem to be off since November. Further evidence to a polarity change?
Could be, he has had a good run tho’.
Bill Gross now writes on Seeking Alpha,
he appears cautious in outlook currently
and his views are worth a read.
Bill’s track record the equity market has been less than stellar so I’d take his views on the subject with a grain of salt.
It’s funny how the big bond gurus have taken to expressing their views on all asset classes, not just bonds. Gundlach does this on his monthly calls. I’m not saying having a bond guy weigh in with his or her views can’t be productive, it’s just interesting that recently their expertise now seems to extend to broader markets.
That wasn’t always the case…bond guys in general have tried to avoid the limelight.
Valley, congrats on your recent call.
i just wondered do you have a longer term roadmap
for the bull market in terms of duration and levels?.
Apologies if you have already posted this.
Only economists such as Martin Armstrong or Harry Dent seem to have ideas long term. My goal is to eek out a few percent per month on opportunities.
Curious coincidence regarding Saturn in Sagittarius is that this entry happened in 12/1926 to 3/1929 (parabola), then again 29.5 years later 1955 to 1958 (mega bull), then again 29.5 years later 11/1985 to 1987 (mega bull). On 12/2014 Saturn entered Sag for first time this century; will the mega bull or parabola reappear?
Just looked at Dow data last hundred years inflation adjusted appears that market is way way overvalued on historical basis. A rich valuation would be 1/2 it’s current price.
Valuation only matter when fear and actual recession arrived, then the markets get hit hard.
What a powerful daily Geomagnetism Signal, John.
Wait and see.
Thank you
@apanalis
More and more convinced the dollar parabolic ended two fridays ago
biotechs last friday
A true parabolic lasts a little over 5 years from the take off point. This rise in the dollar from acceleration is only about 9 months. The chart is a massive break out, not a tiny parabolic. Fundamentally, the world is short the dollar via so much debt outside the US being denominated in dollars. Plus most of the CB’s outside the US are QEing intentionally devaluing their currency.
And the acceleration pt, no less than the solar max!
FWIW to anyone, HY bonds did firm up the last couple of days, turning my system to a Buy late Friday…
So, for tracking purposes, it’s going from a 100% short position, to a 50% long position, as of COB today…
The short position was from a 2077.50 SPX average, so another losing trade, and now back to the long side…
I expect this will be a short-lived trade, but here we are….
I, on the other hand, being much smarter than my system – hahaha – and basing it on:
a) charts I follow;
b) last week just “felt like” a speculative orgy of buying – which often turns into a top of some type;
c) and the fact that we just “barely eeked” into the buy signal Friday….
am still maintaining short positions in my actual trading accounts….for now…
I may be a “trader”, but obviously not necessarily a “disciplined” trader… :-O
100% short Monday at noon. Lunar chord negative this week. Seasonals weak. SPY up today when XTN and IBB are down (divergence).
This is a good call.
I like your short call Valley. Really appreciate you updating the board with your strategy.
IYT is tanking. It is often a leading indicator for the SPX in the past. How can the transport index tank with low oil price?
Smart money see econ weakness coming to town.
“How can the transport index tank with low oil price?”…….Deflation.
DOW Theory 101 says major indices will soon follow. Markets cannott possibly stay afloat as deflation pressures grow. I don’t care how much the CB’s ease and stimulate global debt levels are at levels never seen in history and cannot possibly be inflated away.
Nicolas will be proven wrong in assumptions that QE will continue to propel markets much higher.
I agree with you about deflation. But in regular old recessions the loss of business loses more than lower oil prices save.
Only thing that worries me is IBB leading SPY on downside. Possible that IBB the darling sector will pop up for couple days and pull SPY back up with it. Oh well.
Accumulation of short position is fine. I respect and fear the bulls since I have yet to get a sell signal… only seeing weakening of internals for now which is normal until they break below their do or die threshold.
So my action today was to have taken profit on my recent purchase of WMT.
Please look at SPY volume. Buying is drying up really fast.
Sun Tsu in his book Art of War says “He will win who knows when to fight and when not to fight”.
The market is quiet and is between catalysts. Inaction is a smart general’s action. Just observe until the next catalyst asserts itself.
In the meantime, my short scouts are stand-down with some gain.
Good trade. I am still short. Will cover if PMI inspires rally.
“One man is dragon, two men are worms.”
I am still somewhat long but stops set. Nikkei short still open and under water.
GLA
J
Here is another paper on the effects on solar activity on mood — this time suicides in India.
Click to access article1380628760_Verma.pdf
Based on the table, I regressed the variables to get the following tstats:
Intercept 1.25
Sunspot 3.73
SolarFlare -2.15
CoronalIndex -1.59
CosmicRay 0.35
Kp -1.10
Once again, CosmicRay is not useful.
Sunspot leads to mania.
SolarFlare (More significant here vs Traffic Accident dataset), CoronalIndex and Kp (Less significant here vs Traffic Accident dataset) leads to depression.
I am disappointed that I can’t find a real time value for Cornal Index. Does anyone know?
The annual data is here:
ftp://ftp.ngdc.noaa.gov/STP/SOLAR_DATA/SOLAR_CORONA/INDEX/Lomnicky/YEARLY
Therefore, even if it is statistically significant, it is not timely for us to make any predictions for 2015.
Very Interesting: Consumer Spending about to Surge:
http://www.bloomberg.com/news/articles/2015-03-23/economist-says-u-s-consumer-spending-is-about-to-surge-
Note that there is a historical precedent of a six month lag in greater consumer spending when gasoline prices fall substantially. That six month lag is about to come to an end exactly as this year’s hard winter also comes to an end (and an El Nino is expected to start up mid-July).
Gann said that each thing traded has its own personality and it is our job as traders to know.Certain stocks attract specific groups of traders.In short term trading,I focus on a handful of stocks where traders using the same tools as I do congregate. For the last nine years,GS has been my favorite.
chart
http://stockcharts.com/h-sc/ui?s=GS&p=5&yr=0&mn=0&dy=6&id=p88742109349&a=337904528&listNum=4
A trader wondered about the weakness in transports
NSC is the one transport stock I trade based on other traders
using the same set of tools repeatedly.
chart
http://stockcharts.com/h-sc/ui?s=NSC&p=5&yr=0&mn=0&dy=6&id=p52507034919&a=391098486&r=1427196972829&cmd=print
It is a good question ask” Do different groups of traders take control
of a stock from another group of traders?”
my experience has been yes.. I used to trade CF ..but a different group of traders
took over based on using much wider stops than I use… so I moved on.
here is what I mean
notice the continual prevalence of price spikes on individual bars
did not use to happen
http://stockcharts.com/h-sc/ui?s=CF&p=15&yr=0&mn=0&dy=8&id=t74151106657&a=147480304&r=1427197569920&cmd=print
I found this very interesting. Might help with long-term perspectives:
Thank you, GM.
Is the conclusion we can’t reach a CAPE peak with low rates, or that we can have low CAPE even with low rates?
Another great day for the Dax. Been great for buying the dip last few sessions.
Seem that secular lows in CAPE = peak of the interest rate cycle.(Shortage of safe havens for money?).
I need to think about that for a while.
Previous examples seem to coincide with the end of long era of credit expansion.
That would mean another 20 years til we reach that point again.
I’ll be an old man by then 😦
Demographics, money velocity
Nicolas. The biotechs have had a key reversal and gap down. Then sideways so far today. I have observed over many years that can be a 1-2 down with a 3 down immenient.
Hi Kent ! I think you raise a good point. Biotechs could correct a little more over the next few days. However I’m not worried at all. This sector is still way undervalued and the bull market still has a long way to go.
regards
Your posts were a lot funnier when i thought you were joking….
Undervalued??? lol…. the Fed’s Barnum Effect has you in its clutches… an issue of selectively noticing the things which are preferable while ignoring those things which are not. I observed the same types of posters at the last tops in 2000 and 2007!
muhahahahaha what a joke
http://www.zerohedge.com/news/2015-03-22/nearly-two-thirds-biotechs-have-no-net-income
LMAO Nicolas!
You just lost ALL credibility. The Biotech sector is selling at an average 50 X earnings and all but about 5% of biotechs are not making money so that makes it even worse.
Biotech is the dot com bubble of 2000,
Undervalued………LOL!
And just in regard to valuations, the FTSE 100 is now selling at just under 31 X av. I need to check the records but I believe that to be an all time high PE.
Just astounding. And Martin A is trying to tell us that capital is flowing just into the DAX from the rest of Europe……has he even checked the other major European indices?
Banking sector is entering Stage #3 (topping) per Stan Weinstein’s rules. (in and out of flattening Weekly 30 EMA ).
Many banks/financial services are already in Stage #4 (decline). e.g. DFS.
Sold my DFS preferred shares this morning before fear coming to town in the future. Capital gain plus 6+% interest for many years. It is OK.
Do you have the tools to check the health of the market?
Terrible Plane crash today affecting social mood? – Robert Prechter is so entertaining.
Until the major indices enter Stage #3, I fear the bulls when I try to pick their pocket from time to time.
Is the DOW making an “A-B-C” lower of its first down leg of an Ascending Diagonal Triangle? Has the “B” just topped and turned down to the lower “C”?
This means no more “V” corrections but “A-B-C” corrections instead. If there is an “A-B-C” correction lower instead of a “V” correction lower then it also raises the odds of no parabolic blow off top except for the Throw Over of an Ascending Diagonal Triangle.
On hourly charts of the DOW, over the past several days, is deeply over lapping waves which implies an Elliot upwardly corrective “B” wave to be followed by an impulsive downward “C” wave.
Is the recent and ongoing flight into Treasuries a result of reduced expectations of an increase in interest rates –or– the beginnings of Fear and Panic that the economy/stocks are going to tumble?
Today’s accelerated flight to Treasuries is pointing towards Market expectations that this Friday’s GDP report is going to disappoint.
It should be noted that it was 15 years ago –this week– that the S+P 500 hit its peak and started a multi-year decline. This ups the odds that an impulsive Elliot C wave lower is going to happen.
Is the DOW going to sell off and test its 40 week/200 day sma as it has done so many times in the past several years?
Great posts Richard. Thanks. Your analysis makes great sense. I am also anticipating an impulsive wave C this or next week.
On another note, VIX is not budging, probably because of the very organized sell-off. I am watching UVXY closely to potential entry points.
VIX is not a leading indicator in my personal experience whereas the $NYHL, and $NYADV have more predictive power. $NYHL showing a rapid decrease of officers leading the fight.
Agreed Newt. Thanks.
UVXY could potentially a 2 bagger if the markets are corrected 10%. imv.
Over the past several years take a look at Weekly Candlesticks of the DOW and its 40 week sma (200 day sma). It is most interesting. If this Friday’s GDP disappoints then I expect the DOW to sell off to its 200 day/40 week sma. Today’s accelerated rally in Treasuries is pointing towards the Market’s expectation of a disappointing GDP report.
Valley. We have a Slow Stoch. (5,1) sell signal. Bought more 2X shorts.
When the markets indeed roll over, one must sit tight on short positions. Until then, astute traders take money from both sides.
$NYUPV (up volume) down 90% in two (2) trading days. Can you say exhaustion? Advantage for the Shorts.
Newt. thanks for the slow stoch. (5,1) signal. I will study this indicator for greater accuracy on buys and sells. This seems like crystal clear bearish set up.
I added a short on China A50 today following PMI disappointment and indeed 11 month low, not stopped out of long SPX position yet (in profit) – a bit of a quiet week for me. Also closed Hang Seng long today so another good week but not so active yet – as Newt says we need to see some action…..
Good luck ofc.
J
I am in SPXU, so far 1% gain on bearish bet which I will maintain no later than Thursday, lunar and seasonals all down til Friday.
To all those Nicolas doubters, I recall that interest rates were 6% in 2000, now they are 2% and CB money printing hadn’t commenced. These two factors alone could mean this bull has a quite a few quarters left before it reaches it’s peak. The economist Martin Armstrong believes the broad markets could double in the next 2 years. Low or no interest rate on savings and CB money are a very bullish development, especially when energy prices are so low.
Valley, when somebody makes a statement that is as ridiculous as the one by Nicolas then I am sorry I will take a shot.
And MA as I pointed out has made numerous and I mean numerous, lousy calls over the last few years.
The guy talks out of both sides of his mouth. One minute he is talking of massive debt deflation and then he talks about massive flight of capital to US stocks in phase transition and gold collapsing.
I told you back in 2011 he was talking about gold blasting off in a parabolic move to 5k, which obviously did not happen and now he is talking about the DOW blasting off to 35k by 2017 whilst we get a delfationary debt spiral and sovereign debt crisis.
All this whilst he makes ZERO mention of the massive corporate debt bubble in US companies and their hugely overweight debt to cash ratios which has been a huge driver of corporate by backs.
I really question his logic and his predictions. Wjat happens to the US stock market when the corporate debt bubble blows up??
I mentioned the economist who will remain nameless only because his controversial and whimsical approach to market forecasting are unique and self assured. For this bull market to continue onward and upward in view of the massive debt, and limited earning growth seems magical thinking. Yet, zero interest rates and global QE looking for a place to park trillions of newly minted currency units might make the unlikely possible at least for a few more quarters or even years. 1929 made no sense and was a “tulip mania” or “south sea bubble”. Maybe 2017 could be a similar bubble, the CB QE “currency bubble”.
Valley/Allan,
I can see that there will be a wall of money that needs to escape from the Eurozone soon, govt bond yields there are a bigger bubble than equities. That will be the first big crack in the markets. (2015.75 according to you-know-who).
A lot of that capital could head for US equity markets, because faith will start to unravel in the CBs (at last), and large cap US equities will be seen as a safe(ish) bet.
The price predictions from Armstrong are worth ignoring, but he does appear to have a good read on how capital is currently allocated, and how it will flow as things unravel.
It could be possible for traders to make some excellent profits by shorting EZ govt bonds, and going long US shares, and also long gold and miners. Eventually the US stock market will experience a sustained bear market, but it may be less exciting than many expect, as I am sure the ECB will bid for gold to save their system, and that will recapitalise the world, and we’ll be off up for another 17-18 years, with rising inflation.
No one is doubting “Nicolas” – he is a troll with a smug attitude, dangerous opinions and no real information to speak of. At best people find him amusing, at worst I doubt and hope that anyone takes any notice.
At the moment all seems well with the bull market, just be careful whichever way you are positioned.
All the best
J
I had a meeting today. There were six of us in a room discussing investments. I’m a nobody and so were the four other guys I work with. One of the other guys is the chief investment strategist for a large asset management company that manages over 270 billion and has a number of popular indexes named after them.
His blind faith in the the omnipotence of central banking filled me with dread of the upcoming unravelling. Could have been Nicolas for all I know.
Unless one is fixed on a mind- set that crash is now or is around the corner, one has advantages over this guy. Why? One can switch his positions instantly. This guy can’t.
New thought: People of crude exporting countries get cold feet and start panic selling their foreign stock holdings.
Why do markets crash? http://arxiv.org/abs/1503.06704
Medianline sets by their very nature have both a time and
price element.An important time and price juncture is called an
X-MARKS THE SPOT defined as the coming together of lines from up sloping and down sloping sets.
Andre has said that his time work does not give amplitude in price
He has forecast a sharp sell off into APRIL 4.
Here the medianline sets give two targets exactly in his time frame
The amplitude of one would be seen as a short sharp sell off.
A move to the lower target would be seen as a mini crash.
We shall see.
http://stockcharts.com/h-sc/ui?s=$INDU&p=60&yr=1&mn=1&dy=24&id=t33628854876&a=341905337&r=1427282893917&cmd=print
AAPL , a new addition to the dow
remains on the traders dream sell signal shown last week
and has its own time price targets in line with Andre’s time.
http://stockcharts.com/h-sc/ui?s=AAPL&p=60&yr=0&mn=5&dy=19&id=p43715700282&a=383468641&r=1427285521044&cmd=print
Excellent, slater9. It’s always nice to see a confluence of aligned signals from different trading systems.
G- in my work, it is important to distinguish between trade signals and targets given by tools… the X -marks spots are targets… the trade signals are specific repetitive entries….right now I am short 5 $ INDU stocks trying to capture larger swings
but my real interest is a volatility trade and so far that has eluded me… there is an interesting setup for a signal in place… but it would require a sudden spike in indexes in the next hour….if that happens I will post volatility setup in real time.
chart
http://stockcharts.com/h-sc/ui?s=UVXY&p=5&yr=0&mn=0&dy=4&id=p76297188847&a=337841009&r=1427298011243&cmd=print
Understand – good point.
correct chart reposted
http://stockcharts.com/h-sc/ui?s=$INDU&p=60&yr=1&mn=1&dy=24&id=p79274944872&a=341905337&r=1427301476594&cmd=print
Interest rates aren’t going anywhere:
http://finance.yahoo.com/news/bernanke-interest-rates-arent-going-103000852.html
Quick silver markets; look out below:
http://www.marketwatch.com/story/stocks-are-overpriced-overleveraged-headed-for-trouble-2015-03-25?siteid=yhoof2
I just noticed another wedge!
This time the FTSE, and a nice reversal candle yesterday too:
http://screencast.com/t/F3966C05
If i were trading, I’d add a short today, with the ATH as a stop loss.
Don’t be a cheer-leading. A man is as good as his balls (if made of steel). If you are convinced that this is going down, bet against it or you can feel good about yourself.
I have just added my short position this morning again.
I am not a good trader Newt, so these days I just buy gold and the miners, and will hold most of those for 20+ years.
But it seems I can spot a FTSE trend change!!
That parabolic biowreck is epic, should be fun for a long, long while
Be careful. Nicolas could decide to buy any time and cause the IBB to violently reverse. 😉
Valley. $SPXA200R is indicative of poor sponsorship. ROC (set at 63) is showing weakening gusto during every successive rally in the past 3+ years… …and many of my tools are all pointing to the market in transition to “roll-over”. The market internals can be repaired by the bulls…by time or a correction. Lower the price to bring in new buyers is preferred by Wall Street.
Newt, the market did try to repair last week, but it was way too fast and did not include enough participants (like late December). It’s like Exxon and Apple has to do well or bust. Bonds have been rallying even through this little surge the past 2 weeks, and energy is still floundering. Only difference between now and December is that the RUT, NAZ, and world markets were not this bloated or irrational. I shorted TAN and IBB Friday. We shall see though.
I see a 10%+ haircut coming.
Specie, interesting post on the asset manager’s strong
belief in CB/FED omnipotence.
For me it’s difficult to rationalise that thinking as
anyone who has experienced several cycles will
have seen a predominant theme previously, which
appears cast iron at the time.
Macro was going to come back in to focus this week
and with DXY at current levels there is leeway for
further guidance reductions imv.
For me a weakening macro was the missing element
last year as earnings stayed strong, it made the 2014
top calls less likely, that slowly appears to be changing
on multiple current data releases.
Let’s see how the market deals with this.
A Tweeter worth following: https://twitter.com/andrewunknown
Puts up all sorts of fascinating back-tested scenarios, I’ve been following his call on the S&P recently, and he’s highlighted that dollar/euro extremes, as well as loads of other stuff. Might be of use to you.
GM. I was just teasing you! Every man gets what he wants from the market. You are alright.
Music in your ears….My contention is that a H&S is being built in the SPX. We have seen the high because of the weakness in the oil/energy sector.
I am getting many more sell signals. Sit tight for those who are short.
When the situation changed, a man must also change. This is the ZEN way of life.
Hey Newt, I used the OEXA myself, I like the TSI 7,4,7 and 25,13,7. I also like the !CVISPX histogram to identify bottoms. We also had tops this past week which are usually formulated after extreme oversold sell off, which we really did not have. Last time it was this high was back in spring/summer 2011
Thanks for sharing your tools.
This is really promising for us bears. Besides the general euphoria, their are five wave counts all over the place, much like gold in late 2011. Plus my recent buy signal is failing. For a long while only sell signals failed. Could show tide has finally turned. Leadership, IBB really getting clipped.
As I write this (intraday) the DOW is finding support at its 50 day sma. Several weeks ago it found support at its 50 day sma when it came off its all time highs but when it rallied it failed to rally to new all time highs. This points towards it breaking beneath its 50 day sma and selling off to its 100 and 200 day smas or further…..
More than likely there are stops at the 100 day sma and at the Intermediate swing low of two/three weeks ago that stand a good chance of being hit and driving the DOW down to its 200 day sma and possibly lower……
From my perspective the bears have already “lost” the main battle back in the end of Jan 2015, when technically it could have created some significant damage to the chart with a looming bearish sentiment and heads/shouldering pattern. But instead that scenario never unfolded and it rallied back strongly to print new highs in Feb.
So as it stands the March volatility printed a low (already) in mid-March and it did not even boink the anticipated 2030 SPX level either before rallying strongly. This current dip likely ending by the end of this week is probably the last great buying opportunity for quite some time.
There are too many technical support measures presently in place to prevent any significant downside from occurring. The Feb11-13 low of 2040 to the Feb23 high of 2115 has a 61.8% Fib retracement level of about 2068 which we have hit today. The 50D-MA is also at 2068 as of today. The 100D-MA is only 11 points lower. The uptrend line measured from Oct 15, 2014 low got a big bounce off the Mar 11 low (when it hit 2040) and extends out to about 2062 as of today (and rising with each subsequent day).
If the 2040 low holds then the uptrend channel projects another 120 point upside for new highs around 2160 in April. Too many folks are stating that March 2015 is going to be the all-time high and it is all downhill from here and I do not think that is the correct thesis to follow.
Who are these folks calling March 2015 ATH? Most on this forum seem to be calling October 2015.
I’ve been expecting February 2015 to be the All Time High
Equivalent to the Nikkei 40,000 in 1990
I use the OEX
nice analysis of IBB for those inclined
http://www.seeitmarket.com/biotech-sector-ibb-the-anatomy-of-a-blow-off-top-14219/?utm_source=mcverryreport.com
To Newt., Jegersmart, and other short investors, nice profit. Lunar seasonals show market continues sell off tomorrow, with snap back rally mid day Friday, and up up up into early April.
I will pay extra attention. Thanks.
Valley, another good call, congrats.
This does not look the start of some major
sell off to me, however the reasons behind
today’s US weakness are very likely to play
an increasing role as we head in to the Summer.
Phil – I still believe we’re in the larger 4th wave correction. 2120 was the top of wave 3
Short Term Charts:
Market Map had 2120 as wave 3 high – should correct in wave 4 down to 1825 area
updated
I wonder if the 1500 point marked for the drop is what you are expecting geno?
Seems a tad shallow from the extreme overvaluation you are predicting?
Thanks.
Patience, patience, taken 35% profit at 278 points profit on China A50, Nikkei short still in play but still under water by almost 200 points. TBH, if I was going to trade something now it would have to be long SPX, but will probably wait until tomorrow or the early hours to see how Asia opens. It could be a long night so will probably get a few hours kip now.
Thanks for the comments/opinions/observations – very interesting.
J
Nice charting Geno0010. This is a very bullish picture until October.
I agree – interesting and useful charts.
JH, is it time to get back in?
A pity, the sun is powering up the last few days of March — I thought it was a slam dunk case for 3/2015 peak.
Market price action encouraging though.
Geno0010, great catch! Geno was looking at buying oil at the recent low, and I warned him about falling knives. I did not know how adroit he is.
fantastic opportunity to go long Dax again. This one will be a buy and hold for me. Yellen and Draghi must be preparing an asset appreciation speech frantically.
Kent – I missed the low in OIL by .01, must be slipping. Took profit on the position today +18%. Think it’s just a wave 4 building in oil with lower levels yet to come.
I have reduced my Nikkei short exposure somewhat this morning to lock in profits. Am very light on positions right now.
J
Krish, looking at DAX and DOW now. Have taken a DOW long, although 17620ish should need to hold if I am going to keep it…..
Good luck all.
J
Holding my Dax long still buts it’s 20 points underwater at the moment. Dow for me is still not a buy as I feel a 5-10% correction is possible any moment although I doubt it will happen as the fed will soothe the markets. I await the day everyone loses faith in the fed as that will be the best shorting opportunity of the decade.
Krish, was not the Dax rise an anti-Euro play?
Hard to see the Dax performing as the Euro rallies.
Good luck though.
Yes it will struggle if the euro rallies but in that case US stocks will start getting a lift. I believe this is just a retrace before the euro dollar reaches parity towards the end of 2015. Dax will hit 15,000 so point next year is my prediction.
geno, interesting charts, thank you.
And already stopped out on the DOW for 40 points. It took 4 mins lol.
J
Bullard taking about time for the FED to begin normalising
policy as the US economy continues to improve over
the next two years.
Jimmy think again!
I agree with Bullard’s central point, which appears
to be that ZIRP risks creating asset bubbles (smiling)
and beginning the process of normalisation may now
be necessary.
I mentioned Bill Gross’s view recently that ZIRP may now
be damaging the economy as it skews
the allocation of capital.
So the FED increasingly caught between a rock and a hard
place – however as always the FED ultimately cannot
abolish the next business cycle.
While the FED may currently see the US economy continuing
to improve over the next two years, that looks highly unlikely.
http://www.marketwatch.com/story/eurozone-private-lending-stays-negative-ecb-data-2015-03-26?link=MW_home_latest_news
Disappointing news, although early as the ECB QE program is in its initial stages. This has to pick up for Europe to have any hope of a proper recovery.
Gary, how on earth can ECB QE stimulate the Eurozone
economy?, other than weakening the single currency.
It’s a tiny fraction of total GDP.
Even in Japan while QE was happening the financial markets and the economy picked up. They rolled over within a year of cessation. The US has ceased and the $ rally is like a tightening per Shiller.
Phil, perhaps this will help explain: http://www.wsj.com/articles/ecb-loans-data-suggests-qe-is-working-1427373843
Some interesting different views from geno and valley
on the short term outlook at this point.
I would look for a bounce back tomorrow,
lets see.
Ref the recent post about the new era of central bank intervention that assured a continuous bull market. When gold was like that in 2011 and oil at a permanently high plateau above $100, such talk and general belief helped me see their tops. Without realizing it, this new era is so pervasive, I drank the cool aid. I have even posted here about the importance of the credit cycle. As a side note, Robert Shilller said on Bloomberg this morning the strength in the $ was a de facto tightening.
ZIRP damage began with QE1. The longer it went on the greater the damage, which is now beginning to asert itself via deflation.
Did these idiots really believe that zero/negative rates were NOT going to cause a deflationary collapse??
I have been saying it from the outset. It’s game over as far as I am concerned until the massive globsl debt gets written off. Only then will inflation once again become possible.
Bottom line and what these moron CB’ers just don’t get…..
You can’t solve what is essentially a debt problem with more debt and easy money.
The hard lesson is about to be given.
Actually, Allan it’s not nearly that simple. You can help solve a debt problem by allowing a debtor to refinance at far lower rates of interest, thereby helping improve the debtor’s cash flow. That and supporting asset prices through the mechanism of a lower discount rate and greater risk appetites has helped considerably. Ultimately the principal has to be repaid but even that has been aided by debtor’s abilities to refinance debt and extend maturities.
A balanced view of the QE programs is necessary – there have been many positive aspects.
But of course we all know the CBs don’t control market interest rates anyway!!
QE has just been a psychological operation, and it has caused a further bubble.
Nothing more though, rates will rise when the market says so.
Kent, DXY is effectively tightening, without question.
Macro will imv prevent the FED from moving on rates
in the context of the $ index.
Only if US macro begins to surprise on the upside
would that change.
error
Allan, it terms of QE, we had the SPX under 700
with many commentators looking for sub 500
at the time.
What we would have faced was certain global depression,
no QE would have ensured the eventual recovery was
self-sustaining and V shaped, but at a huge economic
and social cost.
What CB’s have opted for is a significantly more protracted
but shallow process.
Whether their actions were justified will be discussed at
length in years to come when we are all long since
dead, buried and forgotten about.
Phil, sorry but you are incorrect. What we now have is a situation where we have insurmountable debt and the inability for growth and the onslaught of deflationary collapse with the now virtually guaranteed prospect that the SPX and all markets will lose over 95% of their value in the ensuing years.
We had the opportuntiy post GFC for market forces to determine what level interest rates should have been which would have cuased pain, but in the process it would have allowed most of the “unsustainable” debt to be written off.
Yes there would have been pain and fallout but what have we now?
A global economy where risk has been artificially eliminated leading to exorbitant speculation and excessive risk taking and debt levels never seen before in history with far more exposed to the coming deflationary collapse than would have been the case previously had we just allowed market forces to exert themselves.
This IS going to be a very painful lesson.
The chart below should be a huge warning that a crisis is underway.
Global liquidity is drying up faster than a dingo turd in the Nullabor and Central Bankers and as hard as it my be to understand, actually caused the reverse effect via ZIRP.
http://stockcharts.com/h-sc/ui?s=$USD&p=W&b=5&g=0&id=p52047495773
Toss in commodities, esp oil, and the ongoing collapse in China or as the Chinese proverb says, may you live in interesting times!
How about the economic and social cost delayed yes, but exacerbated by increasing the debt and the size of the too big to fail institutions. Did I mention the derivative markets?
biowrecks down 10% in 3 days
friday morning parabolic high
whodathunkit
Still waiting on Nicolas to advise me on my IBB position I opened on his advice…lol
Did you really?
Last I recall Nicolas was on vacation and his advice was to remain bullish as this correction on IBB wouldn’t last as long as ZIRP and QE were present.
TODAY SPX opened on gap and traded to 886… if my other work is to be negated that is make or break point….covered my shorts..did not go long… standing aside awaiting more information…. for me that pivot MUST BREAK. if a big top is in…
It should be noted too that at this mornings high NUGT triggered 886 algo sell (within 2 cents)
and has since sold off sharply.. that pivot must be negated if pm stocks are to move higher…..
Yep – a small position but a position nonetheless. I wanted to keep track of the “best trader” on this board according to some….^^
J
Lol this is a veritable circus. First Bullard, then Fisher, now Lockhart trots out.
It is obvious that they are attempting to take the heat out of the stock market and talk it down thus remiving the need for a rate hike.
The Fed knows full well they are now trapoed and can’t move on rates but at the same time know the markets are way overvalued.
So they try to talk the markets down whilst holding rates. Good luck with that.
Ref the idea that “they” the CB’s saved us from near certain depression. IT took the banks, brokers, the gov’t, fannnie and freddie, and the profligate FED to to put us in the position to have such a collapse, so it is laughable they take credit for saving us and they do not even acknowledge the part they played in the bubble. But that is what establishments do.
Kent – exactly. It is all a big lie, like a lot of things in life….:)
J
Beautiful 150+ points on the Dax long today. Hope some of you guys got into it too! Closed it as not sure what will happen tomorrow as it’s been a volatile week. Need to confirm this isn’t the start of a downtrend before committing to longer term trades. Contrary to what I said earlier I know but I’ve read a few stories today which have made me a bit wary of just buying the dip.
I don’t like the look for a hammer chopping at my face.. Covered all shorts. Let’s wait and see the reaction tomorrow on the GDP report.
This trade style is called “little knife cutting a big tree”.
Me also. Covered all shorts. Tomorrow AM lunar seasonals flip positive.
The hammer is looking good subject to confirmation, of course.
Oil and oil stocks are saving the market. They must think “oil junk bonds default risk mitigated”.
Valley. You are doing good…We will not be easily trapped for a loss.
Like the humble beaver. Many small chomps and a house is built.
Kent, regardless of any personal views on QE,
I think most would acknowledge and accept that
significant misjudgements were made pre the
financial crisis by in particular the FED.
I certainly do not see CB’s as great saviours
as they helped create the crisis, they choose
to act aggressively and will now have to deal
with gradual unwinding, the issue now is that
the business cycle may be about to turn.
Central bank omnipotence is illusory as some
of the true believers that litter most financial
boards will come to see.
Like most illusions it’s powerful, particularly as
CB’s have altered the financial cycle, however
there is a huge difference between altering and
abolishing, they later they cannot do.
CB omnipotence will join the long list of
themes that have all gone before –
“the new economy”, “the productivity miracle”.. etc
I would argue that the CB’s are not the problem. The banking SYSTEM is the problem. Fractional banking is the problem. The money supply being regulated by the bankers is the problem. To fix the problem we need a completely new monetary system, one that is NOT controlled by bankers.
We just need banks to be accountable for their bad loans.
The Eurozone are taking us the right way, banks will be allowed to fail, and they will, in their dozens, when their loans go bad.
Credit is good, if it’s a viable loan.
NUGT- the importance of back to back 886 algo was made clear to me back in 08 when off a key top AAPL triggered 5 886 algos in 6 days before plunging nearly 80 points. Here NUGT triggered back to back… a warning that the long in NUGT was questionable…
http://stockcharts.com/h-sc/ui?s=NUGT&p=5&yr=0&mn=0&dy=4&id=p47093757433&a=400607489&r=1427395181498&cmd=print
Are miners just the most hated sector ever? Gold goes down and they act like gold and go down with it. When the general equities market goes down and gold goes up, they go down with stocks. Gold is still above 1200 today and miners get hammered AGAIN. It seems as though they always just go DOWN.
They are the red headed step child of the equity markets. Always last to the table and the first one to be dismissed. Poor pitiful miners, yet every few years they get a few months of glory. Maybe this year or next.
This is the problem trading issues that are clearly in a down trend. No one knows where the bottom lies. Avoid.
Question to solar investors:
Why base your investment decisions on one factor, the waxing and waning of solar activity which is unpredictable and doesn’t predict accurately price moves in equities every decade? Why not stay in the market all the time either long or short based upon either technical indicators (EW, Fib, MA) or lunar (phase, distance, declination) or seasonal (this sell off was during seasonal bitter spot as are many) or combination of all three? A binary investing style based only upon solar max/min seems highly restrictive when JH’s article the LunarEdge and a variety of other sources shows each month has predictive aspects that can inform trade decisions regardless of the ambient solar energy patterns.
It is the major background within which one trades. It along with dozens of other indicators made us look for a top, which I haven’t found yet.
I failed to see how any of the indicators you listed can tell when to short, but perhaps you found something… most of what I have found say something like bad period 0.2% vs good period 3.0%.
Lunar chord is what I use. Have discussed it too many times to repeat. Seems to work. Will see if continues to work in future.
If you haven’t read JH’s Lunar Edge article recommend it. It shows main aspect of Lunar Chord which is most gains around New Moon.
OIL probably in 4th wave like yay
Take your profits and run like yay
Oil optimal price time
Wow! Definitely the plunge protection team working on the DAX. 300 point swing in a couple days. In hindsight closed my long too early.
I would say rather EURUSD sharp drop from 1.10 to 1.08….
finished minor wave 4 correction, wave 5 minor higher high and bigger degree 4 to 11000….. of course the EUR will move above 1.10
From MarketWatch: This week the S&P 500 started with three trading sessions ending at the lows of the day. That’s a rare and bearish scenario known as “three black crows” to the market technicians.
Wikipedia: Three black crows is a term used by stock market analysts to describe a market downturn. It appears on a candlestick chart in the financial markets. It unfolds across three trading sessions, and consists of three long candlesticks that trend downward like a staircase. Each candle should open below the previous day’s open, ideally in the middle price range of that previous day. Each candlestick should also close progressively downward to establish a new near-term low. The pattern indicates a strong price reversal from a bull market to a bear market.
The three black crows help to confirm that a bull market has ended and market sentiment has turned negative. In Japanese Candlestick Charting Techniques, technical analyst Steve Nison says “The three black crows would likely be useful for longer-term traders
Actually 3 days in a row ending exactly on the lows has NEVER happened before on S&P500 according to my charts.
I’m unsure of its significance therefore.
Valley, you have made some strong calls recently
so lunar chord is working well for you.
I expect that sometimes when people use a particular
metric that may have worked well in the past,
it’s psychologically tough to let go to a degree
and perhaps attempt to factor in alternatives
(when it appears to stop working well).
Japan’s ongoing failed experiment. How long will they continue before they stop doing what they are doing and accept that it doesn’t work.
Just as it failed in Japan it will fail elsewhere too.
You can’t solve what is a debt issue, with more debt OR zero/negative rates. Whether that be Government, public or private debt.
http://www.businessinsider.com.au/japan-february-2015-inflation-abenomics-2015-3
Actually the video at the end of this article which has nithing to do with economics is probably far more interesting lol
Allan
I don’t think that there is anyone here would disagree that you cannot repay debts with more debts. Everyone has their head in the sand (or up their ass) on this.
Sooner or later we have to get rid of the concept of “money” altogether. It is a self-defeating system, but perhaps was useful a few hundred years ago when you still had to swap chickens for bread and whatever.
We don’t burn witches anymore, why do we still use money (debt)?
J
There’s no way we can function as a species without money, our systems require a means of payment.
No, we just need a better form of money, one that is managed to maintain its stability, is free from political abuse, and that is widely used.
It’s called the Euro by the way, and it’s here to stay. (And many others are looking at currency unions too: Africa, Middle East, Asia). One day we’ll get there for the whole planet I hope.
Valley. $CPCE EMA 21 showing lower highs.
$NYAD (cumulative) positive divergence. If and when it hook up above EMA 13, a buy sign. This is insignificant.
My indicators say this correction is not the big one wish by the perma-bears. Not yet!.
Today, watching more selling and detect internal improvement, if any.
correction: I meant $NYAD (cumulative) positive divergence is significant.
went long.
dollar bounce looks about done
biowreck prolly soon 2
you can study charts for decades without finding a better parabolic ending monthly candle than the ones on the dollar and the biowrecks
of course the biowrecks is bigger and longer but i’m not sure which is more important
the universal bullishness on the dollar will be punished severly
Quadruple failed top in the NYA. Bearish divergences in the transports, vix and summation index. The 200 dma near 2010 will come into play soon.
Yeah. NYA could be topping and rolling over …yet, The weekly chart can also be read as a powerful I&HS being built. A consolidation that may result in another uptrend. so, I suggest you keep an open mind.
But inverted head and shoulders are bottoming patterns Newt?
I see the NYA as another big wedge, not yet broken, but not far off it.
Or a large rounded top. Both.
Went long. End of March into early April has history of 3 days of gap up prices. Low tide tomorrow often price nadir. Declination looks positive all next week. Made a few dollar with short, so if long doesn’t pan out will be even.
Thanks Valley. I’m looking for a wave 2 up next week, so should be bullish.
Wow! So we attack the market with different tools and drawn the same action.
Dr. Copper weekly is making a large Shooting Star.
Copper’s weekly candle stick is pointing towards no housing boom this year and that means no demand for materials and that means no inflation and that means no interest rate increases and that raises the question as to why the USD is so high.
Note that the recent rally in treasuries agrees with Copper in that there is no increasing “demand” that will cause inflation with its resulting interest rate rises.
Per COT (commitments of traders), Dr Copper is inverted. Normally producers (commercials) sell more and more as prices rise. Thus they are maximum long at bottoms and max short at tops. Large Speculators are exactly the opposite. Well, at the beginning of copper’s great bull market, the commercials were max short and specs max long. Since that bull mkt that began in 2003, commercials have gone full circle and are max long. As long now as they were short in 2003. Hence, one could say we are ready to start a bear mkt except it has been underway for 3 years. Plus it is in position that in most other commodities would be considered bullish. For example,the commercials in oil were more net short than they have ever been in the last 25 years before this recent decline started. A possible explanation is swap traders have increased their positions a lot in copper. they are long traders which buy for large retirement funds etc that want commodities to diversify in non-correlated assets. As they have already had their heads handed to them in the number one sure thing (oil) one would think they would tread lightly. Per the last severa years copper is bearish but by the time you learn the rules, they change the rules.
CNIT recommended last week, having a nice day up 13%
Slater pug “get out of Dodge”
What will the Fed Chair say at 3:45EST? Could change market direction for Monday. Hope it is bullish.
Yellen translation.
“Interest rates will NOT be going up this year or next year or anytime in the decade if I can help it, because the global economy is up the virtual creek. As such the stock market lead by the “slop and pee” IS now all that stands between maintaining the illusion of confidence and all out disaster.The only trick we have in our bag of tricks is low rates”
No wonder Martin Armstrong has such a difficult time in this kind of environment.
Last three trading days of March until close of fourth trading day of April has closed higher fifteen of last eighteen years in US. This is 83% of the time.
Thanks for the stat. Bulls made pretty good progress in repairing the internals today. My long ended with a small profit. Lets see what Monday will bring.
Ideally I like to buy the penetration from below the lower Bollinger band. This time I bought in anticipation of a hook above the BB mid-line. Riskier trade but this is how I probe the market. So far so good.
I see more whipsaws ahead.$NYAD (cumulative) will eventually show me which side has the conviction.. For now, just trade.
Same here, a little profit. I think on the DOW at least we should look to clear the 760 area asap next week or the short term downtrend may endure for a while.
Good weekend to you all.
J
Almost everyone I know thinks we will have a nice bounce next week. That action at the close was not indicative of a strong bounce. Next week should be fascinating.
in above post trader PAUL posted ”slater pug’ get out of dodge”’
I have stated here in the past that I think that steve at pugsma is
the most gifted elliot analyst i have seen in my trading life.
However I was tossed from his site a few years ago after being an invited contributor so I do not know his current outlook.. however, my own elliot
learned from watching at pugs agrees that an important top is either in place or very near if that is what get out of dodge means.
A note,, neither Steve at pugs or Caldaro knew that .886 was a fib number
until I showed it to them. Now they both use it in their analysis.
Respectfully disagree with valley, geno, newt and others on this board that next week will be a rally week. On the contrary, I think markets will continue making lower highs and lower lows. All the divergences are in place for another red cable week.
my strategy is similar to gm. I am accumulating miners on dips, and been holding oil for the past few weeks.
Please share your rationale why you expect lower lows next week? Thanks.
A-“greed”. Next week could be down. And if it is I will sell. Just that 83% of time market has risen (sometimes A LOT) last 18 years. Three crows pattern mentioned earlier seems ominous, and earnings due to strong dollar are falling; benefit of going with seasonal lunar is I can get out next week with minor loss, knowing that I tried to trade with the system and as such on long term basis should outperform.
We still have 92% odds of a new high before breaking below 2039.69. My lunar cycle is showing weakness until April 6th ish, More often than not, when the SP-500 is trading above the 67 sma on 10m chart, you should be bullish.
I think USD/EUR will be key next week. USD may continue into its daily cycle low while Europe rallies, which means a wave 4 type bounce in oil at least until the unemployment report where USD might start bouncing out around 96 or so.
Stock market is currently at week 24 since the cycle low on 10/15/14. A new intermediate cycle low is fully expected in the next 4-6 weeks imv.
Thanks, Geno0010 for the 67 sma, 10m chart idea. What a coincidence April 6 is the conjuction of the planet Uranus which typically adds some negative spin on market for a week or two afterwards.
Hi newt. My reasoning is very simple. Cycle count where the markets are currently deep into an intermediate cycle low, which at most could go until early May. A weekly red candle where the trend line was decidedly broken, and the normal divergences. That plus the unemployment report next week where the data was expected to be unfavorable. I was expecting a decidedly strong bounce a wave 4 on Thursday. It didn’t happen. It is whipsawing instead, and markets were simply saved the last 15 minutes of Friday by Yellen’s comments.
My plan next week. I will close my long if and when $NYA closes below 10,825,
Why 10,825?
1. It is the 30 week EMA line (at 10,875). This is significant per the Stan Weinstein (4 stages of market) system.
2. $NYA Weekly 30 EMA was successfully tested 3 times since March 17th.
3. Thursday’s loose doji /spinning top and Friday’s small hammer pattern has effectively halted selling pressure.
Selling can resume next week. …of course . and I will step aside.
Good luck to everyone.
PS. $NYAD (cumulative) still looks healthy and Friday’s rally popped the AD line above the BB-mid-line.
Your cycle count is right that is why we will see a correction 8-10%
but you are forgetting the shorter cycles – we saw or we will see next week 40 trading days cycle low and at least a week higher.
The DAX finished a-b-c too so the chance is higher to see another move up… imho
Kami. Great points. I am not forgetting about the daily cycle count. While it can’t be ruled out that the markets could bounce here first, before heading down to its overdue intermediate cycle low, I think the more likely scenario based on kast week red candke is that the sell off resumes first, taking the markets to their cycle low in April. If that is the case, then I would expect the bounce from the intermediate cycle low to take the markets back to the marginally new highs.
Best months of the year are April and July. Even in a bear market April will lose little at worst. If in mid April the month is down a lot, just buy it into month end.
Thanks all, new post out