
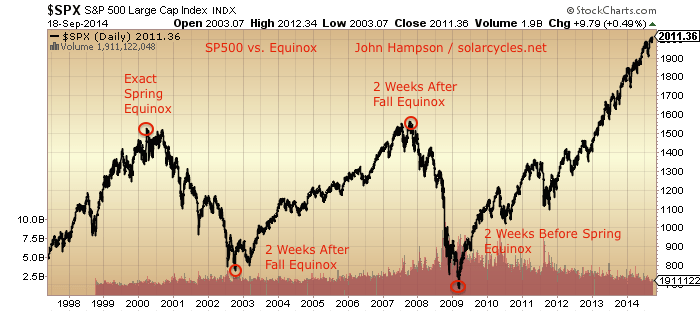
Tuesday 23rd September is the Fall/Autumn equinox. Equinoxes occur twice a year, the other being around 20th March.
The last 4 major tops and bottoms in the SP500 all fell within 2 weeks of an equinox:

Extending this to include major turns in the period that took place within 2 weeks of an equinox, we get this:
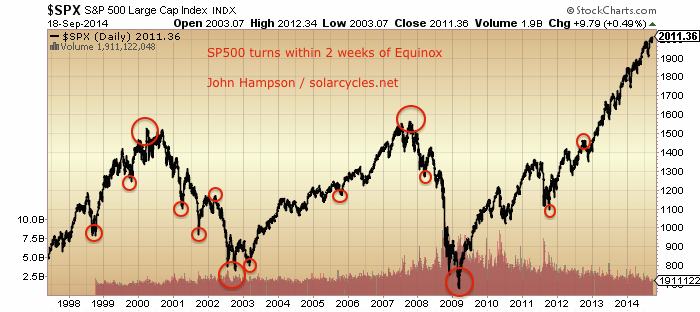 In total 10 bottoms and 4 tops. The dominance of bottoms fits with the seasonal model of the stock market, which is based on the seasonality of geomagnetism, and has lows near the two equinoxes:
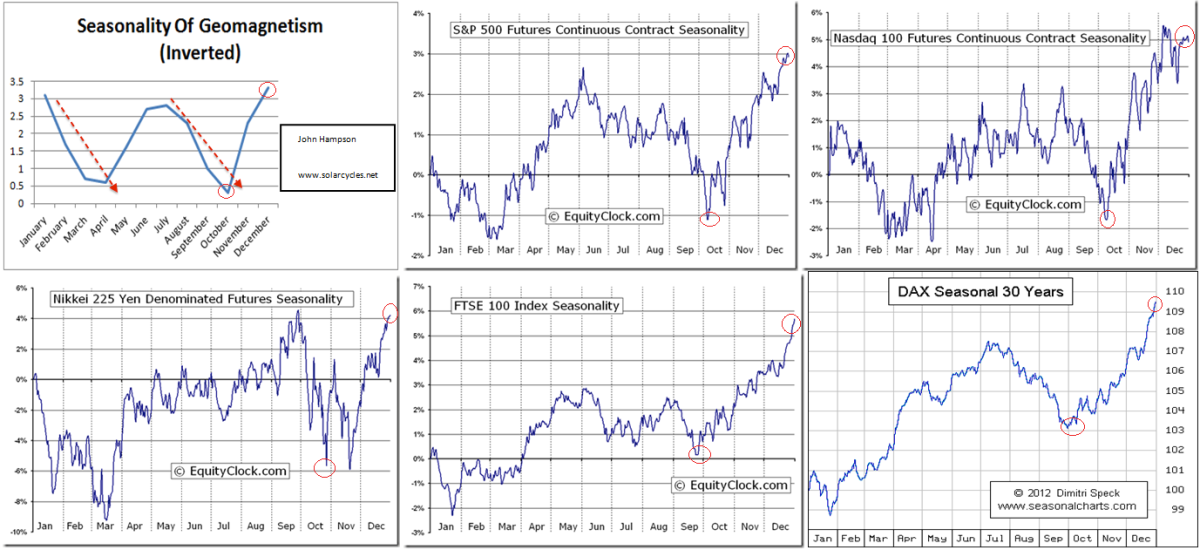 The two red arrows on the ‘seasonality of geomagnetism’ chart show when stock market crashes have predominantly occurred in history. Therefore, bottoms or lows not far from the equinoxes make sense.
Highs around the equinox? Inversions happen occasionally in lunar phasing. Full moons bring about pessimism and typically mark lows, but now and again they can invert as a high. As geomagnetism is a similar sentiment phenomenon, I expect the same sometimes happens here, but I can’t be more scientific. Nonetheless, if next week’s equinox is to have any relevance, then it would most likely be as a top, or inversion high, because we have not seen a period of selling into it for it to mark a low, as we did into the lows 1998-2011 shown above.
Looking further back in stock market history, in 1987 stocks peaked 1 month before the Fall equinox and completed their devastation one month after, so centred around it. The 1976 top and 1978 bottom in the Dow were both within 2 weeks of equinoxes, but other major tops and bottoms in the 1970s secular bear didn’t align, clustering rather at the turn of the year and seasonal high. In 1929 there was a mini-crash March 25 (equinox), the Dow topped 3 September, the London stock exchange crashed 20 September (equinox), and the whole combined crash process was done by November 13.
In short, I would summarise that maybe there is an equinox phenomenon. The most compelling reason for it is the stock market seasonal lows that occur close to them (circa March and October), driven by geomagnetism which affects human sentiment. On these grounds, most major turns would be lows at equinoxes, and just occasionally we would see an inverted high.
One more add: next week’s equinox falls one day from the new moon and new moons typically mark highs (both minor turns and major peaks) so if it were to mark a high then there’s an additional reason for it to do so. For this to have any merit, stock market indicators would need to be signalling such an imminent peak.
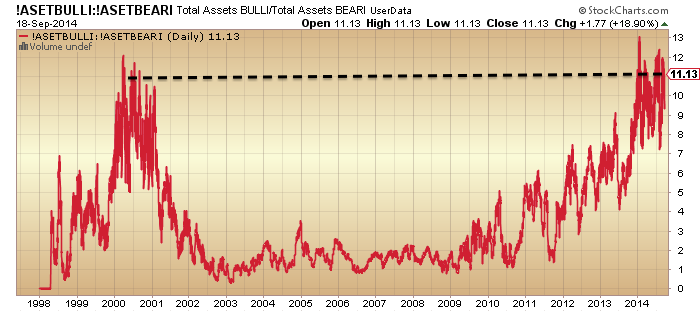
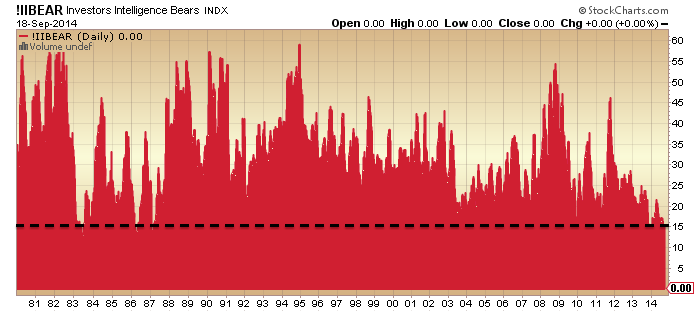
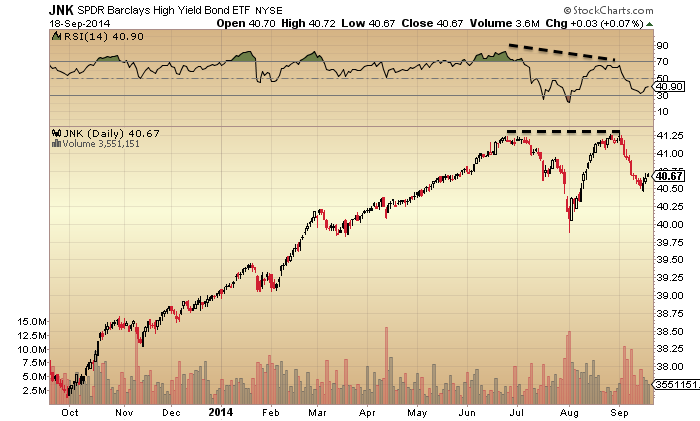
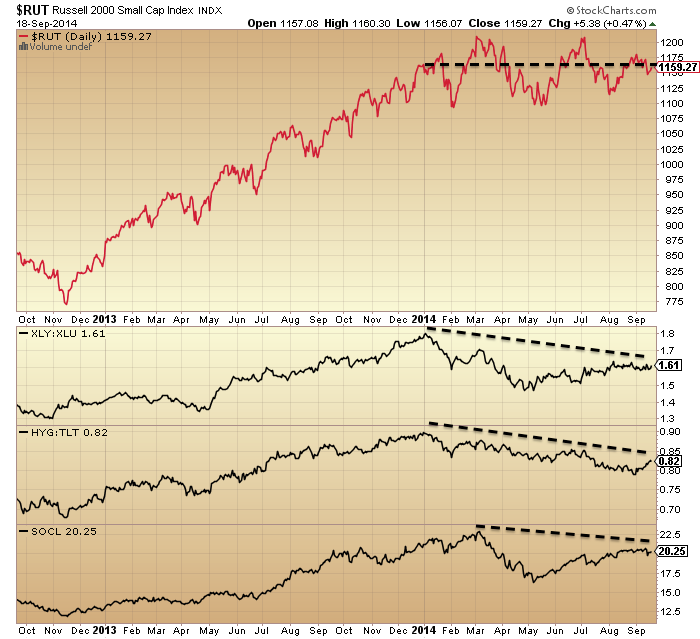
Yesterday was a bullish day for large caps and overnight action looks to have cemented a break out. Small caps and junk bonds again didn’t share the optimism, negative divergences persist on large caps, sentiment and allocations are very stretched, and ‘normally’ this would mean an attempted breakout becomes a fake-out. Wider indicators continue to warn that this is the last gasps of a topping process, and as I have covered recently there is no case for a rally much higher or much longer. e.g. 20% higher into mid-2015, as this would negate a whole host of reliable indicators. The evidence leads me to believe that the stock market will peak here and collapse through the seasonal low of October – or, failing that – it presses on and peaks at the seasonal high of the year-end (a historical clustering targets 31 Dec).
I have difficulty believing the end-of-year option because indicator extremes and divergences are already very mature, whilst sentiment and allocations suggest little fuel for higher or longer. We would need to print anomalies in various indicators with different angles on the market to achieve it, and it would be a major stretch to achieve. Additionally, the smoothed solar max looks likely to have been around March and various risk measures peaked then or either side of that, which suggests this is already ‘borrowed time’. That said, price just won’t obey yet and until it does, I have to consider this possibility.
If large caps consolidate their breakout and push on through the new moon and equinox, pulling up small caps and other laggards too, then the end-of-year option will gain weight. If stocks hold up through the month of October then that would seal it, in my opinion.
But… the charts below show how things stand, and these are why I just can’t believe the market can truly break out upwards here. These charts are indeed supportive of a new moon / equinox peak. Plus it’s the week after expiration, normally bearish, and also a week of geomagnetic disturbance is predicted.
 I may cut back short positions if (despite the indicators) stocks collectively motor here, but my eye is on the new moon / equinox combination next week. UBS see high likelihood of an important reversal in the next 3 sessions, and FX positions and technicals continue to be extreme, suggestive of an imminent reversal with associations for risk.

First it was the market peaked in February, then a double top. Then it was the full moon, now the equinox. But new highs keep coming. If you call the top every day eventually you will be right.
What you are missing is that demographics are global and capital is global. When a young business man in Africa or Latin America invests his spare capital it is in the USA markets and not Lagos or Santiago. Just like when a young boy flees Guatemala it is to Texas and not Brasilia.
Global capital flows are fleeing China (fear of political purge), Russia (fear of Putin crack down and sanctions), Latin America (creeping socialism), the Mid East (Islamic fanatics), Europe (collapsing socialism) and Africa (corruption). Where does it go? Into US dollars and stocks. The DOW will double from here and the dollar will approach 95 on the DXY. Yes there will be a correction but not a top.
Fund flows into US equities are negative for 2014, so that doesn’t square.
I played the markets long 2009-2013. I made my first topping call as 31 Dec 2013, and that remains the exact date that various cross-risk assets peaked. Since then indicators clearly show us to be in a topping process, and it has been frustrating that the drop has not yet occurred. But it is what it is: a multi-angled cross referenced case for a peak, and as objective as I can make it.
John,
Many thanks for the work you do and for your generosity in sharing it. And for your kindness and patience in responding to the naysayers. Top calling is one of the most difficult things to attempt in the stock market, not only because exact timing is nearly impossible but also because tops are a process that can take many months. I admire your conviction to stand with the historical data and to look at the current data and adjust your position if conditions warrant. Have a great weekend!
Thanks Pima
what about india,japan & australia
Thanks John.
Adding to the appropriateness of the near Equinox top is the eclipse pair coming Oct 8 and Oct 21, while Financial New Year (Diwali)–Sun/Moon new Moon in Libra sidereal– is Oct 24. I am expecting an equity final high Oct 15 with a Sun Ve Rahu and retrograde Merc cluster, so a bit delayed from the equinox. At the equinoxes Sun is either exalted or debilitated and this fits with the phenomena.
exalted or deb in the Western system. Sun is in Virgo sidereal (a.k.a. star based a.k.a. eastern a.k.a. jyotish). When it comes to planetary strength based on signs, the eastern system is more reliable IMO.
Who is Pima Canyon – I live near there – Is that you Larry?
Earthabides I have moved this rsponse to you from the previous thread:
“Earthabides, interesting read and you hit the nail on the head. “Confidence”.
Gold, as most believe is NOT a hedge against inflation and as such does not respond to inflation OR for that matter, DEFLATION in the way most assme it does.
Those that say that gold will decline during any future depression and that gold will offer no safe haven are completely wrong. Those that sight the lack of rise in gold during the Great Depression as evidence as such, are basing their case on incorrect perceptions.
Gold is then, a hedge against a lack of confidence in Governments, fiat currencies and uncertainty and it is why gold will go up in price during inlation or depression, because both of these lead to instability and thus confidence issues.
And that is why when we look to the depression to give us a indication of how gold will perform we need to see it in the context of a “lack of confidence and uncertainty.”
Of course during the depression the gold price was set at $20 per ounce until eventually being raised to $35, however Homestake Mining share prices, which were the best proxy for gold at the time, did in fact rise onsiderably.
From that we can reasonably expect that the gold price will rise during a drepession not decline.
Let’s see where some of that 80 triilion goes when reality hits!”
Allan:
I have no love for gold. It is however the third leg of the Triad made up of the “most fungible and liquid currencies”. I think we could see $3K+ in a year, and then right back down to $600. I’m playing an anomaly in what is, the “broken price setting system”. During a depression, energy and gold miners are good dividend payers. They are a good place to park until better investments show up. For now, a couple of $K put into NUGT/INUG might be rewarding. As for those hedging against the rise in gold, or the decline in the dollar, it never was about fundamentals. The relevance of fundamentals was killed a while back. For now, I’m hedging that someone’s bluff is going to be called. The more adamant the pros, and the more snide the cons, the more I’ll wager. It’s just that they are somewhat balanced right now, so hence the limited wager. I think both sides will be surprised by the how and why the price plays out.
Good hunting!
Hi John,
Now you are back on ground I prefer soli-lunar cycles). I’d be grateful if you could let me know where you get the geomagnetism data (from the geomagnetism inverted chart).
I’d like to take a look at the data myself.
I have seen some truns near spring/autumn equinox, some near the solstices but nothing concrete. I think the eclipses have more bearing than the equinox but we have eclipses coming so lets see what happens.
I have gone from 100% long on 3 September to now 25% long (rest cash).
Using Andre’s gravity work and having read around the subject myself I picked a high turning point on 3rd September, followed by dip to 10th Sept, a high 18th Sept then a dip to 10th Oct.
Using my longer 17.6 year cycle I am looking for a significant low in 2015.
Let’s see what happens.
FWIW i think demographics are too slow and blunt to use on markets but I have always liked your use of solar, lunar and geomagnetic cycles.
Keep up the good work,
Kerry
Kerry has asked me to post this:
Hi Kerry, please would you provide an explanation of what this graphic is trying to tell us?
Thanks
Hi Nexar,
The Balenthiran Cycle diagram, above, shows the secular bull market cycle from 1982 to 2000 and the secular bear market from 2000 to 2018. By studying price data from the Dow Jones Industrial Average going back 100 years, I have demonstrated that this cycle works from 1929 to 1947, 1947 to 1965 and 1965 to 1982. I have then extrapolated the cycle forwards to provide a market roadmap stretching out to 2053, which outlines the changing character of the stock market through the different phases of the 17.6 year stock market cycle. All of these 17.6 year bull/bear periods follow the pattern above.
The green segments are cyclical bull markets that typically last for around 4.4 years and the red segments are cyclical bear markets that last for around 2.2 years. Although significant progress is made during bull markets, bear markets can result in either a sizable drop or an overall period of sideways movement.
I am not saying that from bottom to top is exactly 4.4 years, what I have shown is that the year of the top/bottom falls during the years outlined by my cycle above.
The full cycle from top to top is 2 x 17.6 years, but each half has its own distinct pattern. There is already some recognition of a 17.6 year stock market cycle, notably by Art Cashin, so it made sense to refer to it as a 17.6 year cycle. While others have noticed a 17.6 year cycle, no one else has split into the cycle pattern above. I identified this without knowing about 17.6 year cycles.
The 2.2 year and 4.4 year increments refer to bullish and bearish phases and not specific turn dates. Therefore while the 2007 to 2009 top to bottom was shorter than 2.2 years, the cycle shows a top in 2007 and bottom in 2009 based on this historic pattern going back 100 years for the DJIA.
The period 2011 to 2013 is shown as a bearish period. These bearish periods can either result in a significant sell off or overall sideways movement and following the May 2011 top there was a 20% correction and the sideways period ended 2 Jan 2013.
As Peggy said in a comment to another post, the latter period of the secular bear are characterised by large swings which is why they are all coloured red. So even though we had a massive move up since 2 Jan 2013, I still expect a significant low in 2015, but not lower than the 2009 low which I believe is THE low of this secular bear (ala 1974 in the last secular bear).
What I am struggling with is shorter term cycles and trying to time a top to within a few months. But I am definitely in the solar-lunar influences camp (perhaps with Mercury thrown in).
ATB,
Kerry
Thanks Kerry. which tidal station are you using? I’ve noticed there is a difference between local tides and “open” ocean tides. Lately I have been watching Georges Shoal tidal station (extremes and low tides crossing “0”).
Hi Peggy,
Sandy Hook and The Battery. I am not saying it works but it is something I am following with interest.
Kerry
I watched both of those stations for a while. I am liking Brooklyn Bridge (East River) better for local tides.
I’m writing this as a reply to Peggy because there is no reply link under Kerry’s answer to me.
———-
Kerry, thanks very much for your well detailed and clear answer. The fact that you’ve been able to get these patterns from over 100+ year data makes it both interesting and worthy of further consideration.
I’ll make a note of this and try following it.
You mentioned that you believe the 2009 low to be THE low for this secular bear. Please can you expand on why you believe it to be so.
Thanks again.
thanks John.
Long term trend line at 109.35 in usd/yen held so far. Potential for a negative wick on the daily. Meaningful top in the carry trade and a backtest of pre Lehman.
hi John, ok I know you don’t tend to focus on individual stocks but I was wondering what your take is on the Alibaba IPO that everyone is talking about? Is it the next big thing?
I don’t know enough about it, maybe someone else can chip in
I think it is a disaster waiting to happen. The internet is the first to go when China has any unrest. Now that the IPO is in the US, lawsuit over counterfeit products can be brought on. Finally, Jack Ma controls the actual company. You are buying a shell that shares the profits, but what if Jack Ma starts selling parts of it to himself for a low price. The legal system in China is not tested.
stock will be trading on 16x sales which is within the reach of the excessive multiples we have seen earlier in the year for cloud based software. This compares to Chinese internet peer Baidu on closer to 10x.
Very logical presentation, as always. You are the Spock of market forecasting. VIX not confirming new SPX highs since June. Trend for VIX is up at major peaks as markets/breadth diverge. Play the volatility from here to top. Why risk holding long positions for such a slim chance of melt up. No?
Can’t find any news on Tim Cook’s exercise of options of 560,000 shares. Does this not imply a major dump is imminent? Any thoughts?
Anyone? https://www.youtube.com/watch?v=uhiCFdWeQfA
Thanks for the vix tip
Thanks for your research.
vix is a coincident indicator
funstein, if you are searching for certainty
in timing markets you will not find it.
What you may find is probability.
John is generous enough to share the huge
amount of work he puts in to this blog,
he does not ask anyone to follow him.
Note to all ‘gold promoters’, associated gold bug gurus; and the insanely bullish forecasts from newsletter writers since 2011:
“Better to remain silent and be thought a fool than to speak out and remove all doubt.”
Abraham Lincoln.
==============
Phil, I submit that a risk free trade is to short gold on any rallies; and just chill and relax. Paper profits will flow in as gold is hammered down < 1000.
Looks like most are worshiping at the alter for paper lovers.
Re. BABA IPO, some are expecting reallocation of funds to hit other older names in the sector. With this in mind, clear retests on names like FB and TWTR are perhaps worth stalking for a possible down move.
Also watching today’s candles on EURUSD and EURGBP for possible reversals, now that we have #indyref out of the way.
GBPUSD getting hammered today…
I’m so hapy to have switched to the bull side. I’m doing well. I was looking to short gold, it looks like it’s a low risk trade, everybody sees it below 1000$ soon.
keep smiling as the internals are going to rape this rally
This stuff really piques my interest, now if the market would just go down! A large portion of the mkt has corrected significantly, but the others have kept charging ahead.
Hi John,
In your last thread you commented u were long 2009-2013. I recall the bottom in April 09 was still expensive based on numerous indicators, some of which you have shown. How did you know it was time to go back in? Did you think we were starting a new bull market? Did you consider we might fail a bounce as in previous crashes? Did the Fed intervention influence your decision to invest? It is clear to me in hind sight that many did not understand the effect of monetary policy for the future markets… Did you? And lastly, was your site and commentary running in 2009?
Thank you for all your insights, education on so many aspects of these markets and incredible amount of time you spend sharing your thoughts and perspective for all to use as they wish. Much appreciated.
Thanks Alexa. It’s hard to recall, but a variety of indicators showing oversold, overbearish, exhaustion, positive divergences – the usual stuff. But I was not as clued up then as now. I had a different site back then, now deleted.
Hi John
I remember your previous site from it’s inception, and prior to that your posts on iii MCX.
Here’s a blast from the past:
http://www.iii.co.uk/investment/detail?code=cotn%3AMCX.L&display=discussion&threshold=0&action=detail&id=5880977
In the early days of this bull market you (correctly) maintained a bullish bias during the 2010 & 2011 sharp corrections. In the post you refer to a resumption of the bear market in 2012, but given this was made in early 2010, and factoring the FEDs unprecedented stimulus, I don’t think this was a bad shout at that time.
We exchanged several emails about the state of the markets back then and for the record, your convictions were largely accurate and consequently your trading was profitable.
The old adage that tops are a process and bottoms are an event rings true IMVHO. I think it’s fair to say that you were early in calling a top to this bull. But, I believe time will show that you correctly identified the beginning of the topping process.
For me, the one thing that has been a consistent feature of your work is the research you put in to arrive at your conclusions. I can’t imagine any of your readers would argue this point.
Lastly, FWIW I think your rewards will come and possibly quite soon…is that a topping tail on yesterday’s Dow daily candle?
ATB
TDL
Thanks TDL. Yes I was too early with my original topping call. But when I look back at it, I had over 30 indicators together in early Jan, so I can’t have too many regrets.
Hi John,
Good work on new moon and fall equinox. You have it right. The rule for new moon is 83% effective in turning the markets, and it will happen within 2 trading days. Since the next new moon is on Wed., that opens the entire week up as a possibility.
When we look at Fib. time projections on a weekly chart, we see next week is Fib. 8 weeks from 1904ish low on 8/04 week, 13 weeks from 6/30 high, 26 weeks from 3/31 high, and Fib. 34 weeks from 2/03 low.
When we look at the minimum price target, it was hit on SPX at open today.
When we look at the pattern, it allows for another leg up, but the next leg up may be weak, making a double top, making a slightly higher high, or it could even be a 5th failure.
My pattern work has continued to show higher highs were coming all this year, BUT, things are changing now. I can make a case for the end of this bull leg measured in terms of hours now rather than months, weeks, or days.
We should be able to probe short at any new high next week.
Sorry I had to be a contrarian until now, but the pattern has been right. Predicting each low within 2 points. Lets hope when the trend changes, it will predict the highs ( bounces) with the same accuracy.
Sounds promising, thanks
I admit I was entirely wrong with my call for bearish end of week. The fact that S&P closed above 2011 is obviously invalidating this bearishness and another possibilities must be considered. 2002-2010 was strong resistance cluster and bulls will use it now as support. Steve T introduced interesting scenario yesterday in which we may deal now with kind of expanded flat pattern like in Jan-Feb’14.Basically it would mean more chop in 1990-2020 area with swift decline to 1900-1930 afterwards. But frankly, this is lesser probability for me now. Odds are shifting now to immediate extension of this wave up to 2080-2100. Today VIX is testing that support line it has used since beginning of July. Either it bounces strongly or gives up. It may give up.
Just to clarify … Mar 7 2014 at that point in time is equivalent to Sep 4 2014, so the fractal mirror is tracking Mar 2014 presently. What appears to be happening again is another “W” pattern top and we have just about carved out the “middle” of the “W”. That is why the market keeps making incrementally higher 52-week highs in SPX in the area of 5 points higher high before selling off quickly.
Alibaba just started trading above $90 as I type … interesting next two days!
applying tide turns to your March 7 fractal gives 9/27 L, 10/2 H and 10/9 or 10/12 LL. If the next turns match the March fractal exactly: 9/21 H, 9/27 L, 10/5 HH and 10/L3 LL. The planetary price for the Lunar Eclipse is 1965.
Be careful with gold. Seems like gold miners, oil/gas, and coal are tanking.
I thought the Blackstone IPO in June 2007 could be a marker for the beginning of the end of that bull, and perhaps Alibaba will do the same.
Also Bid going under 38 might give a hint.
http://bigcharts.marketwatch.com/advchart/frames/frames.asp?show=&insttype=&symb=BID&time=13&startdate=1%2F4%2F1999&enddate=10%2F23%2F2013&freq=2&compidx=aaaaa%3A0&comptemptext=SPX&comp=SPX&ma=6&maval=67&uf=8&lf=4&lf2=2&lf3=32&type=4&style=320&size=4&timeFrameToggle=false&compareToToggle=false&indicatorsToggle=false&chartStyleToggle=false&state=8&x=0&y=0
good point on Bid. Peak speculation in art and collectibles in Dec 13 with the general stock market the last to get the memo. As usual.
BID is always a good “tell”.
anyone long should get out now…
ALL HAIL YELLEN!
BOW BEFORE YOUR KEEPERS!
DIPPERS WILL REAP REWARDS!
ALL HAIL YELLEN!
Rubbish
US stocks are now the only game in town. Gold down, softs down, EUR, AUD, GBP all down. But this move feels very extreme to me. Yes I know ppl are looking for some blow off top straight to SPX 2200 or above tho
you game is in a rigged house and you are the mark
get out now
I am not even long US stocks……… i haven’t been long US stocks most of this year.
I just shorted more gold etbought more QQQ. And also shorted more GDX as gold miners are way overvalued. Once the nasdaq breaks through 5000, the real bull market will begin.
nick is a kick as he worships his masters and buys the dips
nick will take his licks
Yellen’s lies
Looking like both Hindenburg Omen and R2k death cross will happen today.
IWM is one of the non-confiming elements in my system and it is SCREAMING
watch XRT at 88 – that will be the big trigger
Nicolas, can you please explain why gold stocks are way overvalued?
well, miners are always going fast when the price of gold goes down. Since, everybody knows gold is going below 1000$, i expect to see GDX at 10$ shortly. After that, we might get a rebound to 10.30$ before continuing the bear market.
So “everybody knows gold is going below $1,000”? You do know what happens when “everybody” believes something will happen, right? There are far too many gold bears now, just like at the bottom last year and in 2008. My math (proprietary and not to be shared) shows that gold won’t break last year’s low of $1179.40.
There is only one truly undervalued sector in the world today. Guess which one it is.
BABA might trip it’s circuit breaker. Thought I heard someone on CNBC say 10%.
Another great piece of study John. Enjoy reading it tremendously. I have studied John’s charts religiously, especially since going shorts in April 14. I have to say that I truly admire John’s diligence and persistence. and largely agree with John’s observations and predictions.
It is an extreme tall task to time the market top, as 99.99% of stock gurus got it wrong, I thought John was somewhat early when calling the market top in April, but I think his call for the top around Sep equinox is as closed as it’s ever been. I think end of September / October may point to the highest probability of the market crash, considering the current sentiment and geocosmics, I also believe that October is probably the last chance in 2014 for the market to crash. Just don’t see it is possible to crash anytime in November or December.
Agreed with WT is that it is a buy low time for the VIX vehicles when sentiment is flying high and most people believe that the US stock market cannot fail. The spike up this week and the last 30 days has been spectacular for the bulls. However, the imminent reversal will be as epic.
Thanks erick
SPX is taking out short term support levels. At least 50-50 chance top was made today, BEFORE the new moon. Rare if that is the case.
But it is what it is. Price work has the final say..
Another observation: The panic stage of the daily cycle decline in metals have begun, starting with Silver. I think gold and miners will follow next week. Precious metals start melting first. Next will be the entire stock markets.
You’re being set up. The countercyclicality of the PM complex and the major U.S. stock market indices is now clearly and unequivocally mathematically established. This time (a la 2001), when the stock market tanks the precious metals will go up, and powerfully so.
John, are you mostly short R2K? If so, congrats, breaking down today!
It’s my biggest short, but I am short all the main US indices.
John – Do you have an exit for R2K. Lot of people calling for 950 level.
I am also looking at either 10/2014 or 1/2015 peak dates, with the latter increasing in probability as time passes.
There is also a slim chance we might get a 11/2014 or 12/2014 peak date like in 12/1969….but no prizes for that as the market is basically a flat top for a long time.
Unrelated: I don’t have the data, but heard that 66% of stocks were in bear market by the time we topped in 1973. If we are at 50% now, we still have a little bit more to go.
Duncan, a minimum of 18% which is approx 1000. But with small caps history shows the correction ought to be bigger. So I plan to hold all shorts to 1000, and then phase out in chunks after that. But all subject to indicator developments etc.
the old vix topped out above 172 in october of ’87
anybody got an idea how high we might see next month?
I don’t think we will get above 1987. At most 50 I think.
My math shows the VIX hitting at least 100 when the stock market finally cracks in earnest. Timing is, of course, the difficult thing here. I can’t know whether it will happen next month or not, but the clock is definitely ticking.
A reliable and simple indicator of market exhaustion within a few days seems to be, when the DOW spents all the day above the upper 20,2 bollinger band, as it may become true today. Corrections or at least a couple of p.p. pullbacks followed in July and September 2007, May and July 2011, September 2012. But similar to 2007 a preceding further rise of 100 to 200 points is a realistic possibility.
Hello John,
thank you for your nice update today,
I’m a follower of Mahendra Sharma the famous astrologer.
His trackrecord is very good.
In his yearly cycle letter 2014 he writes that the period 19 September till 8 Oktober the market could be hit ( the financials en tech..shares).
Afterwards he is very bullish till september 2016.
We will experience a tulp bulbs rally that will take the SP500 till 3200 or 5000 points.
It’s hard to believe but I m from Holland and have heard a lot about the tulp bulbs rally so anything can happen..
Regards
John.
Thanks
Would it be too much to request that you allow us the option to block certain commenters. I’m quite sure its not too long before the idiots show up. Would be greatly appreciated. Thanks john!
Grand Puba, I block the very worst only. I’d rather people be free to comment. The respectful culture of the board (to now) seems to deter bad behaviour, so I hope that continues.
never undervalue human’s stupidity and greed, so what you say can happen
John (from Holland) – those dates strike a chord with me. Do you know if Mr Sharma uses the solar cycle in his astrology?
SP500 at 3200 by September 2016 sits well with my thinking on SC24. And I have two lunar cycles combining to form a low on 6 October.
Have you any thoughts on gold bottoming during 2015Q2..?
Yes, S&p 500 at 3200 seems a little pessimistic to me. My target is more around 4000 by mid 2016. Nasdaq could be at 10 000, but it could also be higher if we get a bubble. Gold should bottom around 320$ mid 2017.
Nicolas just thought I’d correct your comment as its a bit misleading. You’ve added an extra zero at the end of the s&p and Nasdaq figures and missed a zero off the gold figure. Anyway gold at $370 would bankrupt all gold miners so it is pretty much impossible. S&P at 4000 in 2 years would require 200% earnings growth assuming interest rates are closer to 3% by then which is extremely unlikely. It could be possible if companies buyback 50% of their shares but where they gonna get the money to do that from?
Hail YELLEN! Heil Hit…oops, I mean Hail Yellen!
When the media starts to treat the Federal Reserve like the Pope, you begin to realize that things have gone just a bit too far. It’s one thing for businesses to react to government policies that might affect them, as a shift in policies can often have either positive or negative effects on business. But it’s another thing altogether when businesses around the world hang on central banks’ every word because they have made themselves completely dependent on easy money. After six years of quantitative easing, one has to wonder if many businesses even remember how to serve consumers, or if they would rather continue mooching off the government.
THE SAME COULD BE SAID FOR INVESTORS AND SELF DEFINED “CITIZENS”
Hindenburg triggered on Bloomberg (different calculation, removes funds I think) yesterday, but looks like it will miss today.
From what I calculated, this stuff happened today, but not yesterday: http://en.wikipedia.org/wiki/Hindenburg_Omen
Yes, familiar with both versions. From your link,
Structural: New highs and lows are being affected by exchange-traded funds (ETFs). The last two times Hindenburg triggered was due to Bond ETFs making new highs or lows. If ETFs were removed, Hindenburg would not have triggered. When the Omen was originally designed there were no ETFs, so triggering behavior in the 2010s is not the same as in the 1990s to mid-2000s.
Either way the divergence is there. Market cycle end, per John Hampson’s research, is making me believe this is the kind that does in fact flag a major top.
The real question is if we need a cluster…and if so, it means more frustration until the cluster is done. So far we got one day, by either method.
I’m currently holding a large vix long position. Please Let me share some thoughts about the S&P 500 vix index:
1. Vix is nothing but the expensiveness of the S&P 500 short-term options. You may deem it as the expensiveness of the call options plus the put options.
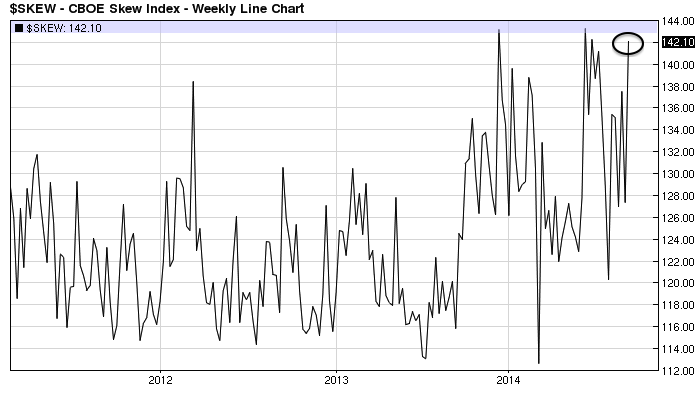
2. Vix currently stays at very low level, which means options As a Whole is particularly cheap compared with historical standards. However, the S&P 500 put options are currently 4 times as expensive as the call options ( $skew=140), which means the call options are extremely cheap as long as the prices of put options stay normal. The current phenomenon is rarely happened from historical perspective. The last time $skew at such high level was in 1998, when S&P 500 climbed to 1000 for the first time, when USD was in a super bull market, and when the other parts of the world were not OK (1997 Asia financial crisis, and 1998 Russia crisis). Looks familiar?
3. What’s the point? First, market participants are buying put options or portfolio insurance at whatever the price. This is definitely a bullish signal for S&P 500 in the mid-term. As we all know, big players have already bought large amount of put options. So they won’t sell real stocks anyway. If bulls don’t sell, any decline won’t last long. Second, call options are small investors’ favorite choice at any end of any bull markets. Now they are so cheap, which means most of the individual investors don’t think S&P 500 would be rising significantly from current level very soon. So they are not buying call options. On the contrary, they are probably long put options also. Third, this kind of awkward situation would not last forever. I think S&P 500 would either rise to 2200 or decline to 1800 in the next 3-6 months. I don’t know if you should sell at 2200, but I do think 1800 is a good buy.
Interesting comments. I have always thought of options as “smart money”. With that, I do take large SKEW as negative sign. Your example of 1998 is great counter example where large SKEW indicated sustained rally. At the same time, the persistence of elevated SKEW is closer to 2007.
Options are actually insurance. Those who issue options are doing normal business, like insurance companies or casino owners. Those who purchase options to hedge their positions are doing normal business too, like car insurance buyers.
1990’s should serve as a map of what not to do. It should not be considered normal market activity. Bulls seem to keep using 90’s as market value comparison when it obviously was not sustainable.
Mercury retrograde farthest eastern elongation begins next week and takes 45 days to reach western, very + for miners, last two pops in HUI happened during Feb and June Mercury Rx. Feb, 123, June, 123, October. See the pattern?
Watching NFL commisioner squirm while being grilled and it dawns on me, wealthy good ol’ boy clubs will say or do ANYTHING to protect there wealth. This is analogous to governments, business, wall street, whatever. This is why ponzi schemes reach such crazy levels. As long as there is still denial, it can continue.
snp 5000!!! when does QE10 start?
Love it!
http://www.raben.com/maps/
receding sunspots
Courtesy of the UK’s popular press:
“10 warning signs of global financial meltdown”
http://www.telegraph.co.uk/finance/markets/questor/11109440/10-warning-signs-of-global-financial-meltdown.html
Nice post John !
If you look at the NASDAQ, it is very close to its all time closing high of 5,048 made during the tech bubble – having come this close, don’t you think it will at least double top before we begin a big descent down ?
If so, then we are still about 9% away from the top, which tells me we make a stock market top on December 31 this year rather than in October !
Your thoughts.
Thanks. I can’t rule out you scenario but indicators put us at the end of the topping process, so I stick with Sept-Oct falls as my favoured scenario, and Friday’s action looks a promising reversal.
A bullish view:
http://www.seeitmarket.com/market-update-earnings-financials-driving-stocks-higher-13780/
Those who are long the major U.S. stock market indices, I strongly suggest you tread carefully. You’re being set up. The higher the stock market goes, the greater and sharper will be its eventual crash. The longer gold and silver aren’t allowed to stage a sustained rally (all markets are manipulated, of course), the sharper and more powerful will be their eventual upmove.
There’s a reason why a billionaire speculator like Doug Casey is heavily long gold, silver, and the quality g/s mining stocks and completely out of the U.S. stock market. Are YOU a billionaire? Didn’t think so.
Many thanks again for your work, John. Yours corroborates my own.
You’re right DJ about the billionaire thing.
The vast majority of those reading and commenting here, including me, fit the definition of retail investors.
Did Doug Casey make his money in the market? Or some other profession?
Thanks DJ
Bloodmoon 2014 2015, next is oct 5.blood moon is a Biblical event. Coincides with
Major events.
Btw, thank you for your great contributions.
I do follow a bunch of indicators, and i truly believe ou are on track.
keep up the good work.
If that’s to me, thanks
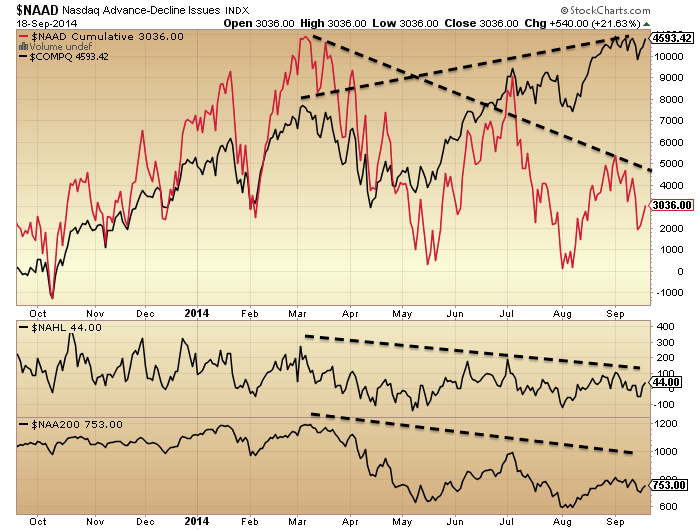
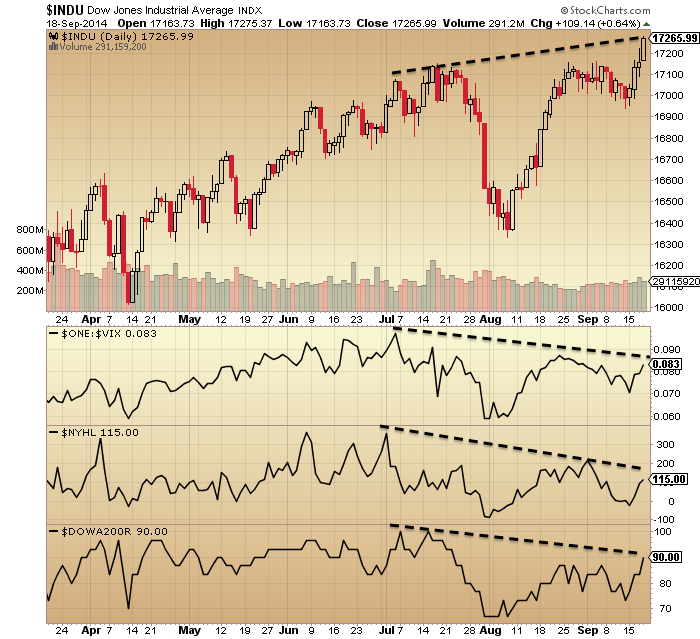
excellent article , lots of divergences are so clearly visible
Appreciated
Thank you John H. for the first two charts. I got all excited and promptly stole them for future reference. Good find!
Cheers
McHugh has issued a high alert today with a confirmed second Hindenburg Omen generated. One yesterday and one today, Friday, based on highs and lows on the NYSE. “It means that an official H.O. potential stock market crash signal is now on the clock for the following four months. This is a sign that the market is fragile, and susceptible to a large decline.” Also divergences all over the place.
He said that the Markets wanted to tank today, but that deep pockets came in and bought the market hard to prevent a sharp decline on Friday (don’t know how he knew that deep pockets came in). Maybe because of the Alibaba debut?
From everything that John has posted and what we have been seeing it looks more a matter of “how much” of a decline rather than “if” in the coming month(s). I think the Feds are going to rush when the decline gets nasty enough to make one more bubble – but we will see how far that will be able to go.
Do you have a link? Thanks!
This is from a subscriber newsletter.
Hi John Li:
Is this what you want?
http://www.safehaven.com/article/35194/high-alert-the-stock-market-is-in-a-dangerous-place-right-now
Thanks! I will post the. Bloomberg soon, but it only shows Thursday signal right now, no Friday confirm yet.
John, are you remaining long gold and bullish on miners? Honestly, gold is only at 1215 but miners got hammered last nite?
Gold is a paradox because Buffet will not own it as a value investor, even if he agrees the market is overvalued.
I do not understand why the volume for GDX and GDXJ is so high if it is universally agreed that they will only go down.
I am staying long. I expect precious metals to take off when equities fall. I see good chances equities fall now, which would mean what looks like a breakdown last week in PMs becomes a fake out. Supporting this is the skewed positioning in FX and PMs.
Others are seeing what John is:
http://charts.stocktwits.net/production/original_26988126.jpg?1411138474
Last remaining time analog left is the 1929 comparison.
http://en.m.wikipedia.org/wiki/Wall_Street_Crash_of_1929
Biotech follows the 1929 script pretty closely. Major falls for broad markets still one month away. Alibaba at 18x sales. Will add to the selling panic once the market starts rolling.
http://www.pbs.org/wgbh/americanexperience/features/timeline/crash/
http://www.marketwatch.com/investing/index/NBI/charts?symb=NBI&countrycode=US&time=19&startdate=1%2F4%2F1999&enddate=9%2F20%2F2014&freq=1&compidx=none&compind=none&comptemptext=Enter+Symbol%28s%29&comp=none&uf=7168&ma=1&maval=50&lf=1&lf2=4&lf3=0&type=2&size=2&style=1013
Pegasus, I know you were calling for a top in the USD/Yen awhile back based on Fibonacci levels (105-106). Are you now merely extending your top area to the next higher Fibo number? Or is something else going on?
http://blog.kimblechartingsolutions.com/#sthash.ebelXBE4.dpbs
Yen and Nikkei at long term trend lines. Good risk reward here for both in my view (long and short respectively). Am down 6pct on my long yen. Overlooked the falling wedge target which was around 109. Thick band of Fibonaccis overhead into 112. As long as one understands where you went wrong you should stick to your investment strategy despite early losses. Bubble investing does require a certain tolerance for pain. It was similar in 2006-2007 when shorting the US housing bubble and in 2010/2011 the gold bubble. I agree with John’s analysis that the risk reward is in favor of the short folks and one just has to be patient despite the meager performance results so far this year and the ridicule by the trend following folks.
The chart which summarizes the position best in my view.
According to my cyclework, the Dow should start it’s slide from september 30/october 3, 2014 on. The top could already have been made.
everyone is calling a top on this site with their own date, peter now claims 30 sep its hilarious, the best bit is someone will be right and we can all praise them.
🙂
Ha, ha, ha
hey ben, most have dates between sept.23 and oct.15…..a span of just 3 weeks!
why don’t u and ur clueless friends wait and see what happens in the next 3 weeks before making dumbass statements!
Gary that’s a great question! I was wanting to ask D.J. the same; in response to his very confident feedback on his proprietary math model. For all we know, D.J. may be a very intellegent 12-year old posting.
I heard Casey made a lot of $’s from pumping and dumping. I can’t recall him ever being bearish? I’d think Casey made most of his money from newsletter publishing.
D.J. my stuff is agreeing with yours but for some reason I don’t believe. And if anyone wants to know: yes, I am now a has been but once made a living trading.
I had about 10 good years: circa 1991-2001.
bruce almighty! the only reason they claim October dates is cos of seasonal weakness and the crashes of October, just too easy. a crash will come but itll come from nowhere
To all concerned, no name calling or rude comments allowed on this site – take that stuff elsewhere.
Thanks Gary
Yes, hilarious, is it not?
Just assume I spent a lot time (years in fact) to digest the best moments for me to go long or short. Two dates in the present time standing out for going short. The ones I mentioned earlier and november 4. I have been wrong this year more often than not. So even if I am right now, I don’t need to be praised. Most certainly not by someone like you, Ben Bewankey. It is the best contribution I could offer this site. If I’m wrong again, so be it. To me these dates represent likely turning points. Price action has to confirm, always. And I might add, halfway october and january next year, have some equal clusters like the one I ‘m going over here. It’s not a signed deal, it seldom is.
There are a lot of cycles, converging around the last days of september and during the first few days of october. The november date is based solely on a Dow-crash cycle with a long and different history, until now one time skipping a beat. All the other instances where on schedule and without delays.
As for september/october, using strictly the Dow Jones Industrials, you might want to consider this for example, besides the obvious 987 fib-months from the july 4, 1932 low, arriving october 8, 2014 and the 144 monts from the october 10, 2002 low, arriving two days later. Two instances in wich the market made a pretty good turn for the years to come.
From the first lows, september 28/29, 1960 it is 9864/65 calenderdays to october 2, 1987. Plus the same amount of calender days is october 4/5 2014.
9864 calender days divided by three is 3288; by four 4 is 2466; by five is 1972.
Let’s use all of them them and see what we’ve got.
Starting with the last one, count from october 2, 1987 2 x 1972 calender days= july 20, 1998, resulting in a loss of -21 %.
Since then no more hits; the next interval is september 30, 2014.
2 x 2466 calender days from october 2, 1987 is april 3, 2001. The 4th of april was a higher low after the sell off from the february 2001 top, -17,4%. From that moment on the Dow run up strongly 1 month and 18 calender days, + 21%.
3 x 2466 calender days was january 3, 2008. Not the top, not even the high and still good for a loss of -12,3 %, counted from this date.
2 x 3288 calender days’s from october 2, 1987= october 3, 2005, a high. Not a big one though, -4%.
Using a total of 19728 calendar days (2 x 9838 calendar days) -that would be the interval between low september 29, 1960 and october 4, 2014- divided by 2.618 is 7535,52. When counted in calender days from october 2, 1987= may 19, 2008, a mirror image of 1998, followed again by a steep sell off: -17.6%.
So, I thinks it’s fair to give this cycle some credit when it hits october.
Squared days also cluster the last week of september and the first week of october:
June 4, 2012 bottom + 841 calender days (29*29)= september 23, 2014
November 16, 2012 bottom + 676 calender days (26*26)= september 26, 2014
December 7, 2011 high + 1024 calender days (32*32)= september 26, 2014.
April 10, 2012 low + 900 calender days (30*30)= september 27, 2014.
october 4, 2011 bottom + 1089 calender days (33*33)= september 27, 2014.
May 13, 2010, high after the Flash Crash + 1600 calender days (40*40)= september 29, 2014.
March 16 2011 low + 1296 calender days (36*36)= october 2, 2014.
October 5, 2012 top + 729 calender days (27*27)= october 4, 2014.
October 9, 2013 bottom + 361 calender days (19*19)= october 5, 2014.
August 9, 2011 crashlow + 1156 calender days (34*34)= october 8, 2014.
Agust 9, 2010 high + 1521 calender days (39*39)= october 8, 2014.
June 24, 2013 bottom + 441 calender days (21*21)= october 8, 2014.
September 25, 2014 is 34 months from november 25, 2011 low and 55 months from the february 26, 2010 higher low.
Peter.
Peter,
Wow! Great work, research. Thanks
Peter, thanks mate appreciated by some.
Do not leave us!!, you are one of the best here. People who think outside the box are misunderstood by many, Stay here, i am counting on you…as many others are!!! nicola2910…
To be honest, I like the fibb months, and then the rest seems like random numbers. Do squares happen in nature? There is no logic there, while fibb does occur in nature and also the solar cycle.
Nice work Peter. Thanks for sharing.
This post is just for John, so the moral police can ignore this,
John, Chris Carolan says tops can be predicted with the spring equinox/new moon relation. In other words, if the new moon occurs between 1 day before and 10 day after the spring equinox, 2,5 years later (927 days) a top may occur.
Analyzing the spring equinox, we see that 2009 applied, as did 2012 and 2014.
2009 pointed to a top in 2011 (which indeed did occur).
2012 points to 2014
2014 points to 2016.
So, the whole issue of timing can be reduced to the question : do we believe this market can go up for another 2 years before we see a correction?
Think we both know the answer to that one. So if 2014 is the year to show a meaningfull decline, the end of september/early October is 926/927 days after the march 2012 new moon.
Thought this could be relevant for this blog.
Thanks Andre, interesting read.
Andre, you are one of the best contributors in this board, please keep it up and not be deterred by disbelievers
Vincent,
I don’t expect everybody to believe. But when I receive hostile responses I get second thoughts. I was falsly accused of changing my mind, when I hadn’t, That’s a personal attack. For me that’s the limit.
I hope you understand.
Cheers,
André
Andre is this the same Chris Carolan that also writes for Elliott Wave International or some other?
The reason I’m asking is because he is the only one on their team that is not a perma bear currently. At least on the indices…and hence I tend to pay more attention to what he says.
Purvez,
I don’t know if he works with EWI; he has his own site (spiral calender.com). This is what I read on his site : “I’m watching the potential for a top in US stocks. to form later this week.” He said this on the 16th. That’s the same I say.
And I didn’t say this is the end of the bull market; just a meaningfull correction/flashcrash. It will be a wave C down. Third waves can be wild and flashy. After October 10th I expect a rovery. My own cycle analysis points to the final top at the end of this year (based on the golden ratio of the 9,3 year cycle that gave the low in 2009).
Cheers,
André
typo; recovery
I’m fairly certain that is a different Chris Corolan.
Thanks Andre’,
Wouldn’t the following fit into your analysis/: 10+% correction from about now (next 3 weeks) until end of January-February, then another rally (weak and struggling) until the end of 2015/early 2016.
Related, I don’t know if you have done any work based on the Metonic Cycle, but it might fit into your research interests. ‘Decoding the Hidden Market Rhythm’ by Lars Von Thienen. Based on my perception of your knowledge base, you might find some of boring (as he writes it for those new to the field to build a base), but there may be a nugget or two that is of value to you.
Separately, Interesting proportion factoids:
The Market has just now completed a Price-Time Vector from the high in October 2007 to September 2014, that is equal to the Price-Time Vector from the high in September 2000 to the high in October 2007; &
And the Price-Time Vector for the decline from September 2000 to the low in October 2002, is equal to the Price-Time Vector for the decline from October 2007 to the low in March 2009; but
The Price-Time Vector for the advance from the low in March 2009 to the high in September 2014, is equal to 1.218 times the Price-Time Vector of the advance from the low in October 2002 to the high in October 2007, almost equal to the Fib # 1.236.
Finally, did you post your H-L thoughts for the next period? I apologize if you did, and I missed. Hope you don’t mind if I use as gold standard to judge my own work. Thanks
Steve,
Last weekend I had an extended analysis prepared with confirmation from 6 or 7 angles. First I had some problem with posting (my fault) but then I got some nasty responses and lost my appetite for posting. Unlike other tidal analysts I give away my forecast for free. The reward for me is the joy of discovery and sharing. When that joy gets taken away I loose my energy for doing this.
Anyway, there was a small post – that’s why you missed it – that predicted the low last weekend, the high this weekend and a low on oct 10th. Sofar I was right all the way, and that seems to irritate some. And I haven’t changed my mind, because there was no reason to.
With the spiral calendar I can now make a connection between the long term 9/56 year (http://www.davidmcminn.com/) cycle and my shorttime apo/peri and tidal cycles.
The spiral calendar – by adding spiral 18 and 19 – gives the 9.3 year solunar cycle. This is 50% of the 18.6 year cycle that some of you may recognize. And 6 9,3 year cycles give the 56 year cycle, roughly the 29th spiral (58 years). This is the cycle where both the sun and the moon have made a whole number of cycles.
This is the same that Kondratieff saw. Sometimes 54, sometimes 58 year, but I think this is all the same cycle. The beauty of it – to me – is that it is 100% sun/moon/earth based. So I don’t need astro for this.
Within the 9.3 year cycle I have the 4.5 year quasi cycle that I see in the apo/peri table, right down to the 7 day tidal swings.
Carolan says that the midpoint of cycles is based on the golden ratio. So when I take 0.618 time 9.3 I get 5.75 years. Add 5.75 to the march low of 2009 and you arrive at the end of 2014. My apo/peri cycles all point to early December. Coincidence?
From the beginning I have said my lunar cycles are up until December. So ATH’s in September were no surprise for me. I know this gravity stuff is new to all of us, so confidence needs time to build. But my confidence grows with the day (if I’m allowed to say this).
This would also mean that a possible bearmarket would end mid 2018. It would also mean that we have one more leg to go this year and my tides confirm this. I can’t see if that will bring new ATH’s or just a double top. My forecasts are about direction and timing, not price. McHugh expects 5-15% in October.
My short term forecast is more reliable than the multi year forecasts. I see a turn on the 26th, the 3rd, the 10th and the 18th. So I assume we are in an ABC down with sept 26 a low, a retrace into oct 3 and than a flash down into oct 10. Then up into oct 18.
The October 10 is confirmed (exactly) by counting back 1180 days from the first full moon after the winter solstice of 2017. According to Carolan that’s the way to find lows.
Breadley dates gave a high sept 17 and a low October 8; close enough.
I’ll have a look at the metonic cycle although I feel like I have all the cycles I need. I’d advice you to take a look at the link I included (David McMinn). Might be interesting.
Cheers,
André
Caralon was part of Prechters Elliott Wave outfit for a while. He had said danger was past in 1992 and was bullish after that. Prechter remained bearish which is probably why they split.
Thanks Andre, but does he say why the 2.5 year lag? I’d need to know the reasoning why a certain confluence would produce a result 2.5 years later.
John,
Carolan doesn’t explain these periods. He just says he has seen these patterns many times before and assumes the patterns will repeat. 2,5 years comes from his spiral calendar (16th spiral).
André
Just another way of multi-year geomagnetism and angular momentum via photoelectric effect wreaking havoc…
John, thank you for telling us about Mahendra. Looks like he’s laughing all the way to the bank at no risk. (:-) I know nothing about the man but I think the record on astrology/market gurus needs to be set straight? Evangeline Adams. I read the book “What Evangeline Adams Knew” by Karen Christino.
http://www.skyscript.co.uk/adams.html
As most know, she was purported to be an astrologer to J.P. Morgan. Well, in the first instance he was ALREADY rich when he visited her. But more to the point,
she is widely credited for picking the top in the 1929 market? BUT; if you read what she actually said at the time of a reading she said the market would go “to the stars”
or some such bullish prediction. It topped out the next day so that was not a good time to be long.
I hope I have stated the record accurately; but this is my take. Just some food for thought about Mahendra.
My Pleasure,
He is very famous has alot of clients all over the world.
Also called the botom in 2009.
In his yearly letter he stated that April 14 could be the low in the spring and the market would rally into the summer.
From June 27 till August 15 we should see the only bearcycle.
With a strong rebound an new highs till September 19.
This period tech stocks and financials can take a hit till Oktober 8.
After that (15 Okt) the market will rally till year and.
This bull market will run at least till september 2016 after that it will lose totall control and we will have a very nasty crash…
Will have to wait ans see what happens..
I M short but will watch Oktober 8 very carefully
thank you John – impressive!
Hello John, are these predictions from the book that he makes for the whole year(cost 99 usd)
Seasonal, new moon and 7 years from the top of 2000 to the top of 2007. It is due.By the way, for 7 years Demark sequencing MONTHLY very good. It called exactly top of 1999, top 2007, bottom 2009,top 2011 but wrong only once on 2013 Sep which is 11st for TD Monthly Countdown. So 2 more months to go ? But we don’t need to wait for 13rd because the high of 8th Countdown (June) already passed. Meanwhile, technically when ADX monthly crosses over both DI+ and DI- and then rolls over, time for taken profit if you long. If using Accumulative Swing Index by Welles Wilders, the market also at peak. Lastly, bond due to rebound. So let short 🙂
To be correct, this Sep 2014 is 11th.Sorry
Monthly TD Countdown is 11 for which index? ADX?
Thank you Andre. awesome post.
Andre’
WOW, way more than I expected! Appreciate. This is very helpful, and I am sure you will see the reward that comes to those that give selflessly. I understand your view on the negative vibrations/comments of others. Best not to absorb that. I hope you have also seen the positive words of appreciation. Educating is probably important to you, so let that flourish and ignore those that don’t understand. I’ve said before that what you are doing is extremely difficult, but it is (and has been) done by others (and the markets become like an ATM machine).
I have noted David McMinn and will review. Also I believe that the Metonic Cycle will compliment with your approach by potentially adding nuance. I’m currently constructing a model designed to align the New Moon/Spring Equinox on a 3 year cycle for the creation of a tunnel, so your comments above were of particular interest. We shall see.
Steve,
In nature cycles are never stable. So I think the metonic 19 year cycle is the same as the 18.6 year perigee cycle. And the 11/8 year distinction comes close to the golden ratio. Cowan found a 17 year cycle based on astro and had to adjust now and again. I think it’s all the same. David McMinn states that movement of sun, moon and earth have the best predictive value for the cycles. Coming from every possible angle, the main cycle structure seems to be around the 9/18/56 year. The spiral calendar, based on the square root of Fibonacci numbers times a lunar month, gives exactly the same cycles.
My main interest now is to connect these cycles with short term cycles so that we ultimately can connect the tides with 56 year cycle and possibly with Elliot wave patterns. And find the final explanation in sun-moon finance and gravity.
Andre’
(Looks like 2 Steve’s, scary!). My understanding is that the Metonic Cycle is where the Sun, Moon, Earth, come to the same location relative to the cosmos as background and is 6,940 days or 19 years + <1 day. It makes sense that Perigee would also be back to approximately same distance. Agree, from a practical standpoint, "it's all the same". Especially as it is brought down to a tradable period. The Lunar Node Cycle is 18.6 years, others as you mentioned. I see the broader direction you are going. Interesting and Exciting! Thanks for your insight.
SC
56, 19 yrs, 18.6, 17 yrs, Kondratieff, Saros, Schwabe ..I’m convinced it’s all part of the same dynamic Andre.
JH, KB, Puetz, Dewey, Wall, Gann and others have conducted some excellent work on this but there is further to go IMVHO.
I don’t have the brain power but good luck to those committed to unraveling the natural vibrations that dominate our world,
Seven years pattern: 1987 ouch, 1994 flat, 2001 ouch, 2008 ouch, 2015?
Yes, Lunar Node Cycle (AKA Declination Cycle?) has been discussed before and this is explained to some degree here:
http://time-price-research-astrofin.blogspot.com/2012/03/wd-ganns-financial-time-table-extended.html
I found the following number sequence interesting; beginning in 1792.
https://en.wikipedia.org/wiki/Panic_of_1792
1792 + 19 years + 18 years (averaging 18.6 years) as shown in the article; eventually calculates out to 2014.
Andre, would you be able to provide me some feedback on the application of your work with gravatation? Do you think it would work on commodities? Cheers.
John (group) here’s some further food for thought. For your consideration; I post the following link.
http://time-price-research-astrofin.blogspot.com/2014/02/long-term-charts-us-stocks-1789-to-date.html
Please take a closer look at the long term chart of stocks. You will note that the first large upwave ended in August, 1835*. The next, of course we know as September, 1929. We know those were huge peaks in the markets.
Now, wouldn’t it be interesting to find similarities between those two dates; and extrapolate those forward?
(As an aside back in the day; I compiled a chart trying to arrive at the day the market peaked in 1835 from prices viewed from microfilm of the old Daily Albany Argus at the university library. To my knowledge; It was the only recorded history record of stock prices at that time.)
http://chroniclingamerica.loc.gov/lccn/sn83045590/
Eclectic,
Of course Andre’ is in the best position to answer, but I thought I would throw in my thoughts. I believe the approach will work. I am not as far down the road as Andre, and I believe that my model is different than Andre’, but it is based on the same dynamics, just different process. I am working on nat gas, crude, Euro, and so far the results are encouraging. Emotion is emotion and it effects all. However, I believe that the sequencing from one market to the next changes, BUT everything is connected. I’ve been long and short in lots of different markets, and the emotions of fear (greed) are the same when things are going bad (good). That doesn’t mean you can take the dates for equity markets and just apply those pivot dates to another market since some markets have fast, short term cycles, while others are longer term cycles. But the cause of the emotions are the same.
SC
I agree.
André
If any of these cycles work. Most of you would be hedge fund manager and billionaire, especially the so-called veterans on this site.
If you are keep doing the same thing (good or bad), you will keep getting the same results.
Gianna, you are absolutely right of course. Don’t read any of the posts on cycles, you’ll start doing bad things and results.
To clarify : for me this is not a search for the right approach. I think the danger is getting married to one concept. So when we identify a metonic cycle and a perigee cycle, I don’t care how we call it. I am just delighted they both point to a 19-ish year cycle.
Carolan doesn’t use tides, MvMinn doesn’t use the spiral calendar, Merriman doesn’t use gravity, Elliot an Hurst never explained where cycles came from. Robert Taylor uses only tides, not the spiral calendar. John Bollinger uses only his own BB and DeMark decided to invent his own theory, Cowan uses only planets.
This site may be one of the few places where we – at least me – are not looking for the differences and argue what concept is best, but look for similarities from as many angles we can find. All the people I mentioned are/were very smart, so surely there is some value in what they say.
My challenge is to find the points where things come together. Reality is way to complex to model. Mercury’s gravitational pull probably affects the course of the moon. But I don’t want to go there. As long as we have confidence there is a 18/19 year cycle, once every 18/19 year we need to pay attention to shorter cycles to find synchronicity and confirmation.
So thanks to everbody that adds arguments and helps in connecting the dots.
Cheers.
Well put – Andre. Thanks for all your postings here.
There’s always some idiot that comes along and marks the top… I think we may just have got one Giaana! 😉
I wonder if there’s a conection between the start of this geomagnetic season, and the recent increase in tetchiness amongst the comments here?!
Price is truth and you judge by hard results,
very simple.
Everything else is pure conjecture, price is reality.
Mate, price is what it is but it certainly is not the truth nor is it reality. That is why markets crash.
The UKX sold off rapidly on Friday as the
early mark ups faded fast.
I am 100% in cash again, short term risks to
the downside imv.
Let’s see of the bears can generate some traction
or once again will one day reversals fail to gain
momentum and continue to be quickly bought back.
Some great posts here over the last week,
saved a couple of the best ones.
Allan, whether you agree with price is something
completely different, that is a subjective view on
valuation.
Price at any time is reality.
Dr. Steenbarger has had several posts recently on the topping process (which is what he sees currently): http://traderfeed.blogspot.com/2014/09/sector-correlations-in-stock-market-and.html
Anybody looking at the supermarket sector? Tesco has been hammered over past year. I recall buffett owns a large chunk of these.
TSCO from memory represented about 1% of the Berkshire float,
they recently reduced their position, so Buffett did not bet the farm
on this one.
I have been bearish on TSCO for over 3 years and took a huge amount
of flack on ADVFN and iii for posting cautiously on the stock, before it
became the consensus view.
Continued margin compression going forward is what I see for the sector,
as UK margins gradually re-set towards the European average.
All just IMV only.
Thanks Phil. That makes sense. Difficult for Tesco and Sainsburys as Aldi and Lidls has been taking a larger market share at the lower end and M&S and Waitrose dominate the top end.
I remember reading that they were expanding out into the US. Which at the time didnt make sense. Hopefully they focus more on the domestic market without opening yet another Tesco store on my local high street!
Thank you Steve and Andre. Yes, these ‘cycles’ are not static or fixed. I think it’s always been about non-periodic cycles when measured by the sun calendar. As far as price and time are concerned for me it’s abut trying to minimize what traders have to ACCEPT: risk, fear, doubt, and uncertainty. And that is why I no longer trade; apart from the fact I know I do not have an edge. (:-) I could go on about front running, hft, etc. but that’s another reason. Unfortunately, when trying to minimize those elements; the more difficult the task because most short term movements are probably random. At least Iv’e never been smart enough to pin point those turns where risk is the lowest and reward the highest. Yes, that perfect timing where your position shows a profit right from the very start; without having to manage paper losses. Now that’s Nirvana!
eclectic,
You mentioned recently about trading successfully through the 1990’s. and I wonder did you notice any significant change in stock market behaviour during that time?
My reason for asking is visible in this long-term Dow chart: http://www.macrotrends.net/1319/dow-jones-100-year-historical-chart
Early 1995 marked a fundamental change in volatility and ranges etc. It was also around that time when internet access allowed anyone and everyone to check stock price data and analyses instantly. Prior to that, retail-type investors had to make do with simple prices in the Financial Times the following day; and only professionals working for large institutions had the resources to do all the detailed research by hand.
So I think we have to adjust to the fact that all types of analysis (including solar, lunar, astrological, technical, fundamental – everything, no matter how unusual) is already priced-in as soon as we see it published on the net.
I personally don’t think that instincts of greed and fear could have changed significantly, but access to data etc certainly has. That’s why I’m wondering if you (or anyone else actively trading during the ’90’s noticed changes at the time.
I did smile when I recalled some shouting from the roof tops ECB will be pumping more QE, “it’s a done deal”
Then this comes out…like I said ECB talks but rarely acts.
And speaking of pouring cold water on easing plans, the ECB did just that, when several of its governing council members, but most notably Ignazio Visco, said that the ECB may not do further easing after all because it had managed to punk the market once again, and the EURUSD is low enough to where the whole point of QE is now moot. I
John is bang on here with respect to “the usual” correlations with gold, stocks as well forex finally coming back into play.
Gold is set to surprise everyone as Yen bottoms, USD tops out and equities fall.
The set up is just too well correlated across a number of asset classes, and I would be absolutely shocked to see Central Banking push through this one….this time.
Of course…..I’ve been shocked by this before so…..it sets up for an interesting week.
Good luck all.
Bloomberg confirms Hindenburg cluster. Not sure how to attach the graph.
Steven & Allen, thanks.
This is for John about Carolan (“Why the 2.5 year lag? I’d need to know the reasoning why a certain confluence would produce a result 2.5 years later”). I can’t speak for Carolan, but he may have borrowed this principle from George Lindsay who states in his Timing Model that the longest Basic Advance, the so called ‘Extended Advance’ duration varies between 929 and 968 calender days.
George Bayer uses this principle too. In short: het projects an extreme value in the reduction to orbit of Mercury exactly one year into the future for finding tops and bottoms.
From tradetrekker.com:
The weekly USD/JPY shows the currency cross is about to show a high as clusters of exhaustion points are beginning to record. However, there is no stopping Abenomics. The BoJ president Haruhiko Kuroda is a staunch supporter of the Quantitative Easing program in Japan. He believes the forced yen weakness is a plus for the economy. With that said, it’s difficult to believe the yen will reverse anytime soon.
Still, the weekly TD Sequential chart can record a TD Sell Countdown ’13’ this week to go along with the ‘9’ count TD Sell Setup last week. Given the BoJ’s wide accommodation of QE, the USD/JPY is likely to repeat the sideways action back in early 2014.
BOJ can only do so much, as the flood of Yen currently supporting US Stocks comes back as a Sunami.
I’ve traded through every other BOJ intervention, and the end result is always the same…..it’s only a matter of time as the “temporary fix” turns to horror, and the charts / graphs continue on their way.
The downward sloping trend in NIkkei over the past 25 years will not be reversed here considering that now with Fukushima and a host of other “new problems” Japan is in even “worse shape”.
When carry trade unwinds – look out – Yen bottoming as we speak.
XRT is below 88
ideally to confirm the downtrend now RTH needs to get below 62
Friday was a big internal failure day across all of these
let’s see how much BABA the IBs really placed in long term hands
should prices hold we have the start of wave 3 in European banks today
Last Friday the Dow spent all the day above the upper 20,2 BB.
Looking back until 2007 their appear to be 3 different groups of outcomes following such an event. The first was a further rise of 1 to 2 p.p. near term before a meaningfull correction or the start of a bear market (July and Sept. 2007) followed swiftly, the second was an immediate and short pull back of 2-4 p.p. before the continuation of the bull market (Nov. 2010 and Apr. 2013)), the third was a down and up within a small range for 2 to 6 weeks before a deeper correction started (July 2011, March and Sept. 2012).
Today’s action leaves room for number 2 and 3. Number 3 is strongly supported by a stat in Schaeffers monday morning outlook. According to those numbers extreme bullishness measured by the quartely average of II bears, typically lead to bearish results only 3 to 12 months later, while the indices held up over the following month.
Alternative 2 is along the lines of Armstrong’s forcast of a strenghtening bullmarket in the US because of world wide capital attraction.
Instead of wild speculations about various sorts of cycles or astrology one just has to sit down and wait which alternative the next 3-4 weeks will prove valid. In the meantime shorts should show at least some modest profits.
Better day(so far) for those short the RUT,
weak on Friday and follow through selling today.
A half smile folks?.
It’s definitely got potential – let’s see what happens at the orange parallel: http://scharts.co/1qn9NcT
this IS the END of FED fantasy football
elvis, some sort of correction here probably
suits the FED by exerting downward pressure on
US longer term rates.
If I subscribed to the omnipotent FED model
(I don’t) that would be my conclusion.
Just as longer term US rates have started to tick
up accompanied by some resulting weaker
US housing data.
there is so much more at play then interest rates and housing
housing is a RED HERRING
Dare I say it!? The VIX looks ready to “rock n roll”. Went long TViX(the widow maker) this morning at the open.
http://stockcharts.com/h-sc/ui?s=$VIX&p=W&b=5&g=0&id=p00410606125
good one Allan
i was asking for targets from anyone for the vix
i got a couple of responses but they seemed pretty low to me
i was thinking of something above 200 on vxo based on ’87s experience
If we close near the lows with further selling tomorrow
then it begins to get more interesting.
Not before then imv.
OK, I just short more GLD and GDXJ. Easy money.
so much more than interest rates and housing at play but…
http://stockcharts.com/h-sc/ui?s=$TYX&p=W&st=2010-02-25&en=2014-09-18&id=p25406656907&a=367751244&listNum=1
http://stockcharts.com/h-sc/ui?s=$TYX&p=W&st=2010-02-25&en=2014-09-22&id=p25406656907&a=367751244&r=1411408643263&cmd=print
for those without stockcharts
HEY does anyone have a decent chart service that you can plot ratios and annotate
I HATE STOCKCHARTS AND THEIR BUSINESS MODEL!!!!!!!!!!!!!!!!!!!!!!!!!!
http://stockcharts.com/h-sc/ui?s=$BPNYA&p=D&yr=0&mn=11&dy=0&id=p06544106151&a=367906801&r=1411409393500&cmd=print
major AD divergence at the end of a Volume OsC “T”
not good for the bulls
http://stockcharts.com/h-sc/ui?s=$NYUD&p=D&yr=0&mn=11&dy=0&id=p27960962328&a=367854604&r=1411410281062&cmd=print
How long do underwriters stabilize BABA after the IPO date? Or is it over? Seems like $90 is where they would be buying.
Silver is a superb macro indicator … As volatile as silver is, it tends to track the overall markets more than gold … When silver breaks key support … all heck may be breaking loose.
imho The markets need confirmation of selling pressure by the close today and tomorrow. If the selling continues on the rest of the week, I think John’s scenario is slowly but surely playing out.
xrt i shammered and RTH is following
retail not silver
I am out of shorts for now. Based on the pattern, spx should get a good bounce in the 1991 area ( it could drop to 1989ish + or – 1 point before bouncing should it choose to do so). If the top is in, we might expect the bounce to achieve the 2000 to 2004 area. Stops should be placed at 2006.75 spx or 2007 spx if giving it some room. Selling risk should be 2 to 5 points. New moon on Wed. and Fib. time alignment for Thurs., would suggest a retracement bounce would end on Wed./Thurs.
Before shorting again, I would want to see the bounce unfold as a 3 legger, a,b,c up, that ends just above 2000 area.( 2003 would be a 38.2% retracement of entire sell off. 2006.70 would be 50% retracement.)
Good point, but I would still short gold and the miners, because if the market goes down, they will totally crash and if the market goes up, they will still crash. So, it looks like a no risk trade.
Nicolas, research 1987 crash and gold
hah hah… how about research the broad market crash after 2000… what did Gold stocks do?
I’m staying short both gold and silver. I expect to see triple digits gold by January or February expressed in US Dollars. No stock market crash yet so more pressure anticipated for the metals.
John Li,
As for random chosen, true! On the other hand, should none of them appear during this timefrime, days close to one another, I would be hesitant to short (do you also think it is random that today we encounter weakness, exactly 2025 calender days after march 6, 2009, being 45 x 45, a well known number Gann talked a lot about?)
There is a lot more going on.
For instance, october 19, 2014= 2 x (PI) 3141 calender days from the top august 7, 1997, followed by a panic;
july 16, 1990, the top and october 18, 1999 the bottom =3381 calender days x 1.618 = 5470; july 16, 1990 + 5470 calender days= october 9, 2014;
december 4, 1987 low + Lucas 322 months = october 4, 2014;
april 19, 2013 low + Lucas 76 weeks= october 3, 2014.
And so forth.
I don’t want to make this post any longer. It does not matter. I’m only saying, I rarely jump in with cycles, but this cluster is huge and I thought it was worth mentioning. .
Peter.
http://stockcharts.com/h-sc/ui?s=$GOLD&p=M&yr=13&mn=10&dy=0&id=p43817265112&a=367902834&r=1411413931800&cmd=print
keep showing this but no one looks – much lower for gold if it does bounce significantly
sliver may even get to 13.50ish before the metals bear is over
Yes, good point I think silver will double bottom at around 4$. Gold should go to 700$, then a rebound to 710$ and a final bottom at around 150$.
GDX should be at 3$ at that point.
I agree with you Elvis. Metals might bounce this week, but then the sell-off may resume to take gold further down.
Personally I am accumulating physical gold. Agreed with Alan and others on this board that gold will shoot up after this wash up.
My research paints a similar picture. Gold to $950 but possibly $650. Silver to bottom in the $14-15 zone. These metals will be well and truly flushed out before any bull markets is embarked on.
WW, that’s easy because I had been buying gold stocks from around mid ’99 and was being told by my broker that I was an idiot. I didn’t get the exact bottom but 3 years later I didn’t really give a rats &@$!
I have been buying goldies again since earlier this year and I will continue to add and guess what?…………I am getting told I am an idiot……….go figure!
no body is call you an idiot – metals have not bottomed
though it is unlike gold will drop below 893 there is a small possibility that if it breaks the 800’s then 500 is on the table.
it could take until 2020 for them to get off the floor
absolute breadth just flipped green so buyers are coming in into the close – may give peter his bounce
the character of the flip indicates a bounce that is then sold so we will see –
You bet I’m looking, Banned by Elvis. I like your charts very much.
hui is breaking 204 level which was supposed to be the fllor in 2013 – 187 is next hard support for the miners
Well I am prepared to say that today was the turn for silver. USD Dollar and PM’s are about to throw people a curve ball.
http://stockcharts.com/h-sc/ui?s=$SILVER&p=D&b=5&g=0&id=p09831720309
Mark, I traded mutual funds so individual stocks were not my focus. I think it is true that it was definitely easier back in those days to learn information over the internet before it became too popular. Now you’re up against all the newer price information feedback.
I believe there is a bigger question in play here. Take a look at the time period I cited.
http://www.bespokeinvest.com/thinkbig/2012/3/22/sp-500-and-nasdaq-composite-long-term-price-charts.html
Now, believe me I would have fared a lot better just holding throughout this time period. No trading! just buy and hold. Besides, I define investment genius as a short memory in a rising market.
Cheers.
Thanks eclectic – I can see what you mean. “Sitting tight” would have been virtually impossible through that period; especially after seeing stock prices already almost double only halfway through.
Perhaps this is an example of how gravity can influence us in a very simplistic way? – it is much harder to envisage an asset price accelerating upwards after already doubling its value, than it is to imagine it crashing downwards after already halving!
Some nice reversal FX setups about with small daily range today.
Shorts:
GBPUSD: retest variation sell (RTVS) and inside period (IP)
USDJPY: RTVS & IP
USDCHF: RTVS & gap open real-body sell
GBPJPY: shooting star -> RTVS and IP
Long:
EURGBP: fake-out buy -> hammer -> IP
NZDUSD: retest variation buy (RTVB) and IP
Actually, will play GBPUSD IP either way, as obviously highly unlikely that it would trade down if all the other $ pairs reverse
Anyone else watching BBC 2 right now? Interesting program about… retail traders.
RUT hourly – http://scharts.co/1siJsUT
RUT hourly [cache] – http://screencast.com/t/9geuUSJYs
I can tell you right now that the sell off in gold, silver and PM stocks ranks as one of the most nonsensical sell-offs I have ever witnessed.
It was, even before this latest sell-off the only sector in the market that was not overvalued.
For those all over the net that keep quoting Martin Armstrong like he is some damn God-like figure, he has been wrong MANY times in the past and will continue to be wrong many times into the future.
I buy when evreyone else wants to sell and I sell when everyone else wants to buy. Do I always pick THE exact bottom and THE exact top? Of course not.
Lastly, long the USD has to be the most crowded trade in recent history.
Just to add one final word. i suspect that what we have just witnessed in the PM sector was a transfer of shares from stupid money to smart money in prearation of a collapse in the broader market and a major move higher in PM’s and their shares as per 2000/01.
Cheers.
All i hear is wind coming out.. like a baby blowing bubbles. I like baby blowing bubbles
Gianna, thank you, to date you have said very little and yet it reveals so much about you.
Bears are just bulls that are selling…..and vice versa:)
I think the point made regarding being married to one or very few concepts/theories/processes is spot on. Quoting someone who called a top or bottom at some stage or even a few times is absolute tosh. Ortherwise we might as well quote ourselves unless it has to be publicised so that people somehow believe that the person has some special skill.
Price action in terms of channels, triangles, flags etc etc coupled with fibs and support and resistance levels seem to be “right” for me around 60.9% of the time, although that is only according to records for the last 2.5 years or so. When I say “right” the price moved as expected in terms of reversal or continuation and so on.
I am not making any statements about profit of course. If I assumed that the 60.9% is the longer term average then in some periods I have made a lot of money and in others lost lots despite being more right than wrong. There are of course many reasons why this happens – greed, fear, forgetting stops and limits etc. It is entirely possible to lose lots of money even when you are 80% “right”…..
As I have said before, I am here because behaviour is something that I am interested in and I want to explore the different factors that could be impacting such. However, I would like again to remind people about the difference that I make between investing and trading. Whilst some of the points discussed here may feature in my thinking behind longer term investment decisions, they are not even close to being considered for trading activities. Such things as demographics, solar flares and “cycles” of 23982734 days divided by 53 and multiplied by the square root of 0.84 are not relevant for trading (short(er) term activities) in my view. Patterns and cycles put one’s faith in the past which I find disconcerting when I operate in the present and future. A system or process that can move and change with a dynamic situation feel right to me, and I have anecdotally at least made more money with that type of method than anything else (other than information I reportedly perhaps should not have had…).
p.s. I should add that 60.9% figure is when I have used it, I do not track every instrument in the world of course:D
Finally, one sane person with their head on their shoulder and not in their ass.
Brilliant —
Jegersmart and Gianna… While I sincerely respect your view, I think you are in the wrong board. We are here as we see so much value out of John’s work, and he is graciously sharing it for free. There are so many smart people on this board whom I have learned a great deal from
What some of the posters don’t understand is that from the beginning John’s investment approach was never a trader’s. He has always looked at markets through a longer-term multi-month lens, and it is only others that have introduced short-term views into the mix.
I will say I don’t understand Jegersmart comment that putting one’s faith in the past is disconcerting. There is nothing to learn from the past? Obviously, one must adapt history to current circumstances but as someone once said those who forget history are condemned to repeat it.
Jegersmart,
You gave me a big smile.Very sane words, indeed.
Let me put forward a question though.Take the recent price-action on the Nasdaq. This is based on short term trading, using trading days this time.
May 22, 2013 high + 57 TD= august 13, 2013, lower high + 55 TD= october 30, 2013 high + 56 TD= january 22, 2015 high + 58 TD= april 15, 2014 low + 55 TD= july 3, 2014 high + 54 TD= september 19, 2014 high.
All based on the past, all based on the same sequence, working just fine, using no fib-support & resistance levels, no trading channels, no patterns whatsoever. Moreover, it it takes only a few minutes to accomplish. So why not take advantage of this and all the other stuff that is generously presented on this blog?
Yes, I am not here to disagree or criticise John’s work of which I am a keen reader. I am merely trying to create some balance and word a few points of caution around my opinions of the current time on some of the things being discussed. My worst nightmare would be a discussion board where everyone agreed and created a self-enforcing consensus. I would view that as very dangerous as well as having limited value in my eyes.
So please take my comments in the spirit they are being offered. I take no side, I read, learn and question and of course offer something back of which I have a little experience. I cannot offer too much on a lot of the subjects being discussed at length which is why I am here, but I think debate and sharing ideas is valuable.
No offence intended, I hope none taken.
J
Super extreme fear says CNN. I guess we have to go up then.
http://buzz.money.cnn.com/2014/09/22/stocks-market-fear-back/?iid=HP_River
Hi Gary
Just to answer your question or point. If I read that someone is saying that “according to my work based on past patterns that we will have a high on the SPX around the 6th Octonber” then 2 thoughts strike me:
1. Is this an intellectual statement made in order to “test” the calculation or some other hypothetical situation?
2. Is this information that is being acted on with real cash (short term or long term – doesn’t matter)?
If it is the former, then it has no consequence if you are wrong. The latter is not as forgiving. So what I mean when I say I feel uncomfortable in looking to the past, what I mean is that when I am committing I do not do so for example on the basis that the last 3 major crashes came within 10 days of a celestial event (for example). Sure, if aware of this I would bear it in mind but would not act on it per se.
In making the point above, I just want to stress that I am not saying whether anyone is right or wrong but trying to remind people that discussing theories or hypotheses is very different to putting your financial health on the line based on a decision one makes. I cannot say whether any of the people here are following up their own calls with actual funds, and it doesn’t matter to me – the point was to remind individuals who read this that there may be quite a difference between the two. In a very general sense.
J
Understand – well put
Peter
I hope I am taking advantage of the rich information offered here but at the same time offering some words of caution or questioning if need be. Maybe my reply to Gary just above may help clarify my intentions here?
As to the series you have quoted, I guess one of the dates is wrong but my main feedback would be that I do not understand the point you are making. Hope you can clarify.
Thanks
J
Jegersmart makes some valid points. If making better than random decisions concerning financial markets is one’s objective, it’s important not to get into group-hug-think where patting each other on the back becomes more important than whether the ideas and hypotheses hold any water. Having said that the comments of some other readers lean more towards trolling than constructive criticism but to be honest their criticism isn’t entirely baseless.
The main reason I stick around is that John H provides a certain amount of rigor to his research. He prefers to attribute the phenomena observed to underlying principles/causes that make reasonable sense – whether one agrees with them or not. This adherence to at least a modicom of scientific method is not shared by some of the other contributors and so I personally don’t find their posts very interesting. That is not to say they have no value, it’s just that they’re often presented in a manner that doesn’t allow empirical verification.
Metonic cycle of 19 years seems to indicate bullish 2014, 2015, 2016. Vis a vis 1995, 1997, 1998…76, 77, 78…55, 56, 57…36, 37, 38. These were mostly terrific trios. Major market highs with Jupiter in Sagittarius next due in 2019, which is also year of Pig the best of the 12 Chinese Zodiac years, e.g. 2007, 1995, 1983, 1971, 1959. My gut tells me that the market will dilly dally for a few months as the January barometer was down this year, and zig and zag higher until 2019 where the dow will be double it’s current price. Housing is heating up in the Bay Area with prices accelerating and much more buyer interest. A bunch of unique economic accelerating technologies available for consumer products that are going to be released or implemented in the areas of energy conservation/production, transportation such as EV and drones, materials such as graphene, manufacturing with the geometric path of robotics implementation. I am a gold and silver miner loser, bought in April of 2013, and am trying to trade GDXJ using mostly Astro indicators(Merc Retrogrades up strongly (this week begins), Venus(planet which governs wealth and copper) Retrogrades up very strongly(next one in mid 2015), new moon to full moon cycles up most months, using RSI 14 for entry exits has worked well as up moves tend to be dramatic and last for a few months. Thanks for reading this and three cheers for esoteric market factors profitability!
The biggest challenge of any research into the potential cyclicality of financial markets is the attainment of statistical significance in the results. This not surprising as despite what one may believe the markets have a very low signal to noise ratio. Of course, “one man’s noise is another man’s signal” however, based on a battery of tests, markets can be shown to be very near random. Or to put it another way, if there is a signal it is likely to be very complex/high dimensional.
If the market was largely a function of gravity to the extent that one could accurately predict highs and lows on a daily timeframe, this effect would be easily detectable with any half decent signal processing algorithm. That doesn’t necessarily rule out gravity as a potential driver just that if it is, it will be a very weak driver.
There is no “scientific method” to forecast the future performances of financial markets. The are actually Complex Systems. Those who have made good fortunes from trading the market, they are artists, not scientists.
However, there are many scientific ways to explain the past performances of the markets.
Uh, James Simons would disagree.
The Ponzi Economy, brilliantly presented by Mr. Hussman
http://hussmanfunds.com/wmc/wmc140922.htm
This is looking a little more like it!! – at long last.
Personally, unless we get a close below 1904 on SPX I don’t think this will last long…everyone is expecting a pull back so there is very little fear….
I don’t understand why comments made on a blog divide people so. People always have to identify themselves as part of a group, in order to be against another group. Take some responsibility and go your own way.
I continue to read with interest John, my intention was not to cause any polarity – it was just to give some balance as I saw it.
J
Thanks all. New post is out.