

The US enjoyed united demographic uptrends from 1980 to 2000 and since then united downtrends. Here are a collection of charts that show the powerful reality of this influence.
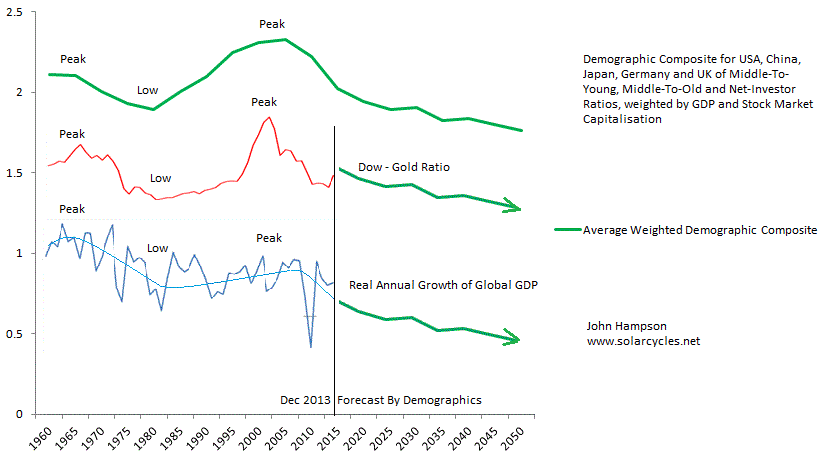
1. Risk assets markets in real terms trended accordingly, and are calling for another cyclical bear down within a secular bear underway since 2000:
2. Real economic growth trends also align:

3. A dwindling proportion of people in jobs:
 4. With associated lower household incomes:

5. Means that there is less dollar circulation in the economy 
6. And consumer sentiment is overall waning.
 7. Turning to the supply side of the equation, business capacity utilisation is in decline:
 8. And corporate investment too:

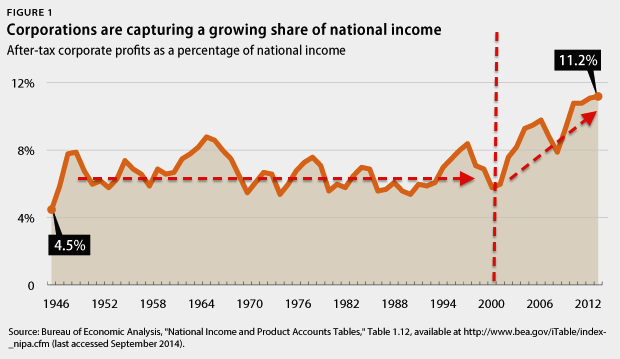
9. However, corporations have been doing better than households:
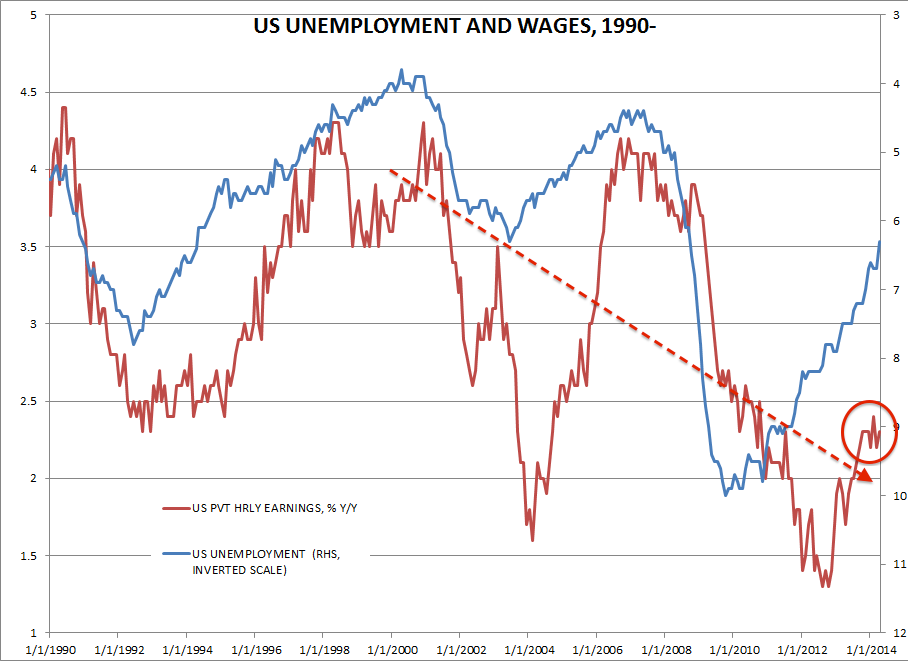
 10. As they have cut staff, replaced with tech, and kept wages low for retained staff:
 Source: ForexLive
11. With shrinking real demand in the economy and in asset markets, the Fed has attempted to offset this by depressing rates:
 Source: Gary North
12. And ‘printing money’:
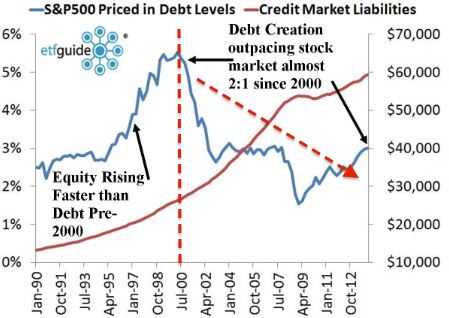
 13. The stock market has to a degree been a beneficiary as investors search for yield and corporations indulge in buybacks rather than business investment. However, this has all been sponsored by increasing debt, enabled by the low rate environment:
Drawing this together, demographic trends are creating a negative feedback looping between jobs, wages, incomes, spending, business investment and utilisation in the economy. Lower demand and lower supply. QE and ZIRP can’t really influence this because they are nothing ‘productive’ (tinkering with the money mechanism), and they are also only policies of encouragement rather than policies of force. However, they have served to shore up the banking sector, to keep debt costs low, and to push some people and businesses to look for yield, driving up some asset markets with an associated wealth effect. Equally though they have detrimental effects by postponing necessary economic cleansing, driving up asset prices through increasing debt (i.e. unsustainable), discouraging more productive use of money and in some ways worsening the economic situation by reducing incomes dependent on saving rates. Nonetheless, the Fed was keen to avoid the 1930s front-loaded deflationary devastation and has succeeded in this. But have they prevented it, or just postponed it? On a long term view, they have of course only postponed it, because the massive borrowing that they have undertaken is wealth taken from the future. But for us traders, the shorter term outlook is key.
I believe the above collection of charts demonstrate clearly that the Fed’s policies do not overcome the overarching demographics as they all show a series of stair-steps downward since 2000. If we contrast it with the 1930s we see evidence that the Fed has helped to phase the devastation, but the charts show they have not been able to neutralise it. When we consider the unprecedented collective demographic downtrends in place now in all the major nations, I believe it is clear we are on the cusp of another leg down, both in economic measures and asset markets, that will take us to a new level in all lower than 2008/9. We can cross reference this with the stock market currently at extremes in valuation, sentiment, leverage, buybacks and allocations: namely it has the attributes of a ponzi scheme wealth effect, at high risk of full reversal. When the stock market collapses, the next leg of demographic devastation will wash through, revealing the relative impotence of the central banks.

I like that first chart John – that’s an excellent idea to aggregate US equities with house prices. The difficulty I suppose, is in the timing of when it turns down (I agree that it definately will).
Since 2010, there has been a (temporary) turn up in charts 2, 3, 6, 7, 8 and 11. When these do turn back down the stock market collapse will be immense, but I still believe (based on things like SC24, lunar declination, very low stock ownership, Fib timescales in the gold market, wealth confiscation, war cycles…etc) that the collapse is more likely to be from around SP500=3330 between March 2015 and mid-2016 – probably later rather than sooner.
I accept that does seem irrational, but that’s always the way with markets.
Hi Mark
Its NOT irrational
The bears have now been short since January. Thats about 20% drawdown. Ouch!!
I have posted my simplistic approach twice before.
The money must go somewhere and while interest rates remain so low, it goes into stocks.Any reversals are just pull backs.
The market will take strain when Treasuries reach 3% and the CRASH comes at 3.5%. That wont happen this year.
regards
bobc
Also; SP500 has increased by around 200% since March 2009, but Margin Debt has increased by only 150% during that time – so simply based on that measurement there could be room for both to move higher.
The Qatio, while looking overextended, is looking very similar to 1995/1996 near the start of thedotcom bubble: https://solarcycles.files.wordpress.com/2014/09/11se121.gif
And we’re at a comparable stage of the lunar declination cycle to then (1995).
I see nothing imminently bearish in the DJT chart.
Burnell and erick may be looking for a big reversal today,
I find that more difficult to see, just my take.
Dow pre open today:
Plus: too high sentiment, too high allocations, RUT and JNK breakdowns. That’s what I see.
John, the reply when one asks anyone who plays the US stock market is: no systematic risk, can’t see how this can go down.
2009 “imminent” collapse we have QE = WIN
2013 to 2014 “we are tapering” = US economy is back on its feet – WIN
Conclusion: the market just can’t drop
i call BS
The Dow broke thru yesterday and the Nikkei is very close too its 52 week high as well. I thought at one point if they broke thru their highs you felt that they were detrimental to the bear case. Your thoughts?
John Q: can u please explain the ratio $ONE:VIX thank you………….so appreciate your site……….and your wisdom and patience……stay well
The one:vix is just vix inverted, so that it falls the same way as the breadth divergences
THANK YOU JOHN
Thete is some conflicting signals in the indicrs(as is quite often the case at major tops).
Trannise is confirming the move yesterday by making new all-time highs, however I agree with John that the small caps look to have peaked. They are IMO merely retracing and will likely make lower highs.
More stocks every week are failing to make new highs despite the indices doing so. This too will likely increase as we get closer to THE top.
How far is anyones guess but it has gotta be close. The taeget on the DOW breakout is 18k. Whether it gets there or breaks lower(head fake), only hindsight will tell us, but at present you have to respect the Transports confirmation.
As much as it peeves me off!
The dollar, well it is way way overdone. The longest rally in the dollar in two decades ends very soon. Nothing and I mean nothing climbs that steeply.
Small caps and junk broke downwards, biotech is still at double top, Nasdaq rounded top, SP500 and Dow trying to break out. So the picture is still unresolved overall. But with sentiment and allocations and negative divergences in breadth and vix I just don’t believe there is the fuel for an upward break here. And this is the window for most typical market falls: Sep-Oct. So I am still short.
It’s my opinion that some on the board here are making the mistake of being lulled in to a false sense of security in price, when the set up is for a crash. I try to be as scientific as possible in drawing together the indicators supporting this. Just because price has not collapsed yet, does not mean it will not. This is historic stretching of indicators and the abnormal action suggests very much that the correction will be catastrophic when it occurs. I believe it can happen any day, so I am reluctant to pair down or exit shorts. For the same reason, I believe it is extremely dangerous to be still playing the long side. Doesn’t mean you can’t make money long, but the risk-reward is what it is.
Thanksf or your work! If you are short, do you think that this is THE top or just A top?
Indicators say the top.
There are a growing number of significant de-ratings
on the UK market in smaller and mid cap stocks.
Ya gotta luv it. Dollar down, gold down. They don’t even try to hide the fact anymore.
YES Mr Armstrong ….the most manipulated market in history bar none.
The pair to watch for me, is USD JPY, it’s close to 109 now. Gold just keeps sliding…………… I am still holding onto my miners, lets hope it’s not a sinking ship.
Mate I am not overly concerned as I have seen it before many many times. There is no doubt in my mind that what is taking pkace here is a concerted effort to derail a gold surge. I think they fail because the greater trend will win.
Anyone that denies manipulation by the US look no further than comments fom the BIS, at least two former Fed heads, massive sell contracts dumped into the market all at once that overwhelms the long side without any regard for obtaining the highest possible price.
I could go on, but you get the picture.
yes, those bear raids in the gold market often happen during the middle of the night when the market is thinly traded. However, the move down from the July 10 high is unfolding as 5 waves down in a classic textbook pattern. So however/whenever the bear raids are occurring, whether it’s blatant manipulation or not, EW says it’s just doing what it’s supposed to do. Looks to me like gold is nearing the end of the 3rd of the 3rd, counted from the July 10 top.
Yes btw, I am a girl! So weird hearing you call me ‘mate’. Go to trader Dan’s market view, I don’t know why he’s so adamant that there is no manipulation when there is blatant dumping of paper gold always during European and US hours!
Sorry, no offence intended. I thought you spent time in Australia? Mate is pretty much a general term here, just as “guys” now is not really gender specific anymore.
NO worries mate, Im from Sydney! No offence was ever taken. I dunno about other ppl’s charts, but the move down in gold and silver lately just aren’t convincing on my charts and indicators.
Take last nights take down for instance, notice from where it began?
There are many that contend that the Globex market was initiated for one purpose only and that statistics prove that it accounts for far more than its fair share of large downside moves.
I don’t know but…..
http://www.kitco.com/charts/livegold.html
The monkey-hammering of gold is always the greatest with the Yellin’ grandma is loose. By the way, instead of all the drivel at the press conference about the politburo, er committee, considering the fraudulent data, how about just giving the football scores or something as important?
Every day the monkeys are up to their business I am salting away another little piece of BGEIX. Thanks monks!
People by and large are extremely instinctive. It is a big part of human nature. Certainly you will get some that are overly paranoid on just about everything that effects them, however in the case of gold, literally millions upon millions of people instinctively know that something is rotten in Denmark. Are they all paranoid or instinctively wrong?
Just as you get those that are paranoid in one extreme, so to you will get those that just point blank refuse to believe anything even closely related to conspiracy is possible.
Then again these same people could view the footage of JFK being shot 1000 times over and still believe that LHO was the lone shooter.
So true–remember some of the commentators that are in denial about manipulation have ties to the perpetrators as sponsors, advertisers, etc, so nuff said.
Binary on precious metals. Could rally with equities tanking or have another leg down as in the fall of 2008. Usd/yen back at Aug 2008 levels or a revisit of pre Lehman levels.
http://www.tradingeconomics.com/japan/currency
S&P is yielding 1.8% at the moment. What do people expect it will yield once interest rates at 3% in 2-3 years? I would think at least 3.6% which would imply a halving of the S&P if current dividends are maintained. Is this reasonable or am I missing something?
ANother question is, what happens to all the debt the US has racked up if interest rates are at 3%?
http://www.multpl.com/s-p-500-dividend-yield/
Are dividend yields relevant when companies are borrowing to buy back stock instead of paying dividends?
interest rates are at 3%?<<
Its OK–Mr. Fischer sez he can just mainline into the S&P, like the Bank of Israel does. See no worries about ending the past unconventional monetary policy because we can just start a new one–whew, worried for a second there!!
Hi John,
Nice updates we could be near a top again..
I follow astrology and this year we have had 3 moonwobbles Januari 23, April 18 ,July 16 and now Oktober 8..
Gann said that the period 2 week before and 1 week after the wobble things can get shaky in this world…
This year 3 wobbles have seen declines…
Also Mercurius will be retograde Oktober 4 till 28… when there are major corrections in the market mercurius is very often in play….
Have a nice day..
John from Holland…
Read about the Passover Tabernacles Tetrad 2014-2015 Shemitah cycle: 9/25/2014 – 9/13/2015 with a full solar eclipse due right in the middle of the cycle on March 2015. That’ll keep you up all night reading and sipping some whiskey.
RUT daily chart looks really bullish, bull flag about to break higher
New ATH on the SPX and DOW
I think sometimes its easiest to try and not understand whats going on, read nothing and just look at price action, and it just keeps going up.
Yes it seems like the best option. Just follow the short term trend and keep stops close by. This predicting the top game is probably best left for the fantasy trading portfolio.
I think you’re right. Sometimes I am my own worst enemy when I watch the markets during the day and try to catch the wiggles. Bigger picture works better for me.
Krish, US interest rates will not be anywhere near 3% in 2/3 years.
Deflation in Europe, China slowing, Japan..
1-1.5% maybe.
The reversal obviously doesn’t happen today as the markets are chugging higher and higher. I personally expected a significantly high this week thanks to the Fed protection, then a sharp reversal. It has yet played out, but I still firmly believe that the rounded top is forming and the reversal would be spectacular, just like what John has brilliantly and patiently explains. This hyper mania reminds me so much of year 2000 though, before the major sell-off.
New moon is on 09/23, so could the markets top some time next week?
Today marks exactly 7 days before the shmita year begins on Rosh Hashanah 5775, September 25, 2014. Number 7 represents a change in directions, more so within the shmita year. Couple days worth noticing: Oct 2nd, 7 days after shmita year started, and Oct 8th, a full moon.
I addition to October 8th (lunar), another day I am personally watching closely is October 23 (solar). This spectacular market rise can be followed by an as spectacular market fall in my opinion. If the markets keep rising next week, I will go all in 100% short during the next eclipse set, 10/08 specifically.
On another note, Kudos to those on the board who stay long and keep tight stop loss. I guess it is the only way to make some bucks in this market. This strategy might work well until early Oct.
Look at XLF…and the big banks. Bulls painted a picture that says all is well.
Devastation will come in the future and may even come tomorrow but who would sell today just because there are valid warning signs out there?
Barry Bannister’s SPX 2,300 (mild parabolic) is a real possibility.
Should we stay around current levels in the carry trade then could see evening star reversal on the daily. Bulkowski describes it as delicious reversal pattern completing a retracement when the primary trend is lower. Usd/yen would fit that Bill. The tail wagging the dog.
http://www.investing.com/currencies/usd-jpy-chart
http://www.thepatternsite.com/EveningStar.html
erick, today’s price action(so far) significantly
undermines the rounded top case.
We have clear new ATH across a range of US markets.
I would not discount a parabolic phase, which may
already be underway.
I have been tracking the analogy of the current trading action in USA stock market since the early Aug 2014 low is a fractal of what occurred after the early Feb 2014 low. Review my last three comments here:
https://solarcycles.net/2014/09/12/gold-update/#comment-28655
https://solarcycles.net/2014/08/25/the-alternatives/#comment-26483
https://solarcycles.net/2014/08/01/fire-is-lit/#comment-24734
So I will go on a limb here and speculate that likely Mon Sep 22 marks a top in SPX possibly at an incrementally higher 52-week high around 2015 and then it drops that entire week for an interim low near the end of the week by Sep25/26. It should only be a minor drop of around 30-35 points to 1980 support and there is likely a strong one day counter-trend rally in the middle of the week too.
It should then rally from that 1980 support from Sep26/29 to about Oct2/3 and likely establish an incrementally higher 52-week high around 2025, which marks the top before a more significant correction that should bring it down closer towards 1955 which breaks the 50d-MA too. There will also likely be some hysteria and panic when it occurs (during Oct crash season) but the reality is that is only a -3.5% decline. Anyone who shorts at that point expecting a market crash will get creamed because the fractal indicates it rallies aggressively possibly by +10% over the next three months into Jan 2015.
But what I left out is that the real action occurs in NDX. While SPX is still making higher 52-week highs in the near term and its pending correction is only minor, there is negative divergent action in the tech laden NDX. NDX should either fail to make new higher 52-week highs or at best just a marginal new high by only several points. The trading action should follow the same dates above except it will establish lower lows and lower rally highs relative to SPX. I modelled NDX hitting a top around 4110 and falling to 3930 by Sep26 or -4.3% which is significantly greater than the -1.7% of SPX. The Oct 9/10 low would be closer to 3840.
In conclusion SPX mid-Oct low will be much higher than its early Sep low making for a shallow decline. However, NDX mid-Oct low will be approximately similar to its early Sep low making for a much scarier correction that is 85% steeper than SPX. This is only logical since high flying tech stocks have also soared higher during the recent rally. Also note that the rally from the mid-Oct low will also have the opposite occur in that NDX will outperform SPX. So if SPX does rally +10% into Jan 2015 then expect at minimum +13% in NDX for the same time frame.
I will now shut up for another month and see how this all plays outs. My thesis will be completely wrong if NDX soars to much greater 52-week highs during the next two weeks and continues to outperform SPX.
Steve T. I largely agree with your analysis. Your speculation makes a lot of sense, and very much in line with the current sentiment, demographics, geocosmics and financial astrology. Saving your comments and I too will be watching with major interest. In my opinion, October is the last month of the year 2014 for the crash scenario to take place. Otherwise, the scenario might not become reality until autumn of next year 2015.
Phil. I agree. With the spike today, It is hard to rule out the scenario that the markets could go parabolic north, like in 2000. The Fed protection plus Alibaba IPO this week truly stretch the cycle to its max.
I think a there are a few bears left out there, as most have been capitulated. However, As spectacular as the rise has been, I believe that the reversal would be equally or even more spectacular.
John, I think your charts would look similarly bearish in 1945 WW2 economy even the demographic chart. The one difference is that after WW2, birth rate and immigration exploded. And in parallel, the US entered into an economic manufacturing boom.
This is just to say, I agree with your analysis but the future is a but unknown here. I don’t think a replay of immigration/birth rates will replay again. But what we shouldn’t discount is the possibility that the economy will achieve respectable but historically low growth rate sustaining the web of debt despite demographic headwind challenges.
A low in JPY will mark the corresponding high in U.S Equities and we are literally “days away” with Yen looking to bottom any second.
AUD has already been taken to the cleaners “ahead” of global appetite for risk, and I expect ( after a brief bounce here ) the trend in AUD to continue to take out the prior low around 86 in AUD/USD.
Currency markets lead, with the blatant inverse correlation of Yen and U.S Equities staring you in the face.
As Yen goes….(up) global “risk related activity” moves down.
We are days away in my view.
Agree. Overlooked the yen behavior in previous crash like situations when the dollar yen rose prior to the liquidity event dragging global stocks down – 2007 and aug 2008. Having seen the squeeze in the pair adds to John’s check list. Usd/yen continues to make lower highs and lower lows on multi year time frame with my expectation to break through 76 towards down-trend channel support at 69. First target would be 88 from currently 109 if previous corrections are any guide.
I have 88 – 91 area on my radar for sure.
Of course that’s “when” this thing finally rolls over.
Forex Kong,
Appreciate your posts. I believe that John’s long term solar analysis has long since been proved correct. I’ve been intrigued by the sequencing as those ‘solar’ effects work there way through the the global markets starting with the weakest links. Because of your focus on FX, you are particularly aware of capital flows on the sequencing of individual market adjustments. Why do you believe that fundamentally the Yen is key indicator compared to Euro, or some other metric. Is it the carry trade or some thing else.
Thanks in advance.
Haven’t confirmed it yet but apparently Hulbert Gold Stock Sentiment index just broke the summer 13 low of -56.7.
Investors have absolute disgust toward gold stocks at present. You almost couldn’t give them away.
Oooops my bad, scrub that. Read it incorrectly. At current trajectory it will likely break 2013 lows.
Still bad.
Hi Allan, as we know the West keeps suppressing the ‘fake’ paper price while the East keeps buying the real thing, it would seem sensible that the game changer will eventually come from the East:
China opens gold market to foreigners, seeks more pricing power
http://news.xinhuanet.com/english/china/2014-09/18/c_133653488.htm
Id like to see SPX close at HOD to get further upside tomorrow.
27 day forecast of space weather suggests 9/25 high and 9/30 low (or later)
http://www.swpc.noaa.gov/ftpdir/weekly/27DO.txt
NYSE 52 week highs and lows both climbing. Hindenburg Omen could trigger any day and as soon as tomorrow if conditions are ideal.
The quality of the debate/ posters on this site is first class
Thanks to everyone, and especially you John for the gift of your time and effort.
Cheers TDL
Duncan, I think you will have another raft
of new highs tomorrow, only some geo political
flair up can stop this.
The analysis outlined by Steve T is also what
I expect, some form of short shallow corrective action,
with a very strong end to the year.
The bull market continuing in to 2015.
Not ruling out new higher highs tomorrow. From a cycle perspective, the natural count would point to a sell off from here though.
With stocks 30 days into their daily cycle, tomorrow markets shall naturally start selling off regardless of the results of the Scotland vote, or the Alibaba IPO, unless the Fed plunge protection team has plans to abort any corrective move on this critical event.
I think the Fed protection team might stretch the daily cycle low until next week, or early October.
Where’s Andre?
@Phil White, dude, you gotta apologize to Andre and persuade him to come back.
Andre had stated his idea is in trial-and-error stage and he was kind enough to
share it. No offense but is there anything you can offer?
Keep in mind we are all here because we want different views.
It’s a Naw…
Martin Armstrong believes that after the coming correction, there will be a big melt-up of stocks into late 2015 with new highs based on this Economic Confidence Model. He says that because of the problems with Europe and other countries, everyone will be running here.
However, just now, Robert McHugh said that the markets today generated a new Hindenburg Omen. Looks like the Market may finally show its hand this coming month. I will copy his current Market comments for today for you folks:
“The stock market generated a Hindenburg Omen observation Thursday, September 18th. This is the first observation of two that will be needed for an official H.O. to be on the clock. NYSE New Highs came in at 112 with New Lows at 74, the lower of the two coming in at 2.28 percent, above the 2.20 percent required threshold. New Highs were not more than twice New Lows. The McClellan Oscillator was negative, and the 50 day moving average is higher than it was 10 weeks ago. All conditions were met. Once we get a second H.O. observation, we will have an official Hindenburg Omen potential stock market crash signal on the clock for four months. This is a sign that the market is fragile, and susceptible to a large decline. About 25 percent of the time, an H.O. precedes a stock market crash. Every time there has been a crash over the past 27 years, with the exception of the mini-crash of the summer of 2011, an H.O. was present.
“However, as if that is not enough, the important technical analysis news I want to discuss tonight is that there is now an important and rare Bearish divergence between the NYSE cumulative Advance/Decline Line and the stock market as represented by the Dow Industrials. The divergence is evident since the beginning of September 2014. This is one key sign we have been watching for to identify a possible top for the two decade Jaws of Death pattern which will end the Bull market that has lasted several centuries and mark the beginning of a major economic collapse and stock market plunge. The divergence is occurring very rapidly but as far as depth for the divergence, it is meaningful and comparable to the last time we saw this, which was just before the October 2007 stock market top, which signaled the beginning of the Great Recession.
“In tonight’s newsletter, I show charts of the current NYAD Bearish divergence and the one that occurred back in 2007. This is a very dangerous condition for the stock market at this time.
“Originally I was thinking we are going to see a 5 to 10 percent stock market correction over the next month. However, if we get the second H.O. observation over the next few weeks, and see the NYAD Bearish divergence grow, we could be seeing the next decline be far more serious than a 5 to 10 percent correction.”
It is my understanding to date that MA still has not confirmed a correction in the making or a Phase Transtion (melt up) in his public blog. Nor have I seen where the fall of 2015 will produce new highs in his comments. May I ask what your statements are based upon?
Greetings Alexa, I recall an interview he did with someone, but can’t remember exactly where it was now. Here is a recent article from him on Financial Sense:
http://www.financialsense.com/contributors/martin-armstrong/capital-herding-us-dollar
This site has certainly been a wealth of information recently! Thanks John, and all others.
Today the DOW was popped/propped via one company. Truly, truly pathetic. If they are reaching that far down in the weeds for a prop, it just further validates that we are in the final stretch of this run up.
Peggy touched on a good date. Maybe we will see “fireworks” on Sep. 25.
I like it when someone that makes a prediction, is willing to allow their previous claims to be back tested. This gains them good credentials even if they are wrong. The whole idea of the market is to catch as many players on the wrong side.
Considering what this fellow’s models are suggesting, we have just a couple of weeks to find out.
http://3.bp.blogspot.com/-aHvr6tqQdJo/VBW4o1_cmiI/AAAAAAAACXk/h36XE7GQdOg/s1600/vix20140912s.tiff
…and just in case… http://econocasts.blogspot.ie/
What he is implying with the upcoming moves in VIX, oil and gold, should be given some consideration.
What does the public not know?
mae, MA’s ECM as I have said in the past is a veryuseful indicator of turning points but it does not predict which markets turn or in what direction, so Mr Armstrong is only second guessing like all of us. Check his forecast on interest rates back in 2012.
He predicted that they would begin rising substantially in 2013…….hmmmmm.
That aside the ECM may have pegged this turm again as it predicted a turn on 3/4 Sept.
Cheers
Eddie, I do not have a system that
allows me to see in to the future and state events yet
to happen as facts.
That does not exist, it never has existed and it never will.
Phil, that’s a very fundamental point. Many, many people are not distinguishing the difference between predicting the future, and making money from the markets.
Every system fails right at the point when it generates maximum confidence.
The US stock markets (and consequently most participants) are obviously hugely bearish at the moment. How could anyone extract money from other markets players against their will, by following what is so obvious/ so popular/ so priced-in?
“The US stock markets (and consequently most participants) are obviously hugely bearish at the moment.”
Not according to the sentiment surveys and the investment professionals I’m talking to Mark.
WDG, GB, BA, Lorin,…
The ones that have the key to the science of foreknowledge never spoon feed.
For the record : my forecast was correct (check last Sunday) and my certainty WAS justified. You just can’t deny your way out of fact. Can’t believe how narrow minded and dogmatic some people are. Takes the fun out of blogging. All the best to most of you.
André
Looking forward to more Andre.
Me too. You are attempting something that is very difficult. So far so good. Good call on H-L this week. Something that I notice is the opposite of Inversions. Where the market tends to accelerate rather than pivot (per my model). Anyway, either way, congrats, and keep up the good work.
Disclosure: I’m 10% long gold and miners.
Gold is not a store of wealth. Blasphemer!!!
There is maybe, 80 Trillion in “wealth” sloshing around the planet. If gold was truly a store of wealth for the “multi-generational” wealthy, why is it the common man can go down to the local shop and buy gold coins? There is enough “old” money, and new money to suck up all physical, and mining companies too. The latest IPO will be larger than all of the miner’s market caps combined. Gold is insignificant relative to total liquidity.
Gold is a lump of metal.
Gold is an alternate currency.
Gold is a good investment during certain times.
Gold can be insurance.
The character of global markets players has changed. They bring their unique bias to the table. It does not matter what historical patterns have been in play previously. They will act on their best interest based on their own interpretation of value. The newly formed Asian physical markets, are going to cause an inadvertent “call” (on the bluff) of the western exchanges. This will cause considerable embarrassment when the true “nakedness” of various players is exposed. The central banks were not trying to manipulate the gold market so that the masses did not notice inflation. Gasoline and Big Mac prices do that. They needed to keep prices down because they inherited a legacy debt that could not be delivered on, and because it is all a confidence game. What is the reason Germany can not have its gold back? Would the world be more comfortable knowing that the trusted Fed is less than completely honest? The illusion of control. The good faith. These must be maintained. If you look at the amount of treasuries issued per year, compared to the total value of all gold, gold barely registers.
Having said that, China wants gold. China needs gold. China is extremely vulnerable to hyper-inflation. China can not survive significant inflation. China has issued more paper, credit, forex swaps, QE and domestic liquidity in their own currency than any other country. They are not buying enough foreign goods to mop it up. They need to continue to back their currency with US treasuries, and now gold to keep a floor under their currency.
As the climate gets colder, this is the periods that brought down South American civilizations. One hundred year droughts. Agricultural production will go off-line in SA, North American will decline.
Kansas wheat farmers do not take Yuan. They will take dollars, Treasuries or gold.
The rise in gold prices will be short lived. Harvest while you can and then move on. The depression will set the future price.
Earthabides, interesting read and you hit the nail on the head. “Confidence”.
Gold, as most believe is NOT a hedge against inflation and as such does not respond to inflation OR for that matter, DEFLATION in the way most assme it does.
Those that say that gold will decline during any future depression and that gold will offer no safe haven are completely wrong. Those that sight the lack of rise in gold during the Great Depression as evidence as such, are basing their case on incorrect perceptions.
Gold is then, a hedge against a lack of confidence in Governments, fiat currencies and uncertainty and it is why gold will go up in price during inlation or depression, because both of these lead to instability and thus confidence issues.
And that is why when we look to the depression to give us a indication of how gold will perform we need to see it in the context of a “lack of confidence and uncertainty.”
Of course during the depression the gold price was set at $20 per ounce until eventually being raised to $35, however Homestake Mining share prices, which were the best proxy for gold at the time, did in fact rise onsiderably.
From that we can reasonably expect that the gold price will rise during a drepession not decline.
Cheers
Let’s see where some of that 80 trillion goes when reality hits!
Bulls staying strong on Alibaba IPO day … watch out for the 40 thieves!
Thanks all. New post is out.