
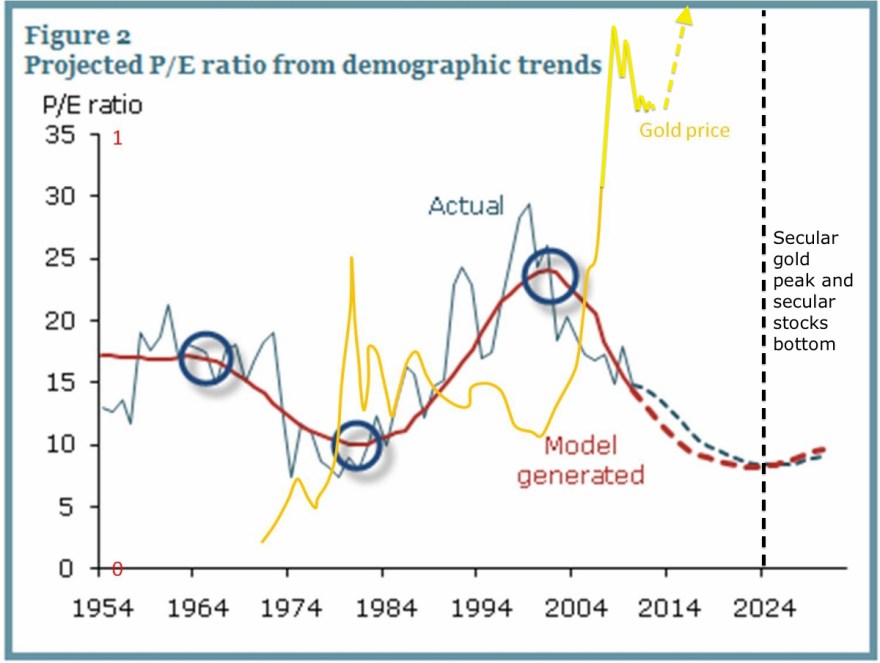
Gold behaves as the anti-demographic. This chart shows US demographics versus p/e ratio (equivalent to inflation-adjusted stocks) and gold price on a long term view. P/es or real stocks trend with demographics in secular fashion and gold the inverse.

Underlying Chart: Glenn Morton / My annotations
In the 1970s we saw a gold secular bull as demographics declined, then 1980-2000 the inverse. Demographics turned again around 2000 and put us in a secular stocks bear and secular gold bull from then through to circa 2025, which makes the gold correction since 2011 a pause in proceedings, similar to the Dec 1974 – Aug 1976 correction in the last secular gold bull:
 The late 20s stock market peak was equally a demographic peak and gave rise to a stocks bear / gold bull combination. Homestake Mining is used as a proxy here:
 Gold should make a speculative mania into solar cycle 25’s peak, circa 2025, with this target on the dow-gold ratio:
 A look at long term gold and silver sentiment shows a pattern has developed over the last year similar to the lift-off in 2000.
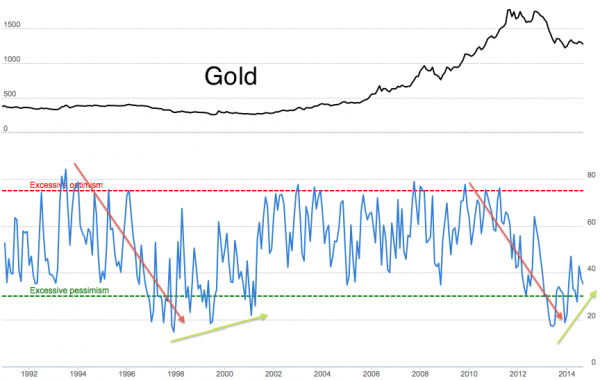
 Source: Jeremy Lutz
Cross-referencing with the current position in stocks, we see a range of topping indicators and extreme overvaluation in equities, which sets the scene for a new cyclical stocks bear (within an ongoing secular bear) to erupt imminently whilst gold resumes its secular bull. So I am looking for a floor in precious metals around here (I am long and looking to add).
Gold miners show a rounded bottom whilst gold sentiment has reached bottoming levels:
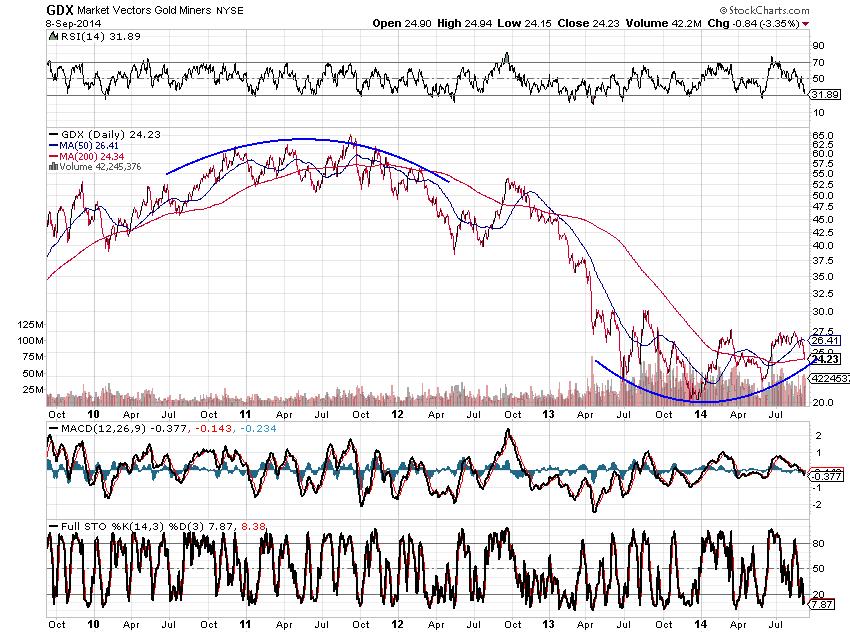
Source: Emma Masterson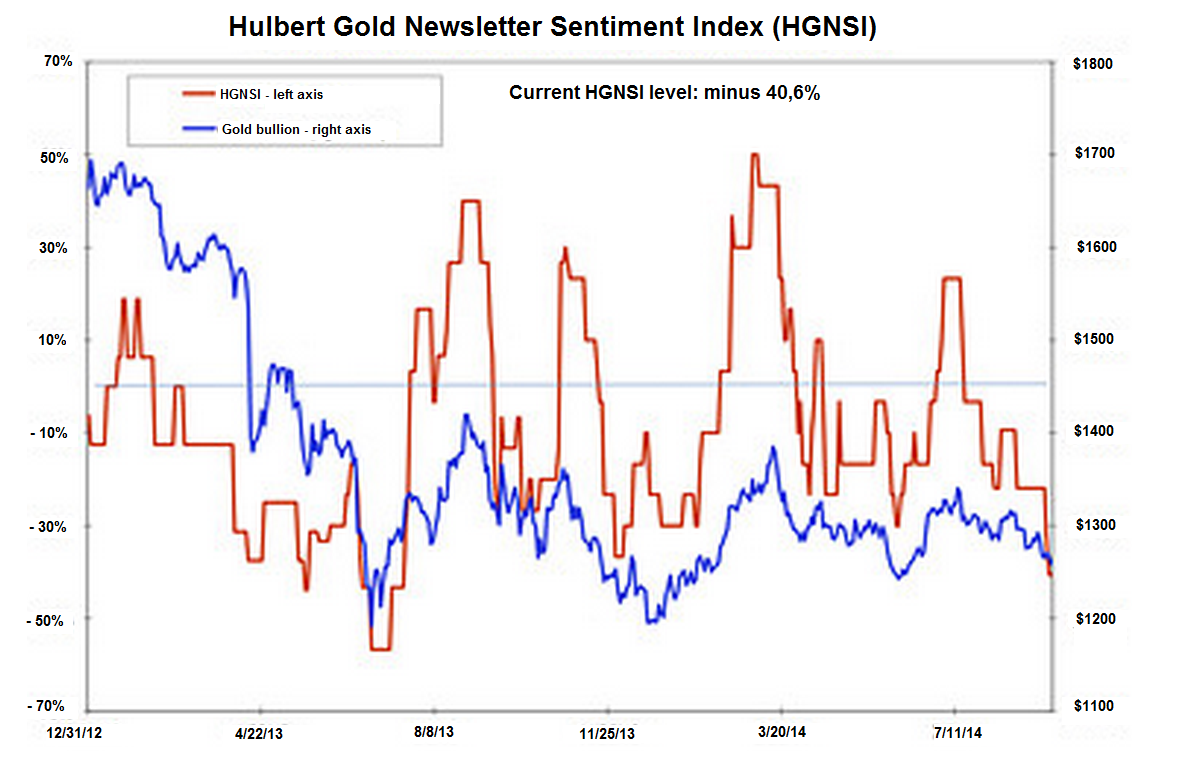
Source: Mark Hulbert
Gold has been falling the last several weeks in dollar terms as the USD has rallied strongly, but gold in yen, sterling and euros looks more healthy. The rising dollar is consistent with the deflation theme that is powered by demographics, and this theme should pull the rug sharply from under stocks in due course. When that occurs, gold should lift off, as in 1987:
 Source: P De Graaf

Fascinating article. One reads a great deal about how gold stocks need a perfect storm of rising equities as well as precious metals in order to do well. The Homestake chart certainly questions that. Thanks John for sharing this, and your overall market observations. A vivid read as ever!
Thanks Yogi
US futures down once again AM, perhaps more
of the same to come again today.
For easy reference:
http://www.mcoscillator.com/learning_center/weekly_chart/gold_-_watch_the_1000_level/
Here are July comments worth reviewing. Of course Armstrong target is still $1000 for next Jan/Feb. Still, could get a bounce soon…
http://www.mcoscillator.com/learning_center/weekly_chart/fishing_around_for_a_gold_cycle_bottom/
John, you know I am bullish gold from my posts and I have to say it again. What a well written, straight to the heart, succinct article.
I have a long history with gold, both sides of the trade.
I am not married to one side or the other. That said I just can’t understand the rampant fear toward a market that has corrected so aggresively for 3 years, whilst it’s longer term trend still remains intact.
I don’t know what investors expected gold to do, make a “V” bottom?
As I said the other day, even if gold goes $100-200 lower, I am more than happy to be in what I consider to be the least overvalued overleveraged overhyped amd yet most despised sector of the economy.
Mr Armstrong et’al can continue on telling me how much of an idiot I am. The fact is that the time to sell gold was in 2011, which I did BTW, …..HOWEVER the time to buy old is now!
Thanks Allan
John this provides a great picture of the Gold/Stocks correlation (or not). Thanks.
On your Dow/Gold Ratio chart it may be possible that the ratio needs to meet the middle dark green line first before the down draft really takes effect. That would fall in well with those expecting further lows in Gold and marginal highs in Stocks. It may even be that only one of the 2 moves significantly.
Appreciated
Canaries in the coal mine?
SIGNS RATTLE SUBPRIME LENDING INDUSTRY Subprime lenders have been churning out billions of dollars in loans, but some recent signs have appeared, including, a rise in defaults, that suggest lenders are pushing this spree to the limit, Peter Eavis writes in DealBook. The problems are occurring when the lenders extend credit to particularly risky borrowers or make loans that are harder to repay. The subprime market remains a lucrative slice of the lending sector, in part because creditors can earn more in interest on subprime loans than on conventional ones.
The market for subprime mortgages is still moribund, but a resurgence of subprime auto loans has taken place. Companies that make subprime loans to consumers to buy items like appliances, one of the riskiest types of lending, have also experienced something of a revival, Mr. Eavis writes. This has created the impression that lending to less creditworthy borrowers can actually be a sustainable business. For their part, investors have gobbled up nearly $80 billion of new bonds backed with subprime auto loans since the financial crisis.
Mr. Eavis writes: “History shows that a splurge on subprime lending nearly always leads to a crippling cascade of problems. While credit analysts do not yet see signs of an imminent marketwide disaster, they say that fissures are appearing in certain parts of the subprime sector.”
Per Gann”s Master Time Factor (60 year cycle) as well as the 30 year cycle, commodities should be bearish for 20 years. The 1980 parallel had gold top in Jan 1980 at $850. It dropped to $325 over the next 30 months and then had a very nice bear rally for 7 months – a total of 37 months from the top. A 12 month decline ensued even though the rally had turned the 200 MA up. We are 36 months from the 2011 top, and gold has shown no strength, not even a bear mkt rally. In 2011, I ran across an article that said gold’s value relative to long term real estate prices and adjusted for inflation over the long term was @ $500 to $600. I can’t find that source, but that would put gold easily below $1000 on a long term valuation basis. Plus I keep thinking of the massive CAPEX investments from 2000 to 2010 that will force miners to produce even at low prices to try to meet debt service obligations.
Kent,
“In 2011, I ran across an article that said gold’s value relative to long term real estate prices and adjusted for inflation over the long term was @ $500 to $600”
Mate can you define “real estate”. It’s a big world you know.
And
” Plus I keep thinking of the massive CAPEX investments from 2000 to 2010 that will force miners to produce even at low prices to try to meet debt service obligations”
You do realise that many miners are already against the wall don’t you? You think they will stay in business and be allowed to run up massive loses and not pay employees just to pay the bankers?
It was US real estate. but little beyone that. The article was by James Debevac of Minyanville and http://www.absoluevalueresearch.com That data plus the spectacular bullishness and euphoria helped me see the top in gold.
With all the market-rigging news (LIBOR, bonds, stocks, etc.) coming out one by one, more and more people started to see that precious metal prices have been deliberately suppressed by certain powerful ‘entities’.
This author gathered COT data to show that the “cartel banks” had feverishly capped the gold prices during every rally since last year:
http://www.tfmetalsreport.com/blog/6113/watching-flows
On a chart pattern see declining triangles on gold, silver and copper. If the base should break this pattern has targets of 1000, 11 and 2.20 respectively. Given good short opportunities in the equity markets am staying neutral the precious metals. Could go either way.
Saw a good Nikkei chart on http://www.marketanthropology.com which shows the Nikkei doing a retest of its 2 decade long down-trend channel. A good example for the 2nd chance type short entry point John has alerted us to. The Nikkei / yen/usd is perhaps the more granular pattern of where the global cb reflation trade currently stands.
John, thanks for the geomagnetism charts. Do we need a storm to match 2011, like how 2000 matched 1998, to trigger the crash? Any projections as to when this might happen? I see the Kp figure reaching 7 soon, but don’t know how to convert to your scale.
Geomagnetic seasonal intensity is typically highest in October. Hence the scene of many crashes / falls.
Thanks — I am still learning about the physics of the sun.
According to this, Ap might hit 18 on September 25th. Seems like a good time for a waterfall, post-FOMC and post-expiration. However, your graph suggests we need >40 or even >100 to be significant — are the units different?
http://www.swpc.noaa.gov/ftpdir/weekly/27DO.txt
That forecast always plays safe. They never predict anything like 40 or 100.
Interesting…thanks!
Love the Homestake chart and I am averaging into the miners every day here. But I must point out that Homestake was kinda like the only game in town in the 30’s with physical gold ownership illegal. Also FDR moved the price of Homestake’s product up nicely while Homestake benefited from lower production costs resulting from the depression. It was like a government guaranteed monopoly producer.
For sure the government has no interest in supporting the gold price this time around as it only “confuses” people in the “full faith and credit” department :).
Phil, your “buy the dip” theory is correct, but as I said yesterday, there has been a sea change. The buy the dips crowd are now getting introduced to the “sell on strength” crowd.
Kent, the link doesn’t work and besides that, I find it very difficult to accept that Gold relative to US house prices is a gauge I would give anymore than a cursory glance.
As far as spectacular bullisness and euphoria goes, if that be your guide to sell then surely you have to respect the other side of the equation.
Bearishness and pessimism is at “all-time” lows. Or do we ignore that?
The majority is right during trends and wrong on both ends. IE, all during a bull mkt bullishness will be rewarded. Bearishness is rewarded during bear mkts. But when the trend changes, the sentiment will be bullish, but now wrong. The trick is to figure out when the rules change. I think we are in a 20 year bear market for commodities, so for the most part ignore buy signals and sell sell signals. However, there are periodic bear mkt rallies worth trading, and definitely not being short. If it were easy, we’d all be rich. So now could be the end of the bear mkt for gold, and only time will tell for sure.
Sorry, it was http://www.absolutevalueresearch.com he had a few articles on seekingalpha under the name JamesStock
…….and so it goes….
The diamond pattern on the Q’s. It has to break and it will set the trend. Which way?
http://stockcharts.com/h-sc/ui?s=QQQ&p=D&b=5&g=0&id=p49470995665
For you cycle guys, what happened to the 17.5 year cycle?,
many followers of this were looking for a severe correction/new
bear market at the end of 2013.
the last 3 years of that cycle are typically the down ones (2014 – 2017)
Correct Peggy. I was looking for a bear from 2011 to 2013, then another low in 2015 and then 2017, all the while seeing volatility on both the upside and downside (as I desribe in my book).
I thought we’d see a drop in 2013, when this didn’t happen I went long until last week. Now I am 55% long equities, 45% cash. I am looking for a drop from now to either Mar 2015 or Sept 2015.
I still maintain we won’t start a new 17.6 year secular bull market until 2017/8.
http://www.amazon.co.uk/17-6-Year-Stock-Market-Cycle/dp/0857192736/ref=la_B00EJE56BQ_1_1/280-5146439-7799864?s=books&ie=UTF8&qid=1410533658&sr=1-1
I think most cycles have either inverted or not worked out under QE
look at the charts I posted – the indicators show the top of the cycle and price struggles…pretty simple
that’s why the breakpoints 1984 and 1999 are simple
that’s why you don’t go long at the top – if you are long you might stay long but you need your stop (1984) in place.
IMO, solar cycles and demographics dictate long term trends. Fixed cycles don’t work. Solar cycles average 11 years, but the actuals not the average is what matters. This has been a particularly long cycle from the max in 2000 to the max in 2014. 40 equities topping signals have aligned in 2014 along with the solar max.
You had mentioned that demographics peaked 1929 and this is most like 1937. Do you have the data for this please? I see only 1950+ from your Demographics page.
See email on solar cycle intensity over centuries and looming decrease will change frequency and intensity of highs and lows for awhile. Comparison to data in last two centuries may be major mistake. It assumes frequency much like looking at a signal reader showing a wave pattern for a radio signal. We need to discuss this more and think it may influence you.
That SPX1987 level provided support again. Will be looking for a close ideally around the SPX2007 level.
What IS different this time is the extensive use of options to hedge.
AAPL is pegged at 100, SPY is pegged at 200 and QQQ is pegged at 100.
At some point it will break, but for now, option sellers are loving it.
kiss 1984 for spx 98.72 for QQQ’s
http://stockcharts.com/h-sc/ui?s=QQQ&p=D&st=2014-05-21&en=today&id=t68971681117&a=367370458&r=1410532730378&cmd=print
http://stockcharts.com/h-sc/ui?s=$SPX&p=D&st=2014-05-21&en=today&id=p22457060024&a=366970903&r=1410531888654&cmd=print
dare I say that today we break those numbers and head down
1984 for spx 98.72 for QQQ’s
no pastoral bliss for the bulls unless the 13ema turns up and 1999 is taken out – until then nothing changes. TOP OF THE CYCLE….hmmm
wonder what that means?
There is a perfect buy signal on the daily GDX for DeMark; I bought $24 strike calls today. Thanks for the article, John.
Sorry to spam, but gold futures are showing a DeMark perfect buy signal on both daily and weekly time-frames.
gold will probably go to 800 and silver 15
may get a bounce here as USD pulls back and consolidates but deflation is here
http://stockcharts.com/h-sc/ui?s=$GOLD&p=M&st=1982-01-25&en=(today)&id=p73956220491&a=320443202&r=1410536265043&cmd=print
Allan, Rick L note is a perfect example of my thesis. DeMark who is great in my opinion has given a large number of sell signals over the last couple of years, mostly wrong. Bullishness has been high and mutual fund cash levels at record lows for what seems like an eternity, but the market just kept right on going up. Gold is at support and has a Demark buy signal, whether it is a bull or a bear mkt should be known fairly soon.
Rick, are these Sequential or Combo buy signals?
Yeah combine with seasonal, good time for going up unless 1185$ breaching
However TD set up this time too deep so TD Combo might take charge. 4 more days to go or 4 more weeks
According to Demark’s Trend Factor: 1240$ taken so 1205$ is free to test
I agree with John that the U.S stock market may have very limited room to rise in the near term, say, next 3 months. But I don’t think building up short position on U.S stocks is a good idea. If you have every reason to go short instead of sitting on cash, I suggest be short on emerging market equities or commodities, and long U.S stocks as a hedge. German or British stocks are good also.
It’s useless to argue. The market doesn’t care if you are reasonable or not.
so when the simple systems are validated here who among you will give up the verbose narratives and then trade the systems???
didnt someone yesterday have a convincing narrative as to why IWM was going to confirm an uptrend…? it was an ABC correction count I believe…
really close to a net line sell confirm on IWM
I did not realise that someone who posted here wrote
a book on the 17.5 year cycle!.
Mentioned it because there were numerous articles about
this time last year forecasting imminent severe falls based on this –
which clearly did not work out.
Allan, it can change very quickly,
I try to stay flexible and open minded in approach.
It’s why I read Solar Cycles.
Finished the week just over 30% invested,
the rest in cash, I do not use margin or spread bet.
KISS – not gold bull anytime soon
http://stockcharts.com/h-sc/ui?s=$GOLD&p=M&yr=19&mn=0&dy=0&id=p68130033981&a=356809968&r=1410540968727&cmd=print
nice charts elvis….
elvis do u see gold and the S&P going down at the same time, in this correction?
gold will follow and form a bottom before the spx but I think 800 on gold is not out of the question – the long time frames have clearly broken down without a net
here we goooooooooooooooo!
TLT may be a big buy here but HIGHLY speculative until some proof emerges.
I am leveraged long on it so I’m making money with one hand and setting it ablaze in the other. lol
everyone who bought XRT the last couple of days needs to get spooked
You are long both XRT and TLT?
no – xrt is an indicator of bull sentiment – so right now xrt above 88 is in the bulls favor –
what I am saying is everyone who bought xrt needs to get spooked out of it so that it confirms this move down
IC….how interesting XRT…I would have thought IWM or QQQ would be what people look for.
Elvis how did u get 88 for XRT
technically it’s 87.80 lol
Storm is here.
http://solarham.net/planetk.htm
My weekly SPY puts almost doubled in value so I took profits.
My migraine is getting worse. Note, these puts expire today anyway, so I am forced to sell and roll over.
A “Storm Level” geomagnetic surge K=5.33 (G1) is about to reach us around 7.20PM BST – about an hour and 40 minutes before the US close. Not massive, but could cause a reaction…
thanks Mark
Thanks, Banned by Elvis–what’s your target for SPX if it breaks decisively below 1984?
If you are long term bearish, this could be it.
http://redlinescenario.blogspot.com/2014/09/is-this-top.html
We need to see a US index break down to confirm anything and switch long term, but this is fairly compelling here, imho.
-SoulJester
Elvis, I would be extremely surprised if gold drops too much further. USD longs are everywhere and the dollar has had it’s longest winning streak in 2 decades.
Wait and see what happens when the market realises that:
1 The US is shooting itself in the foot with Russian sanctions
2 US stocks begin to collapse and foreign holders, the biggest buyers in recent months, start to off-load emasse and a falling USD compounds their losses
3 Investors realise that US bonds are just as big a bubble as the US stock market
Wow that is some TRIFECTA Alan!! BTW I agree with what you are saying.
purvez, also compare gold miners GDX to GLD over the intermediate term and notice that whilst miners are down, they are making higher lows compared to previous GLD lows ie diverging lows.
This factor is not insignificant IMO
then explain the significant break of the long term monthly trend…?
sure it could recover but we are talking about monthly charts – that means it will take a while for evidence of an actual bottom to present
there will be a pull back in the USD but it wont go below 81.25 and gold will have a small and furiously unmanageable bounce that will get everyone excited but will trap them once again.
http://stockcharts.com/h-sc/ui?s=$USD&p=D&yr=2&mn=1&dy=0&id=p71182438044&a=367495890&r=1410626657269&cmd=print
SLV might actually break 15 and as this MF projections indicates metals wont bottom until summer 2015
http://stockcharts.com/h-sc/ui?s=SLV&p=W&yr=4&mn=10&dy=0&id=t60660732212&a=304345386&r=1410626768101&cmd=print
VIX is above 200SMA. Soon CNN.com will tell us that we are in EXTREME FEAR.
just heard on cnbc t/a guy seeing 2100 at eoy 2014 and 2350 eoy 2015 unreal
Why unreal? Trend is your friend until no more.
Exactly – don’t fight the trend. Why do you invest in anything – to make a positive return.
Good to see you posting here Elvis (still a bear I see 🙂 )
Friday was the low. Next week will be up. Some indices to higher highs, some pull back. 18/19 roll over. Then strong decline into oct 9/10.
Cheers,
André
Andre is this forecast based on your gravity work?
Duncan,
Yes it is. Last week I told you I had found a new tidal station. This week I was able to test it and it is perfect. I can see that gravity was turning from Wednesday till Saturday morning. So Wallstreet made a bottom Friday afternoon.
I have confirmation on these dates from several different sources, that I’ll tell about some more tomorrow.
But next week up is a fact.
Cheers,
André
I wasn’t going to say anything because even the mere mention of PM manipulation is greeted with many responses from absurd to dilusional but I just read this and I have to say I agree with everything Adam Hamilton says.
Somethng has to eventually give in the PM’s market. I keep hearing that gold will fall to below $1k and that at current levels it is overvalued.
I have many connections within the miing industry in Australia and I am telling all those that think that Gold is overvalued that it is utter nonsense.
Economically viable reserves even at current gold price levels are becoming almost impossible to find. Many gold miners already have their backs to the wall and if gold goes sub $1k nearly all gold miners in Australia and many other parts of the world will simply cease to exist. Production would dry up overnight.
Futures has comoletely distorted the gold market and the repercussions are eventually going to be felt for decades.
“Futures trading is an exceedingly-risky hyper-leveraged game, so these speculators can’t afford to be wrong on gold for long. Once it inevitably starts rallying, the losses on the short side explode so those traders are forced to rapidly cover”
http://www.321gold.com/editorials/hamilton/hamilton091214.html
Gold weekly – http://scharts.co/1utRZTv
whoops – a look back in time there. actually looked quite bullish at that point, tho, eh? try this for the up-to-date view – we just dropped support – expect lower prices next week: http://scharts.co/1utSfBV
ultra909, you do realise you just proved a point?……for allintents and purposes gold was and HAS been looking more and more bullish, to the degree that not only the metal, but also the shares were on the verge of major breakouts………and then???……….of course a way over extened dollar rally allows gold bears to pile on huge short positions just at a crucial juncture…..but of course it’s all just coincidence yeah.
Manipulated? Probably. They didn’t call it the “fix” for nothing. No point fighting the tide though. Besides, you get to buy even more at cheaper prices – so what are you complaining about??
Meanwhile, BKR on RUT Friday completes a daily retest sell setup – sell any break of the Friday low on Monday, initial stop above the high: http://scharts.co/1utSJrQ
The weekly already entered short on the same setup: http://scharts.co/1ARDMS9
This fact is undeniable. Central Bankers hate gold. They hate gold because it shows up so many follies of CB fiscal incompetency along with acting as the barometer extraodinaire of instability.
Let’s keep the illusion going as long as possible.
Andre, you always sound so certain!.
However I have made a note,
Friday was the low and next week is Up.
Phil,
haven’t been more certain in my life. It is amazing what you can see once you found the right tidal station. So my concept was right (gravity). my indicators were right, but the tidal stations were wrong. Garbage in is garbage out. Found a brillant station and I think I see the power of gravitational forecasting for the first time.
Save that note; next weekend you may shoot me 😉
Lets hope so…
Let’s hope we get to shoot him??
Wow… you guys are interesting. Looking forward to your posts!
nicola2910 “Lets hope so…”
You mean, shooting André?
I think Nicola2910 is referring to the power of gravitational forecasting. And maybe I should have added : if I’m right I expect congratulations 😉
You may want to hide the firearms just in case:
http://scharts.co/1qSisb1
Congratulations yes, your work , we will hold open a option on the other…
I think there is little doubt the markets rise into at least Fed speak. Alibaba IPO and all hail the great US Fed.
Holding gold in this environment is a no brainer to me. I’ve said it continually that risk is no longer even quantifiable much less being insurable anywhere other than gold.
They have destroyed all semblance of rationality, order and logic.
http://davidstockmanscontracorner.com/wall-street-at-work-aggravating-risk-citi-says-leverage-junk-bonds-at-2-3x/
John, reading Harry Dent’s book, and he thinks that gold was a bubble and will collapse with the deflation from demographics. Quite a contrast to your view, given he is using the same inputs as arguments!
Correct me if I am wrong John, but Harry does not believe that the US Dollar will be going down substantially in future years
Harry has been a leader in studying demographics but I do not support his views in the US dollar or gold.
Yes, he believes that the dollar will rise, as do I, and it has indeed recently.
However, I think gold and dollar can both rise.
There’s now an incredible number of people queueing up to assert that the US stock markets are topping and about to crash – and the height of irony is that these uber-bears are all claiming that there are no bears left!
This chart was posted recently, in support of the bearish argument, of “Investors Intelligence Bears” showing previous similar occurances to the current level: https://solarcycles.files.wordpress.com/2014/09/11se1.png
Looking at the early 1986 example shown, what happened next?: http://stockcharts.com/freecharts/historical/djia1986.html
You can’t rely on these survey respondants to tell you where the real money has been going.
Mark, I don’t think an incredible number of people are bearish. I have always used Investors intelligence and it shows an incredible small number of bears, plus there is all the others sentiment signals John has shown us. However, there is no law that prevents the lack of bearishness to go even lower and the mkt to go even higher. The two bullish things are credit easiness and 60 year Gann Master Time Cycle. We bears think the debt level and demographics plus the extremes of all the indicators John has shown us indicate at least a major correction. So far the bulls keep winning. Also, the early part of a bull mkt is characterized by relentless up in the face of overbought, overvaluation, etc. This is the one thing that gives me real pause about the bearish case.
John, “Gold behaves as the anti-demographic”. This is equitable to stating when Earth was created 20 bars worth of gold produced by previous solar masses gone supernova seeded the planet. Humans then coveted it as precious. 20 bars to 1000 people, it costs less, not more. When half the population dies of old age, there are still 20 bars, but now it costs more. The cause? Lower population equates to less demand and smaller economies of scale. Therefore, less opportunity to invest and get reasonable rates of return. Gold remains scarce irregardless of scale of economy. This seems counter intuitive except that fiat currencies do not precisely align to demographics or gold supply.
If there are less people sharing the same resources, it is more abundant.
@John Li – Perhaps I wasn’t clear: Yes, that’s an obvious statement (your reply), but if supply is greater and demand is less then prices fall, not rise. Since gold is not tied to a fiat currency these days, there has been a decoupling. Scale of economy drives monetary velocity and supply of the fiat currency, not gold. The increase in gold prices based on charts above is temporary at best and priced in terms of a specific currency. Those using it to make a last resort profit still need somebody to sell it to recoup their long investment. The 1970’s charts presume demographics will increase at some point in a reasonable future i.e. a decade? 15 years? Doubtful as birth rate has correlated to solar cycles and if they wane in intensity according to Landscheidt’s schedule and automation of robots replacing physical partners for some. If decrease in solar cycle intensity and sunspot count leads to amplitude and frequency changes in cycles, expect the same for markets and the inability to compare to the strongest cyclical patterns until we have data for a millennia or so. That doesn’t mean it can’t be computed though.
To be clear, you are saying that demographics lead to a drop in gold prices, just as in Dent’s recent book?
I have not read Dent’s book. I’m just citing basic macroeconomic tenets. Supply and demand. Less people, less demand. Less demand, lower prices. Add to this inflation is gold’s friend and we are going into a multi decadal deflationary spiral unless 1 to 3 things happen. Currency resets or new currencies, bankruptcies, or war. Status quo, demand will fall. If fountain of youth found, and massive devaluing occurs then scenario changes. Gold priced in currencies may rise in the later examples, but you have to have a buyer and a central bank willing to devalue currencies so much that we’re talking Zimbabwe inflation and income or payroll increases proportionally.
Nascent up-channel in EURGBP, plus a fully-formed daily retest buy pattern (thanks to a bullish KR on Friday). Thinking that this could be a runner, especially if we get an earthquake in the Scottish independence vote on Friday.
OTOH, Betfair still have the Noes as massive favourites – and the bookies are never wrong, right?
Andre, “..Never been so certain of anything in my life..”
That is quite a claim.
Parallels to 1937 – Robert J. Shiller
https://www.project-syndicate.org/commentary/robert-j–shiller-worries-that-too-many-people-are-losing-confidence-in-the-future—and-in-democratic-institutions
testing
It’s safe you can come out…..
Hello, when is your next week forecast coming out?
having problems posting
posted my analysis 4 times; don’t know where they went.
Anything with more than one sentence doesn’t make it.
even installed a new browser
I give up for today; maybe tomorrow.
It would be nice to see a weekly chart accompagning your post.
First I have to make the updates work; than I will consider adding a chart.
crisstoff, trend is objectively down since the high on sept 3
now if we rally above 1999 then we get confirmation of a continuation of the PREVIOUS trend…
http://stockcharts.com/h-sc/ui?s=$SPX&p=D&st=2014-05-21&en=today&id=p22457060024&a=366970903&r=1410727470565&cmd=print
ELVIS could u please put these charts up again
then explain the significant break of the long term monthly trend…?
sure it could recover but we are talking about monthly charts – that means it will take a while for evidence of an actual bottom to present
there will be a pull back in the USD but it wont go below 81.25 and gold will have a small and furiously unmanageable bounce that will get everyone excited but will trap them once again.
http://stockcharts.com/h-sc/ui?s=$USD&p=D&yr=2&mn=1&dy=0&id=p71182438044&a=367495890&r=1410626657269&cmd=print
SLV might actually break 15 and as this MF projections indicates metals wont bottom until summer 2015
http://stockcharts.com/h-sc/ui?s=SLV&p=W&yr=4&mn=10&dy=0&id=t60660732212&a=304345386&r=1410626768101&cmd=print
Futures lower across the board atm.
when this cracks full monty then naked will be those who thought they were covered, so to speak – lol@!
IMHO the strong support for gold is 1220$, if it breached, I really don’t how far gold could go down , 1000$ ?
Australian gold index up today. Gold stocks are beginning to show divergence. On the collapse in gold last year gold stocks were getting pummelled..
1290$ is good to go for this week. I still believe in gold bearishness but market bit of oversold
http://thefelderreport.com/2014/09/10/taking-a-shine-to-the-gold-miners-part-deux/
Last nights spike down on futures smells like a stop hunt. Anyone have any stats on how the market has performed during fed meeting weeks? Probably up but the stats would be useful if they are available.
Junk bonds —
http://charts.stocktwits.net/production/original_26752502.jpg?1410622216
Duncan, there was also weaker China data
so lower futures last night was not a surprise.
Phil, China is the world’s second biggest economy and is beginning to slow dramatically. The Chinese Politburo can not continue to hide the fact that their economy is a slow motion train wreck.
If people think the Fed and ECB have gone stimulus crazy the last 6 years then rhe Chinese have gone stark raving mad.
The Chinese have stimulated more than the BoE,ECB and Fed combined, which has lead to a shadow banking industry pile high with sub-prime loans.
I have always thought the global melt down would commence in Japan, I am starting to think that China will be the sarting point.
Allan, I do not disagree with that though have a less bearish take.
The next bear market probably has it roots in the east and China
will play a part.
Very little follow through so far from bears today.
Total complacency mate, that is bearish in my book.
An inversion pushed the low to Monday. No more inversions this week = up.
I can’t post my extended analysis; don’t know what happened. Too bad; I’ll have to limit my self to very short messages.
Andre’
I’ve been following your work on Lunar cycles, and have started playing with them myself. If you don’t mind, I would appreciate any thoughts/clarifications you might have to the following. After I make a little more progress on the Lunar cycle,I will be looking to incorporate some of Johns work on Solar impact into the cycle.
My understanding is that you have gravity as a major short term impactor of human emotions (I agree), with high gravity=low prices&slow gravity=high prices, and are using Tidal affects as a Proxy for gravity. (correct?). I have the same thesis, but looking to incorporate the different gravitational effects separately for other reasons. It seems that these other gravitational variables are:
1. Sun=constant. Not technically true do to eliptical orbit, but the change is slow enough to be constant for My purpose and model.
2. Moon longitude=highly variable depending on location. Low gravity=offsetting sun at 1/4 moons, and high gravity at full and new. (Any view on which has a greater gravitational impact, new or full moon?)
3. Moon Declination=highly variable, gravitational and perhaps electrical. I would think that the gravitational impact would be greater when sitting on the equator as opposed to max or min declination. That may not be true if you are in NY in the summer at maximum declination, opposite in Winter, the gravity effect of declination may be different due to the time of the year because of the earth axis tilt. (If you have any thoughts on this, I am struggling a bit). Also, if the moon creates a reflective electrical effect on earth at full moon, which may impact emotions, that may vary for the time of year and declination.
4. Lunar distance=Apogee low gravity, Perigee= high gravity
Lots of moving parts, I can see the attractiveness of using a gravitational proxy near the latitude of financial center. I may have to come back to that.
Since longitude, declination, and distance have different cycles, they may seem to be in sync (not to be confused with ‘N Sync), then out of sync. But there is a solution.
Next step, correlate with solar energy. It is interesting that the Sun has different rotational speeds, faster at equator, slower at poles. It may be that tiny Mercury may play a role in this, and by ‘dragging’ the the waves of energy output from the sun as it rotates around the sun. (If anyone has insight on this, thanks in advance). I also find it interesting that Mercury’s synodic rotation is 116days=~4 Lunar months=118 days. Synchrony. Also, 3 Mercury rotations=~12 lunar months=~1 Solar year.
If any one has thoughts on above, it would appreciate views.
Steve,
Gravity is a complex thing. The advantage of tides is that you see the net result. Lunar declinations can cause inversions, but I’m still working an that. I use Apo/peri as a filter; tides in sync with apo/peri or not. Just find the right station; most are useless.
Allan, there will be large % falls come the next bear,
so I do not see that outlook as complacent.
However this is unlikely to start over the next few
weeks as many here expect – and possibly hope for if short.
We could experience a sentiment shift causing a minor
correction at any point.
The next bear market will come with a weakening outlook
for US earnings.
There are already some early warnings, MCD as one example.
Rising longer term US rates also need to be watched closely,
however they may begin to drift down again shortly.
Andre, It’s only Monday afternoon and you have already
altered your view.
Okay; have it your way. I’m out of here.
Patience, Andre.. i understand….
John, ask Andre to stay..
Andre, hang in there. We are learning along with you and common sense dictates it’s a process with some hiccups to be expected along the way. But that shouldn’t discourage you – it’s the nature of the beast! At the same time, because you ARE figuring this out, it might be wise to give yourself so wiggle room in terms of your predictions. 🙂
OECD warning on the current valuation of risk assets
in the context of slowing growth.
Downgrades US and Euro area GDP estimates.
Phil, my complacency comment wasn’t directed to you personally but the market as a whole.
We have detiorating economic conditions in Europe, China, Japan, Russia. War escalating in at least two regions, Global GDP reversing and most investors have not only their heads buried in the sand, but are head first 6′ under from the soles of their feet up.
Risk aversion is totally non-existant and most wouldn’t know what the hell that was anyway and not one economic leader is prepared to take control of the helm and make any decision to avert the impending disaster.
Mate the fact is that we are finished. You, I or nobody else knows for sure when that comes, but I would rather be way too early than a few seconds late because I can guarantee you this.
Just like the last episode in 2008, events unfolded so rapidly that the system went from start of crisis to almost complete collapse in, I believe, less than 18 hrs.
Good luck finding a safe haven next time.
Add to the above the fact that there so many articles like the one below hitting headlines in MSM in recent weeks amd I am not talking tucked away along with all the other articles, I am talking “in your face”.
Sure there are the odd bearish articles, but super bullish articles are emerging daily.
http://finance.yahoo.com/news/s-p-500-to-zoom-to-2-390-by-end-of-next-year–technician-201303605.html
Allan, I agree with your sentiments generally, except for your assertion that risk aversion is non-existent. Western investors, and now savers too, are scared of their own governments.
I think the two main fears are 1) the inexorable drive towards creating inflation; and 2) the promised wealth confiscation
So who would want to cash in an asset for increasingly debased fiat paper? Where would they put that cash? In a bank? In the bond market? Maybe into commodities at some stage, but there’s no sign of that yet.
Allan, I am more bullish on the longer term outlook.
Even an uber bull currently would need
to concede that risks are increasing.
Longer term US rates will begin heading lower imv,
however if there is a demand gap on slowing global
growth earnings will begin to come under pressure.
That would kill this bull market very quickly
and this is the most likely way it will end.
US earnings growth targets start of 2014: Q1 4.4%, Q2 9.2%, Q3 12.2%, Q4 13.5%; Actuals: Q1 2.2%, Q2 7.7%, Q3 6.2% (new estimate) (ALL MISS)
The point is the current valuations in stocks need quarterly 10% earnings growth to justify, and it’s not happening.
The Q’s are gone
http://stockcharts.com/h-sc/ui?s=QQQ&p=D&b=5&g=0&id=p55796710501
Given the past two years i wouldnt write off the bulls just yet. Im expecting tech to go higher.
NASDAQ losing momentum…http://jlfmi.tumblr.com/post/97136187715/nasdaq-near-52-week-high-but-more-new-lows-than
Whatever your viewpoint I think earnings will
be the key that unlocks the door to the next bear market,
by which I mean a 20% plus decline.
Sharp sentiment shifts can occur outside of this
on changes in perception, without a fundamental
change taking place.
While I would agree with John that current US valuations
demand strong earnings growth, my own take is that mean
earnings expectations will need to weaken further before
this spills over in to significantly lower market valuations.
“uptick” in AAPL insider selling.
For Andre:
“I have not failed. I’ve just found 10,000 ways that won’t work.”
― Thomas A. Edison
And one who does not seek, shall never find. My best.
y is dow not falling today
is it all to do with alibaba ipo and selling to free cash
Hello John, Fantastic site & analysis. Just wondering is there a new post for the 15th?
Thanks and no
No higher high after the March high but higher lows, YES. If we do manage a turn soon and a higher high above the July high I believe this explodes and I also believe TPTB know it and have been doing everything to avert it by hitting gold as hard as they can.
The shares are signalling something here I think and as I said tiday, the best proxy for gold bar none, the ASX gold index was up despite Friday’s down day in gold
http://stockcharts.com/h-sc/ui?s=NUGT&p=W&b=5&g=0&id=p15931766948
Yes, Allan. The fact that even junior gold miners (GDXJ) are holding up despite the recent relentless attacks on gold price, still above 200dma now, signals the liquidity started to flow into this sector.
Moreover, many gold/silver mining stocks appear to be strengthening as well.
I am still tracking the present “rounding top” pattern to the trading action that occurred earlier this year when it hit an early Feb 2014 low and rallied over 100 points in SPX to a new 52-week high in just 21 TD. So far since peaking on Sep 4 2014 the action has been quite similar to it last peaking on Mar 7 2014, although maybe slightly more bearish since it has traded slightly below the Sep 10 support low. But assuming the Sep 8 2014 failed retest of the 52-week high mirrors the Mar 11 2014 failed retest back then, here is what to expect somewhat:
SPX will trade in highly volatile up and down movement in a sideways range from here up to early Oct. The 50d-MA should hold during this period and it should bounce in a 25-30 point range from 1975-2000 and possibly even hit the 52-week high again at 2010, although that is more unlikely since it looks more bearish this time around. Anyways, looking back earlier this spring it then experienced a sharper correction lasting about one week in early April for a -4.5% decline or -85 points.
So if the fractal pattern continues we should also expect a one-week decline from possibly the Oct 2 to maybe Oct 9 2014 period of around -4.5% to -5%. But I also do not expect it to decline too much further than the 50d-MA and that implies a drop from say 2000 to 1955-ish or just -2.25% in that scenario.
Anyways, regardless of what occurs it is realistic to assume a major buying point from around mid-Oct after the one week correction occurs. All shorts should close their position right then. Because the fractal from spring 2014 had the SPX rallying over 8% in two months to new 52-week highs after hitting the Apr 2014 low. A similar result implies 2060 to 2120 in Dec 2014 depending on the extent of the Oct correction.
It does seem like every SPY dip is being bought. Quite frustrating to be short the indices, but meanwhile TSLA and other speculative stocks are tanking.
Yes true. I’m still short Dow but every time it drops I hedge long at 50%. Made about 200 points on Dow doing this over last two weeks so it’s helping reduce the break even for my shorts. But it is getting quite frustrating I must say when all the small dips are being bought. Maybe a Scottish yes vote could be the catalyst for big market declines.
I don’t think that would happen though, and therefore likely a FOMC and Scottish relief rally to come. Perhaps they will be short-lived and another leg down will ultimately happen. Not really trying to predict day-to-day anymore.
Thee Markets usually likes FOMC,rate cut or hike doesn’t matter
RUT and NAS off about a 1%.
John Li, would tend to agree about the relief rally
and also it possibly being short lived.
Steve T, interesting post.
I personally don’t expect a major sell off until next week 09/22 as the earliest. Buying on dip mentality is common during the FOMC meeting week as I don’t recall if the market ever crash during the Fed meeting week.
End of September / Early Oct has been my target all along, and I have no doubt that John’s points will be proven right sooner than later. Patience is virtue.
Good read. A lot of points already made by John over the last few months.
http://www.hussmanfunds.com/wmc/wmc140915.htm
Also, in the FWIW category and as a follow on to my Solar/Mercury comment above, there is a a Mercury Elogation cycle that is every 116 days. It has a history of correlation with equity market moves of varying degree and duration. The next Mercury Elongation date is this Sunday, September 21, as the Moon slips past the equator, between the Earth and the Sun on Monday, and Apogee having been left on saturday but the Node soon to ascend. There is a lot of activity over the next month. One I know, and consider wise, deadpaned once, “at highs and Lows there is a lot going on”.
Steve; key dates : autumnal equinox (Sept 23) and lunar wobble (Oct 12).
Cheers,
André
Yep, good point. Thanks. Also , I agree on your point on net effect of tides. For now I wanted to examine the component parts,then I’ll probably circle back to using just the net effect. Thanks for feedback and confirmations.
Steve – your comments and findings are very interesting. I also have been wondering what the forthcoming Mercury Max will bring.
During its closest approach to us between 21 September and 1 November Mercury will effectively catch up with us in its orbit, then stop, then reverse, then stop again, and then continue past us. It has its own polar magnetic field, so this is bound to affect ours; and it must also interfere with how the sun’s magnetism and solar wind reach us.
With Venus and Jupiter’s opposition to us having faded, and now Mercury joining us I wonder will that tidal influence on the sun’s plasma cause more of the sun’s magnetic disturbances to come our way? If so, we are in for a especially hightened geomagnetic season this autumn.
The next couple of months could be make-or-break for many markets…
Yes, I view Mercury as ‘stirring the pot’. I don’t pretend to know a lot about Mercury’s cycles, but I should have mentioned that in addition to the 116 day synodic cycle, there is the Mercury rotation around the sun of 87.5 days which may tie in with solar flaring (by twisting the plasma within the Sun which leads to Solar Flares) that occurs on an 11.5 year cycle (with significant variability) associated with 48 turns of the 87.5 day Mercury cycle. Still trying to get my mind around this concept. This 87.5 day cycle also ties into 12 lunar months of 354 days, as does the synodic cycle. So perhaps the key to incorporating a Solar activity (on a short term basis) is comparison through the effect of Mercury by using a 12 month lunar cycle of 354 days.
The Mercury Elongation can be associated with pivots (high or low), or accelerations. Last July 12 was at a pivot top, May 25 was in the middle of a strong acceleration, and last Jan 31, ’14 & Oct 9, ’13 with pivot lows. Some moves are strong, some are minor.
There is a lot going on out there. There is a specific type of 120* relationship between Jupiter and Uranus that has a history of driving gut wrenching sell offs. The next one occurs on September 25. I am not claiming that will happen this time, just to be aware. And as Andre’ has alluded to, October will provide even more entertaining research opportunities.
Forgot to ask: what type of correlation do you see between Mecury Elongation and the equity markets?
Thanks all. New post out.