
It’s becoming clearer with hindsight and this is what I see.
1. The bull market topping process in equities kicked off January 2014:
 Source: Stockcharts
2. Speculation peaks with the solar maximum, which was April 2014, putting equities on borrowed time after that:
 Source: NOAA
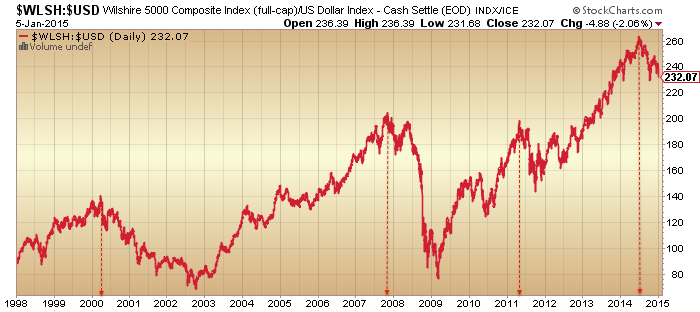
3. US stocks measured in USD and relative to bonds both peaked mid-year 2014, compare to previous major peaks here:
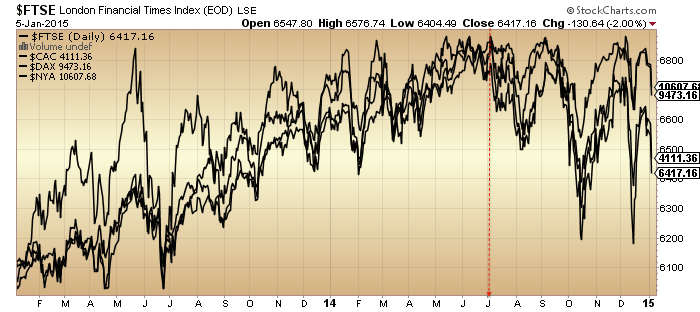
 4. Multiple world stock indices peaked at the turn of July, most of the rest by September:

 5. US stocks composite, breadth, volatility and oil all turned at the start of July:

6. The very last global indices peaked out at the end of 2014, with the peaks largely fitting the geomagnetic seasonal model (mid-year, end of year) and close to the new moons of June 27 and Dec 22:
 7. These final peaks were delivered on saturation in sentiment and allocations:
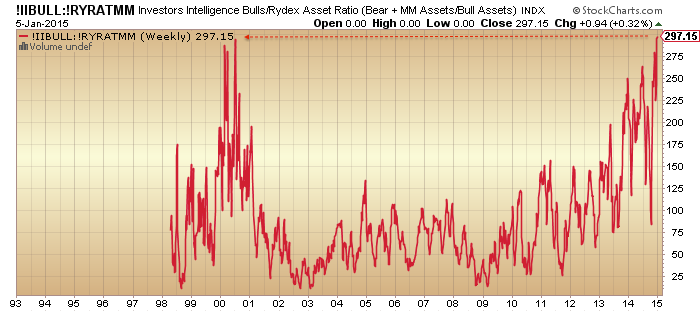
(AAII equity allocations in December reached their highest since June 2007 too).
8. The final push from mid-Oct to late Dec was purely multiple expansion as shown below, as falling oil and rising dollar both cut earnings forecasts.

Source: Yardeni
9. US leading indicators have dropped sharply since mid-year and echo previous major peaks:
Source: DShort
10. Ditto financial conditions:
 Source: Charlie Bilello
Plus, the US yield curve has flattened more sharply in December, whilst German and Japanese bond yields have reached record lows.
11. Meanwhile sentiment and relative value in the precious metals sector mirrors the 2000 major reversal in gold:equities.
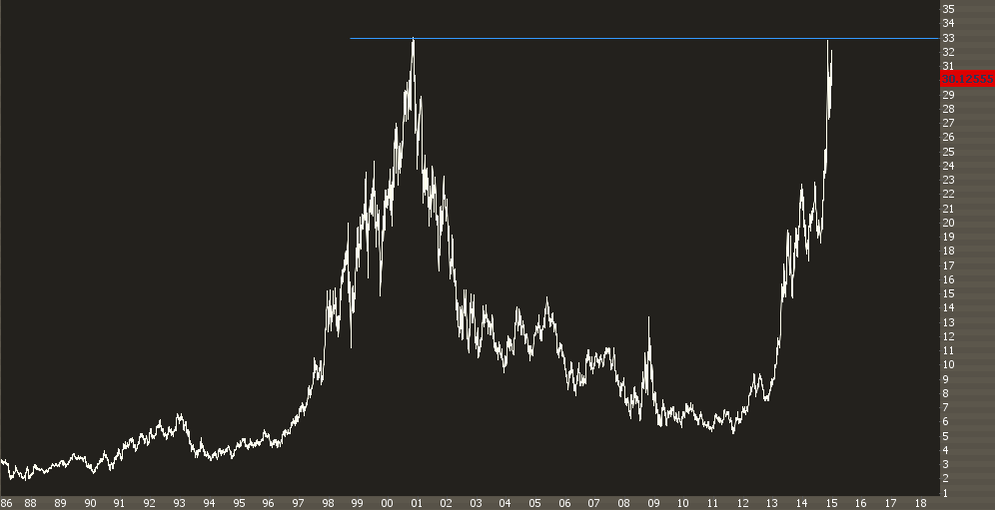
Source: Inflated Temper Source: Gold Trends
Therefore, in keeping with the geomagnetic model, equities should tumble from here to a low around March-time, whilst gold breaks upwards. However, this does not preclude further oscillations in the near term. Short term, we are reaching several oversold readings in equities plus we are now through the full moon.
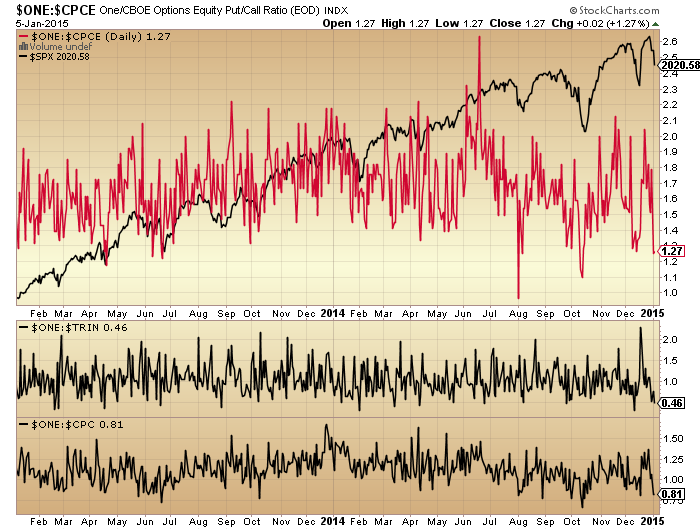
Trin and put-call could produce a bounce here. Capitulative breadth hit 3 yesterday, so not yet at a reversal reading but perhaps getting there with some more selling today/tomorrow.
To sum up, I see the effective peak in equities as the start of July 2014 and any rips in stocks to be sold (whilst gold should rise). Stocks may get a short term bounce but we should finally see the major drop in equities as we head towards March. Earnings season begins 12 Jan and ought to be a sell due to the sharp downward revisions. Historically, major price drops were swift, lasting just 2-8 weeks, so we need to be alert for signs the allocations and leverage is starting to be disorderly unwound.

Another well written, well supported article!
Thank you again John for sharing your analysis.
Yes it did john!…..most just can not see it but things are beginning to develop very rapidly.
Copper now collapsing along with crude. FTSE, CAC,AORD and HSI indices long term all look horribly ominous. US indices rolling over and USD way way way over extended along with SSEC.
USD will collapse along with US equities.
http://stockcharts.com/h-sc/ui?s=$FTSE&p=W&b=5&g=0&id=p85673414989
And Martin Armstrong has been responsible, due to his huge following, for driving investors out of gold and gold equities when they SHOULD have been accumulating them. Just like he wastalking $5k dollar gold in 2011.
The guy really has a hide taking a swipe at others. Let’s not forget this time around how he has been talking 23k DOW once again quite likely at a major top!
How will he spin this one after the fact?
Alan, you are completely wrong in my opinion. USD will not collapse anytime soon. Markets still have time as well.
Good luck!
Agree 100% with Big Tune.
Good luck John and Allan.
Was Martin Armstong so powerful to have persuaded the Swiss citizens to reject increasing gold reserve?
Gold is no longer considered by the Swiss the must have asset. This is the new reality. Is their new conviction going to spread around the globe or they merely reflect the changing attitude toward gold?
USD most likely won’t collapse against other fiat currencies, but it sure will collapse against gold. It’s been collapsing against gold since 2000 and it’s not about to stop now.
You nailed it, Allan. I don’t listen to Armstrong at all, except perhaps as a contrary indicator.
Allan, MA was a contra-indicator back in the late 90s as well as he has this time around. He removed all of his old projections that were wrong, wrong, wrong. In fact, he claims he accurately predicted the moves back then. The crowd of lemmings that follow MA are headed over the cliff.
As far as the USD, you are 100% correct. Given the level of foreign investment, as the broad market goes, so goes the dollar.
USD only started its uptrend. Its been basing for years. With other countries doing QE and USA unwinding, the dollar will continue its uptrend. Not to mention its the safe haven. Hello Deflation.
chart
http://stockcharts.com/h-sc/ui?s=TNA&p=5&yr=0&mn=0&dy=18&id=p18409438514&a=326441308&r=1420536147373&cmd=print
We have definately entered into a phase of transition. The sun’s complexion changed during September 2014, as the proportion of geomagnetic disturbance from longer term coronal holes started to increase. This, and the large coronal hole at the southern pole are typical signs of an oncoming decline in sunspot numbers. But there have been similar polar holes before, like during summer 2013, and these were false starts.
As the sun spins, the solar wind is arched backwards and the fast stream from the coronal hole catches up with previously emitted slower wind from surrounding regions, and a wave is formed; so the effect from these holes reaches us in waves – as evidenced here in the Daily chart: http://cr0.izmiran.rssi.ru/mosc/main.htm
Also, sunspot groups have been increasing in area but declining in number – another sign of a very mature solar maximum.
But sunspot numbers are still relatively high, and there is no northern coronal hole yet because the northern field strength is persistently practically zero. So the big question, I think, is what will happen when the sun’s northern hemisphere eventually starts to strengthen in its new polarity?
If it strengthens rapidly, then sunspot numbers will die away. If it strengthens slowly (which is most likely, given its performance so far), then that will cause another temporary surge in sunspot numbers probably for another six to nine months afterwards.
So I continue to view SC24 max as a process rather than an event; with that process now well under way, but unlikely to be completed until at least early summer 2015.
Thanks, Mark. So for us laypersons, is it fair to say that you view John’s descending red line on the ISES Solar Cycle chart as proceeding far flatter in 2015 than what John currently envisions?
Flatter, yes Gary – but if sunspots persist for another nine months or so, that wouldn’t require a very big adjustment to the NOAA’s current red line. And the SC1 comparison still has an outside chance, which would actually turn the red line back up.
That big surge in the monthly number during H2 2011 was mostly caused by northern hemisphere sunspots appearing immediately after the northern polar field originally flipped. But it subsequently reversed back to zero, and is now trying to flip again. I think this second (and final) attempt will be similarly slow to the first – hence a forthcoming temporary increase in northern sunspots.
I think the north solar pole has re-flipped, but I am disappointed with the latest negative reading.
http://wso.stanford.edu/Polar.html
Yes, it is a process.
are you thinking that the solar max lies ahead of us, instead of having already peaked?
Just an update, if anyone is interested…
As mentioned yesterday, and after running data last night, my swing trading system officially went to a 50% Sell signal for today…
Chart signals are mixed, but another move down in HY bonds triggered this signal… All in all, a pretty normal process and trigger for me….
And this is just for tracking purposes, not trading advice for anyone (but me) 🙂
As expected, this trade just completed looks to be a whipsaw for a small loss, following my last (longer) trade that was a larger loss…..
That’s two system losses in a row, which is unfortunate, but…..it happens…
But we move on, and as noted, now on a 50% short signal….
GL…
John, love the new bull/bear chart.
Regarding,
“Historically, major price drops were swift, lasting just 2-8 weeks, so we need to be alert for signs the allocations and leverage is starting to be disorderly unwound.”
This seems off.
– 1987 was not a solar max, so we can disregard it. The solar max crashes seem to take longer than the flash crashes.
– 9/2000-3/2001 was 7 months for example, which is beyond 8 weeks.
Dow 1929: 3 weeks 44% declines
Dow 1937: 8 weeks 38% declines
Dow 1968: 8 weeks 18% declines
Dow 1987: 2 weeks 34% declines
Nikkei 1989: 6 weeks 27% declines
Nasdaq 2000: 3 weeks 35% declines
SP500 2011: 2 weeks 18% declines
Has the Dollar made a major top and the Euro a major bottom? Don’t be fooled by the ECB relentlessly grasping for straws to initiate QE. The Germans are steadfastly against an ECB QE program. It also looks like that the FED will begin QE4 as Treasuries rally to the moon (long term Deflation raising its ugly head).
I don’t see the Fed buying Treasuries when everyone else is piling in them. The Fed might have to buy stocks for QE4 like the Bank of Japan is doing indirectly through their pension funds.
Newt, frankly buddy I don’t give a rats a%# about the Swiss vote because the majority are always wrong anyway.
My point was that Martin Armstrong right alongside with many other prominent analysts have put the fear of God into investors over gold and gold stocks at a time when they should have been accumulating them.
I am not sure what show some of you guys have been watching the last few months but the one I am watching is telling me that the stock market is historically extremely overvalued and facing a extended bear market, potentially for years,whilst gold and gold stocks are about to embark on an equally extended bull market.
It is of course no concidence that as the market has declined in recent days, gold stocks have shown considerable strength.
Thank you Allan. I am glad to see someone more bullish than me on gold here. And just watch MA change his tune when he is wrong again. He has got it down to an art by now.
Allan,
Mate, I’m with you all the way. The ASX is not historically high, however, the economy is in a bit of trouble and the Aussie market is just following Big Brother. Bring on the bears, gold & silver…….go go go
Cheers
Mat
Also if anyone thinks that this ascent is sustainable for much longer, think again.
It is a two edged sword for US equities ATM. Collapsing crude prices and the dollar are piercing the US equity bubble at this very moment.
The selling will increase into a panic very soon. That will lead to massive capital outflowing from US markets and the dollar to collapse.
The only real safehaven this time around is the one that has been despised for the last two years…gold.
Everything is about to go full circle.
I meant to post this chart in regard to the opening comment. The ascent in the USD is not sustainable and will bring its own end
http://stockcharts.com/h-sc/ui?s=$USD&p=W&b=5&g=0&id=p45456740809
The $ went up 30 points in 11 months in 1981. It has gone up 10-12 points in 9 months so far this time. New bull markets are always fought as overbought, overly bullish, ahead of itself, and unsustainable.
Alan, Alan, Alan…. You just don’t get it… *shaking head here*
Clearly, you don’t understand how the Fed will bail everybody out, and we’re all good… No worries here….
Or at least that’s what I’ve been told….
There… You’re welcome for my analysis… 🙂
*entire comment very tongue-in-cheek* 😉
I think equities are toast, but you better not hope for a dollar collapse cause you can’t do much with your gold in a mad max world. Fed cares about treasuries and dollar more than the stock market. The fed and the fat cats of the world need a dollar to survive.
As if hoping makes any difference. The dollar is toast as all currencies that have been abused to such an extent have been throughout history. To turn a blind eye to history is a fools trait.
No, it’s a race to the bottom. Yen will be first. The US wants to be last. The dollar is currently the prettiest pig in the currency trough.
considering that around 25 percent of the SPX index was oil related companies and considering that the price of oil has fallen by more than 50 percent in the last 6 or 7 months, why did the SPX continue to rise during that period and even now has fallen only a few percent off its recent all time high? Does that not concern you? Seems like SPX ought to be down at least 15 or 20 percent due to the oil crash alone. What will happen to SPX if oil prices stabilize, or even just have their rate of descent slow down?
Rotation into healthcare and utilities, perhaps.
Richard, in a word, no, the Eurozone is bordering on recession,
or perhaps worse.
Mentioned to you last week that you do not need a $
decline for equities to sell off.
As the Yen Carry Trade reverses the Dollar will sell off and US stocks will decline. The FED’s QE4 will probably result in the long awaited “second chance top” before the decline in US stocks really gets going as the reality sets in that the FED can not revive the economy.
Barry, now now!! – your’re better than that )
I was solely tempted to make a comment myself,
but thought, will be good and refrain.
Nice start to the year for those short.
Hi Phil;
Yes, but you’re a better (and stronger) person than I am…. 🙂
Hopefully, we won’t get another V-bottom rocketship tomorrow….
I’ve got charts to review tonight – like every night – but I’m probably going to lighten up a bit on shorts later today or tomorrow…
At 162% net short right now, and it continues to grow as the market goes down, so not really comfortable right here…
John Li; I may have given you the wrong suggestion regarding getting the price data
for the 1873 Amsterdam stock crash. If you have to construct your own chart (like I did for the U.S. for 1835) find out what was the main newspaper of the day in Amsterdam? That should provide you with the data I would think– assuming they published the stock prices. All the best. As an aside; I have requested similar data for August of 1835 to insure I am correct about the peak occurring in May as opposed to August. It has been a long time since I did the original search and I want to be sure. The monthlies show the same exact price for the months of May and August, 1835.
Thanks, wow you are rigorous.
If there indeed was a peak in 1835, I would suggest that it has nothing to do with the sun. The solar max was in 1837 — and my records show the crash being the Panic of 1837. The waterfall was on May 10 1837 — I had thought the peak was around 6/1836.
We had a crash in 1987, before the solar max crash in Nikkei in 1990, so it can happen.
Several weeks ago, when I first started posting on this site, I said that the ATH would be in the first half of January. It being late December is no problem with me. I am going to act like the ATH is in. But, I also believe that a QE4 will happen that along with the mantra of ever falling energy prices will result in a “second chance top” that retraces the 76.4% fibo of this current decline. This means that this decline is an Elliot 1st wave and the second chance top will be an Elliot 2nd wave or A-B-C correction higher before stocks go totally over the cliff.
There will not be a European QE; what there will be is an American QE4.
Hi Richard
How did you work this out?
regards
bobc
One quarter of all Germans in Germany are, or the descendants of, those forced into Germany –after– the War. They will not support governments/societies that rejected them and stole their lands and businesses. Many of them are descendants of Germans who had been in those areas for over five hundred years which is longer then Whites have been in the Americas.
Parenthetically, this board has been an interesting study in psychology over the past year. When markets sold off early in 2014 there were been many comments about the bear being imminent. However as that selloff and each of those that came subsequent have reversed only to go to new highs, those same bearish refrains have become quieter and fewer. Now, we hardly seem to be commenting at all about this 4.5% decline from the top. I call that bearish for the market, lol!
P.S. I myself have leaned John’s way so I’m not casting aspersions. Just making an observation.
Very true! No doubt many of those who fought against rising US stocks last year (or more) eventually gave up recently, just at the wrong time. I’ve made the same mistake, and not just once or twice.
With all this fixation on US stocks, there are some compelling opportunities elsewhere – like UGAZ.
I am also long UNG, but got in a little early last month.
I’m probably gonna be kicking myself in a few days, but I covered about half my shorts just now on these new lows…
Now at 77% net short in my trading accounts, and feel much better about being in alignment – roughly – with my trading system….
Lookin good, Billy Ray…
Feelin good, Louis….
How dare $NYADV improve overnight while price continues to go lower? The bears losing its gusto? LOL. Watch it!
Bottom not in yet but bears be careful.
How dare CVX is up when oil cough up another hair ball? LoL.
8 Day Lunar Chord with seasonistics:
Today: Down
Tomorrow: Down
Friday: Snap back rally?
Next Monday: Snap back rally?
Tuesday to Friday: Up bias.
Many stocks in my watchlist are now at support lines, but surprisingly many of them are after lower highs, including my superstar General Dynamics, which tells me that December high was not very broad, so the market wouldn’t surprise me to try to test below mid-December lows. There the market (which doesn’t know itself where to go) would decide its next move. On the other hand, we had a couple of fast days down in a row, which means a change of tone is in the cards. Anyway, I don’t lay my body parts under a falling ax so I was selling at ease into those runs down which were giving regular trend following setups that even a monkey would make money from, if trained. A technically trained monkey would be a money making machine, however all wannabes instead of trying to be a limited mentally monkey, suff their heads with knowledge which is killing their perception and initiative. Crazy world.
A technically trained monkey vs smart soldiers
He sure knows how to clear out a room.
Is he Janet Yellen in disguise?
Hehehehe!! Lurve it. despe. I’m going for training from that monkey.
They may be soldiers (idiots with guns, more like it), but giving a loaded rifle to a monkey???? ~Smart~, they are not….
“Darwin Award” winning soldiers, perhaps… hahaha 🙂
Would you like to fight those soldiers in the jungle? I wouldn’t. They’re not dumb, just gotten sloppy and realxed, which is human, while the monkey is dead serious. A human trader has a natural tendency to get sloppy and relaxed after big win or series of wins. He feels like on the verge of stardom, feels free to do most stupid operations, handing a loaded gun to the market.
As I predicted last Oct when everyone was looking for crashes and waterfalls in Nov, the Bradley turn cycle was inverting. This indicated new ATH by Thanksgiving and I even gave targets of SPX 2070 with a possible higher 2100 in Dec. Now BTC indicates a down move into Mar-Apr.
http://bradleysiderograph.com/donald-bradley-siderograph-2015/
The first target was the 125 dma now at SPX 1994, all declines except Oct have rallied from that point for the last two years. Given the quickness of the decline, I am upgrading my down projections to SPX 1800-1900 for Mar-Apr. However, we should have a bull trap rally back to 2060 first.
if this is dup please, trouble posting
Gary, many bearish would have thrown in the towel
during December, at a guess.
October in particular probably broke many people’s
resolve as we were so close to waterfall declines,
perhaps just 24 hrs to some real panic beginning to set
in before Bullard interjected and helped spark the start
of a rapid rebound.
When I mentioned the yield on the 10 year
looked set to dip below 2%, had not anticipated
that would happen just 2 days later.
Incredible moves in crude, it’s a complete melt down.
In the former post I read Betafish (good job so far with your Lunar Chord!) is on the lookout for more spiralwork from Sean McDonald, founder of 7442 Analytics. Did you visit his site? What I like about Sean, even more than the intellectual stuff he hands out to make him look smart, is his delighfull eagerness to persuade people to fork out some money to buy his spiral-products:
5 november 2014
Though you may have downloaded a sample Spiral spreadsheet .. we’re now offering a deep discount on the hourly Spiral spreadsheet sets from 2005 to 2026. In the past we sold each 7 year Spiral data set for $777.77 but now you can purchase the entire 21 year data set for just $1555.00.
18 november, 2014
Through next Monday, we’re offering the Market BIOS application WITH a 21 year hourly Spiral data set from 2005 to 2026 at a deeply discounted price of $7442.77
16 december, 2014
What else are you going to be doing to put an extra $372,138 in your pocket in the next 180 days? Simply message us and we’ll provide the details.
19 december 2014:
The bad news is .. the hourly Spiral sample spreadsheet is expiring on January 1st.
The good news? We’re having our own Cyber Holiday Sale!
Act quickly .. there’s only three available!
But hey, don’t forget this, 21 november 2014:
Bear in mind .. my intention was to never share my work with anyone. it’s too abstract for most to grasp before their eyes glaze over. But due to extraneous circumstances and proding by others .. I realized, “what good is the past 30 years of research .. if I die as the only person who knows this stuff?”.
Deep discounted, creepy lovely isn’t?
Words can be so powerful. You can almost physical feel the fumble of his impatient fingers while searching for your wallet.
A little to my surprise cycles keep doing a good job lately. The december top came in right on schedule. As for the Dax I’m looking for a -temporary- low on january 12. The Dow, the Nasdaq 100 and the S&P 500 is a slight different story: january 14 seems just as likely.
For instance: March 6, 2009 L- october 4, 2011 L =942 CD x 1.272=1198. October 4, 2011+ 1198 CD= january 14, 2015.
Peter.
Thank you for mentioning the “Lunar Chord” and it’s partner “Seasonistics”. They are highly predictive when used in concert. The spiral work is kind of beyond my knowledge level, although Purvez could be a resource.
Huh?!?!? Betafish I barely understand what you are trying to teach us. I have ZERO clue about the spiral stuff.
I did look at each one as they were posted hoping something would gel between my 2 brain cells but alas it really was beyond me.
I’m hopeful that if I get a third brain cell then I may be able to revisit those and understand the spirals.
Sorry but I’m not the ‘resource’.
The man with two brains cells is king in the land of one brain cell.
Beta – Funny!! 🙂
Betafish,
I did not see any prior explanation of “Lunar Cord” or “Seasonistics”, or what you mean. I googled it, but did not see. If you don’t mind, could you give a brief explanation or direct me tonight. Thanks,
SC
John,
You have mentioned in the past many times that commodities break down prior to a strong bear market crash. With oil, gas, iron-ore, copper and precious metals all falling, could this be the trigger?
Cheers
Mat
Did I say that? Maybe you can point me at what I said to refresh my memory. But… commodities are falling, dollar rising, leading indicators falling, deflation is in charge. The levitation in equities reminds me of commodities in H1 2008 where commodities were at record highs despite falling equities and leading indicators but then fell hard to join the rest. No guarantees but the set-up here is for equities to tumble hard to join the rest.
John, in reading ‘into your reviews over time’ in commodities and how their close relation to the development and ‘real value’ of stocks – rising and falling, I’ve interpreted this to be the case, specifically when you understand world indicators, supply and demand (a big one) and demographics, it all seems to fit into place.
Here in Aus, falling commodity prices is hitting the economy hard with Gov revenue falling, unemployment rising, consumer confidence the lowest in 5 years and credit getting easier and easier by the day. This is not good news for us.
Great blog by the way John.
Kind Regards,
Mat
Well, after looking at charts tonight, have to say, looks like we want to rally very soon, led by Energy and……Emerging Markets??? Yikes!!
Or…….we’re about to fall off a cliff…
My vote is….Nicolas gets to shine for a brief amount of time….. 🙂
And ~then~ maybe we fall off a cliff…
That aside, trading system is 50% short… Looking to add to that on a rally…
GL
Richard – A nice pop in Sugar today…
Maybe the start of that move you are looking for??
Har, har, har, I am surprised anyone remembered that two weeks ago, today, I said that the low for Sugar would be in for many years to come. I was only off by two weeks and a little in price; I am still long World Sugar futures.
Nothing has changed my opinion that over the next two years the best money making markets will be short US stocks and long World Sugar futures (Sugar #11).
http://www.agrimoney.com/news/marex-foresees-delayed-sugar-rally-as-it-launches-physical-trading–7831.html
Here is a better report on World Sugar futures that occurred today:
http://www.agrimoney.com/marketreport/pm-markets-brazil-dryness-worries-boost-sugar-coffee-soy–2953.html
I prefer Stevia.
Commodities are in a lomg term bear mkt. Sugar looks washed out, but Gann said it is never too late to short or go long. The last major bear mkt in sugar lasted 55 months. This one is 47. Yes, it could be early, but thre is no base at all.
I had services from EWI for two years over ten years ago. Ellioticians live for “third of a third” waves and have wet dreams of “third of a third of a third” waves. I count World Sugar futures as having made a very large Elliot wave 1 completed in Feb, 2010 and a larger A-B-C correction lower over four years that end Sep, 2014, with a 2 wave. The wave up from Sep, 2014 to Oct, 2014, on daily Continuation charts, was a 1 wave up with another A-B-C correction lower that ended in the next level 2 wave that ended yesterday. That means that World Sugar is now in an Elliot “third of a third” wave higher. Personally, I think that another 1st wave higher is underway that will top and correct lower in another A-B-C or 2 wave lower that will bottom this summer and take off in the much coveted Elliot “third of a third of a third” wave higher to new all time highs.
On daily continuation charts from last September’s rally put on fibo retracements and compare (two separate daily charts) to March, 2015, daily futures down trend line for seven months of the highs that then became support. Also notice the daily 5 wave count from 11/25 to yesterday and the hourly 5 wave count from 12/22 to yesterday. In other words it ended with a 5 of a 5 of a C of a 2 which is exactly what Ellioticians look for to confirm that the correction is over.
So are you buying futures or something like SGG or CANE
I am long Sugar #11 futures which is also called World Sugar futures. A seasonal high is due in Jan/Feb which is caused by highs in the Brazilian Real which is caused by the shift in world buying of Soybeans from NA to SA. Sugar is the second largest export of Brazil and Soybeans is the largest.
Last week’s CFTC report showed Large Specs just shy of all time record net shorts. Between Tuesday’s close of last week and this Monday those Large Specs probably reached new all time net shorts and reversed by yesterday’s close so that this week’s CFTC report won’t show them at new all time net shorts (called Tuesday Turn Around). In a few days the largest of the Large Specs known as Index Funds are expected to reposition based on Yearly Bar Charts and that points to going from extremely short World Sugar futures to extremely long World Sugar futures.
The recent drought in California was a five year drought. Last year’s drought in SA was the worst in memory. The supposed mild El Nino in the second half of 2014 may have only masked the fact that the Drought is a two year Drought that is starting to reassert itself just like it did last year at this same time period.
Yes, the $ is in a 3 of a 3 of a 3!
2015, top of the tops, bottom of the bottoms? The admin is very consistent
Buying some yahoo calls
http://unbiasedswingtrades.blogspot.com/2015/01/yahoo-getting-long-february-50-calls.html
Will probably take profit on half based on triangle targets, then add more March calls with said profits. Wave 2 zigzag so wave 4 probably triangle or something. Wave 4 fib time ratios point to net couple days for a low.
Indices probably finishing wave ii’s down with third waves up to come. Watch out shorts.
Took a beating buying last Friday though…..poor me.
We likely gonna crash. FWIW.
After Tuesday’s selling, CBI and various other indicators still neutral. Don’t see compelling evidence for stocks to rally here. Crude still falling – but sentiment and oversold readings at such extremes mean it can bounce at any time.
Ditto on my end. I am not getting any strong bottoming signals.
Gary RE bears…….markets make you earn your conviction, they don’t just give it away.
I am certain John knows what I mean.
Cheers
The greater the potential rewards, the harder it makes you work, ie. those that are first to identify the changing long term trend will reap the greatest returns but they are also tested the most.
Having the courage to stick with one’s conviction is an admirable quality, but it does not guarantee success in the markets:
“Everything happened as I had forseen. I was dead right and – I lost every cent I had. I was wiped out by something that was unusual” – Livermore.
We are now witnessing something unusual, aren’t we?
Mark, what I think is unusual is what John has pointed out many times and that is the demographic circumstances we find ourselves in. How many of us truly understand what an aging world population means for economies and markets having never lived through such a period?
Central bankers have propped up markets since the financial crisis but they can’t forever. They must be terrified of the leverage that’s built up in the system as their policies have effectively forced investors to reach for yield with companies understandably leveraging up as well. (By the way, the right policy coming out of 2008, but if taken to extremes compounds an already problematic situation.)
This is, potentially, the catastrophic scenario: overlevered economic actors meeting a secular low demand world with no way to pay off their debts. At a minimum, there will have to be a period of adjustment.
Agreed about the demographic circumstances Gary; but I wonder with diligent work such as John’s having now been widely published, has it been priced into the markets to some degree already?
What has definately not been priced in, is a solar cycle the likes of which none of us has lived through before – and coinciding with the oncoming lunar standstill (panic, according to Gann’s Financial Timetable). And all of that modulated to the maximum by the tetrad (this is not just hocus-pocus, there are physical reasons why it will continue to exaggerate the effects of the solar max). 5 January 2015 was the exact centre point of the tetrad.
If there is a connection between solar activity and human behaviour, then the circumstances we will continue to face for the next year or so are more disruptive than 1929 or 2000.
But I think this quotation is not related to sticking to one’s conviction or being wrong about the market. At that time Livermore was right about the market, but wiped out through betting on out-of-date prices caused by the speed of moving prices. Also because of the major defect in his system (he never said it was a defect, and I read nowhere it was a defect, but I believe it was) : too big the size. Jesse had an ever growing stake depending on how much margin he had, so that 4 consecutive losses meant he was wiped out. 4 losses in a row do happen to all successful traders. His size rules made him make money parabolically, but a few losses meant he had to start anew. Sticking to one’s own convictions is essential for any kind of success of life, but sticking stubbornly to one’s losing position and market bias while no one else than mr Market is telling NO WAY! is a way to lose one’s shirt.
What is the difference between sticking to one’s convictions and being stubborn? I stick to my convictions, you are stubborn. A joke, but wisdom as well.
This is laughable. Chinese 4 th qtr GDP may slow to 7.2%. Oh yeah and that is why the PBoC see fit to loosen monetary policy.
7.2%…. they wish. Commodities would not be collapsing if GDP were 7.2%.!
Do people actually believe this garbage?
http://finance.yahoo.com/news/china-fourth-quarter-gdp-growth-064125057.html
Sadly it’s what the markets use as ‘data’, Allan.
No need to be so cynical. You know. The poor (majority) Chinese need to eat! It is all about Job creations. Stability make China a better neighbor, a better member of the world?.. or would you rather see China with a GDP of -50? LOL.
Newt, what are you going on about, you seem to be wanting to spur a confrontation?
Anyways, I hardly begrudge anyone a life, it’s about sticking to the true figures not the made up garbage that tjey want us to hear. Anyone with an ounce of grey matter can work out that Chinese GDP is nowhere near 7.2%. if it were basic commodities wouldn’t be plummeting.
G3 geomagnetic storm in progress = strong
That and support at 100 day ma again.
strong geomagnetism = weak stock market
weak geomagnetism = strong stock market???
John, is this correct? tia
Approx yes
thanks!
the only thing of value I can add here is what is common knowledge among experienced traders…. my most archived setup is an ABCD THAT COMPLETES IN 382/447 BOX… 90%of the time in my archived examples price will take out the top of the pattern… if I know that so do other experienced traders….. thus the reluctance to push price lower at yesterday’s lows and the subsequent short covering..
http://stockcharts.com/h-sc/ui?s=$INDU&p=D&yr=1&mn=1&dy=21&id=p37237207721&a=371414188&r=1420640072782&cmd=print
fas
http://stockcharts.com/h-sc/ui?s=FAS&p=60&yr=0&mn=3&dy=23&id=p49309072396&a=323848062&r=1420640787751&cmd=print
it may have puzzled some traders why the IBB did not break lower with the rest of the market in the recent decline…. experienced traders saw a completed ABCD into 382/447 box in mid December, knew the odds of it taking out the top of pattern and found better short opportunities elsewhere…
http://stockcharts.com/h-sc/ui?s=IBB&p=60&yr=0&mn=3&dy=19&id=p88053212070&a=381564806&r=1420640877307&cmd=print
Hi Slater9
If I understand correctly then this pattern predicts a new ATH in the Dow?
Thanks
I read it more as a back-test up towards the fork-line at 18000 might be expected, ~then~ we see what happens, but certainly Slater would have the final word on his own charting here…
YES..here is how day traders used the setup today in TNA
http://stockcharts.com/h-sc/ui?s=TNA&p=5&yr=0&mn=0&dy=2&id=p62500167880&a=326441308&r=1420681690433&cmd=print
early in this section I posted ”chart” showing back to back trades triggered by the best trade trigger I have and which I had shown here twice before…. that is a very rare thing to happen… sometimes wait a month to get that exact signal….but note;;; the long signal on DEC16 came after completion of ABCD into 382/447 box..
http://stockcharts.com/h-sc/ui?s=TNA&p=60&yr=0&mn=1&dy=18&id=p50819894058&a=326760386&r=1420682756829&cmd=print
Look at $NYLOW, currently drops to only 29 from yesterday’s close at 159. Back test it and ask if you would want to add or hold your shorts.
While you are at it. Look at $NYADV as well and back test.
What conclusions can you draw?
The market can strengthen or weaken from here.
Bias ruins your pocket. Never predict.
For many days the 12 hr ma supported Crude to the downside but today it broke above, fell back and found support, and is rallying; thus, stocks are rallying too especially with stocks supported by their 100 day ma.
Bottoming is a process just like topping(much much harder to call and I have to learn more amd more) . I am looking for higher lows in the breadth indicators to indicate a bottom. At this point, adding shorts does not make sense.
Jesse Livermore said something like”…take advantage of a serendipitous act of good luck…”.
Years ago, I watched how the Chinese crossed the street (safety) and made the wonderful connection to the market…..and I nailed every bottoms since.
.
Newt this ‘Chinese street crossing’ sounds intriguing. Please share more. Thx.
Bottoming definitely hasn’t been a process in the indices for a few years. All the bottoms have been “V” shaped. I think bottoms are much easier to pick than tops.
With only a few people stepping off the curb, they don’t dare to cross the street being afraid of the fast on-coming traffic coming at them at 90 mph.
One by one, people assemble into a a big mass, they now have courage to start inching toward the middle of the street, and the cars start to crawl to a stop. With that mass psychology, people can safety cross the street safety no matter how wide.
Study your $NYADV well and become an expert in conjunction with other indicators.
I have just stuff money in your pocket. LOL.
Also, think of the Beach at Normandy versus the Dunkirk. What were the difference?
Newt thanks for the Chinese crossing info. So I guess you are a trend follower rather than a contrarian? Not quite sure how that translates to your nailing every bottom.
Once I’ve had the opportunity to ‘count the money’ I’ll remember to send you a thank you note. 🙂
broken uptrend trend channel from June retest in $/y in progress. Normal correction to 108 to 111 in order. $ index closing in on heavy fibonaccis around 93.
Once complete downtrend in stocks may resume
Euro yen working its way through horizontal support around 141.25. If it can break below it then Financials should continue to lead the downside as seen the last couple of days.
2nd chance in progress today
Yen breaking from bull flag – this 3rd wave targets 110.5-111
Well it didn’t take long for some EU QE news to come up and send markets flying back up. Makes little sense as Euro/Dollar seems to have already started pricing in the QE so this may be a dead cat bounce. I am not shorting as I have been burnt the last 5 times I tried to short a day like this! Wouldn’t be surprised to see a rise back to 18k on dow but hope it doesn’t happen.
us dollar
does 11 years mean anything?
are bulls always right?
FED sees strong dollar as temporary:
http://www.cnbc.com/id/102318510?__source=yahoo%7Cfinance%7Cheadline%7Cheadline%7Cstory&par=yahoo&doc=102318510
FED worried about strong dollar:
http://www.marketwatch.com/story/the-dollar-on-a-hurricane-path-of-destruction-may-be-about-to-fall-2015-01-07?siteid=yhoof2
Sub prime was contained as well.
going back to 1972 few areas in the DX ($ index) chart have been important lateral support/resistance as has been the 92/93 level – 1973, 75, 78, 81, 97,98/2003 and 2005. Maybe can add 2015 to the list.
http://www.tradingeconomics.com/united-states/currency
It really looks more like the middle of the predominant trading range during that period. It had forays to 165 and 130.
wall/stack
one thing I do for my own trading is track about 100 stocks and etf’s
based on wall/stack..A wall occurs when 90% hit support or resistance in a short period of time as in” price has hit the wall” a stack occurs when 90% have recognizable trade triggers in a short period of time as in” the market is stacked” they do not always happen together…. what is remarkable is that they did come together at the mid December low and the late December high and price moved sharply both times…
This scenario in this article makes a lot of sense to me.
What types of solar, cosmic or astrological configurations do you think would help to contribute to this predicted 2015 Minsky melt-up top?
http://www.safehaven.com/article/36299/positioning-our-m-top
Thanks everyone, new post js out