

1. Topping thrusts compared:
 Source: Stockcharts
That 4th chart now stands at 52 days and 15%, so ripe for conclusion.
2. Skew:

Source: Dana Lyons
Skew is still in the elevated range warning of potential large move.
3. Put/Call:

Source: Dana Lyons
Mirrors previous topping processes.
4. Sornette Bubble:

Source: Financial Crisis Observatory
SP500 bubble end still showing as start of July.
5. Sunspots:
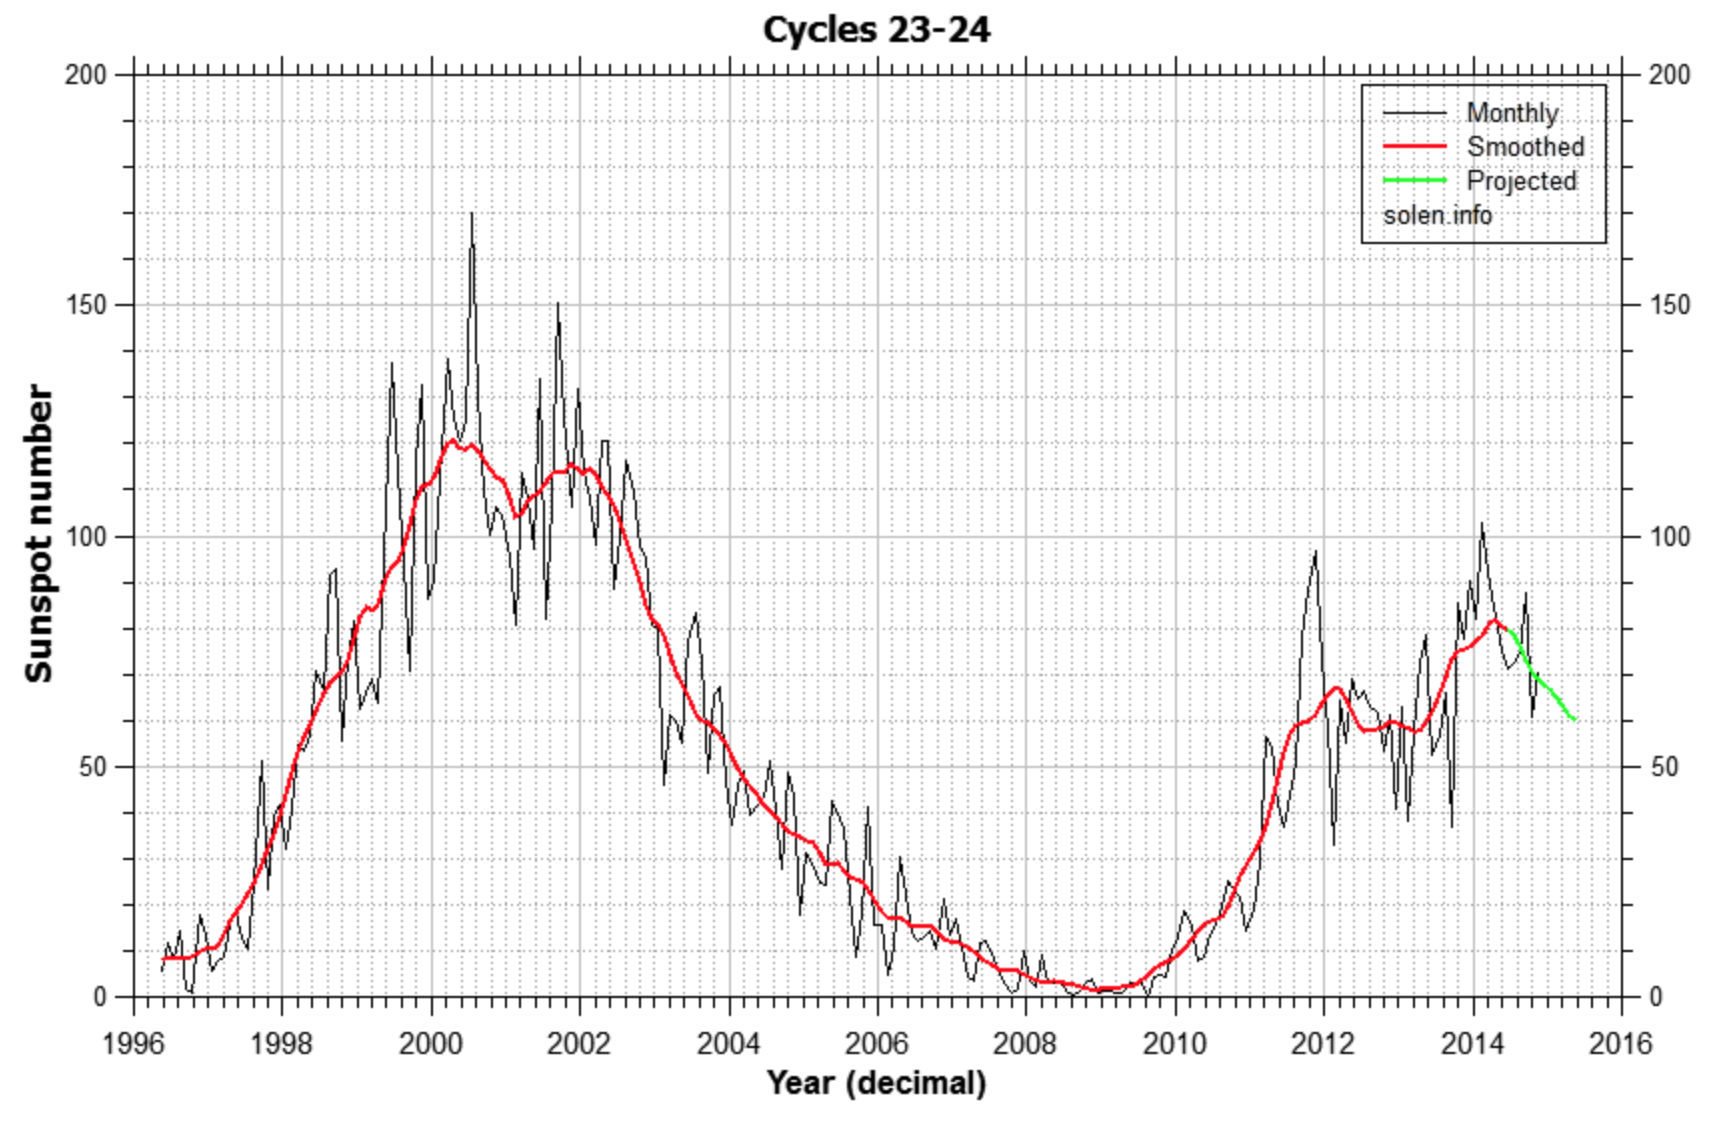
Source: Solen Source: SIDC
Both sources, plus IPS additionally, show the smoothed solar maximum behind us in April 2014 with a value of around 82.
6. Gold and gold miners sentiment still at contrarian depressed levels:

7. US Dollar still ripe for a reversal:
 Summing up, the picture painted by these indicators is consistent with my last post, namely that stocks have been in a topping process in 2014, that the solar max and speculation peak is behind us, that the effective peak in stocks was end June / start July 2014 and that stocks are still set for a big move to the downside. Plus, fortunes in the US dollar and gold/miners should reverse, fitting with the reversal in stocks.
Recall the 1989 solar/stocks peak. The solar max was July 1989 and stocks (Nikkei) stretched upwards until the end of December 1989 before finally topping out and falling. However, note the new moon then was 28 Dec, providing an additional optimism peak. Here at the turn of 2014/2015 the new moons are 22 Dec 2014 and 20 Jan 2015.

Re impact of falling oil price and rising dollar: earnings growth rate for Q4 estimated now at 2.6%, down from 8.4% on Sept 30th.
Commodities and stock market also have reasonable correlation, around 30%. Right now, Global Growth Barometer is off the cliff:
http://dv-dend.blogspot.com/2014/12/global-growth-barometer-signaling.html
Volatility is on the rise. I expect Central banks to try and prevent what is coming with a mighty effort. We will see violent swings both up and down. Eventually we resolve much lower.
Thank you for the update John. Being that stocks went down this last week – a Santa Claus rally week is not a good sign for the bulls.
Thanks John. I fail to see how folks are calling you wrong? As far as I can tell your calls based upon many metrics are either correct or the jury is still undecided on a few.
As for those that are still comparing now to 2000 as being justification for further advances?……….My God
The DOW and Rusty have exceeded their 2000 highs in nominal and inflationary terms. The SPX was a mere 80 pts away and as far as the Naz goes, well that blow off in 2000 was a once in several lifetime event.
This market is, no doubt in my mind, the second most overvalued in history and may, depending how you look at it, be THE most overvalued in history due to the participation in the bubble compared to 2000 which was largely due to dot com.
Cheers
Brian to follow on from your last on the previous thread.
You can’t compare now to 08 OR 29. You are comparing apples to oranges to do so.
Gold stocks rallied very significantly into 1929 and 2007/8. In fact in the 20’s Homestake rallied over over 600% and participated in the stock bubble.
Gold stocks this time have been hammered just as they wete during the dot com bubble and now offer the only value sector in the whole economy and that includes RE, art and antiquities and every asset you can mention.
There is no doubt in my mind that gold and gold stocks are set to explode in the years ahead as capital is destroyed and looks for the only safe haven available.
You only have to look at recent price action over the last several months to see what has been happening to gold and gold stocks on general market weakness.
Every time the markets selloff gold jumps as do gold stocks. As soon as the market regains itself the goldies rise is halted.
However they are making higher lows against higher highs for the general markets.as soon as they go big time down, the gold sector will explode.
Cheers
John what ABOUT THE BULLISH FACTORS, rut for one breaking out ATH`s its leading indicator
Price is bullish in certain indices, beyond that I see precious little. The case is still overwhelmingly bearish, so I can’t shift from that stance.
big bearish wedge on dow daily chart
I thought the Chinese were more astute than the West. It appears they are no different to us.
Another disaster in the making. The Chinese economy is slowing far faster than anyone thought and so invetors pile into the stock market. Of course it is stimulus driven but……
Got me stuffed???!……..I must have it completely upside down! A fast weakening economy in this day and age is now uber bullish for stocks!!!……..how silly of me.
http://stockcharts.com/h-sc/ui?s=$SSEC&p=W&b=5&g=0&id=p25366566358
Allan, to follow on from the previous thread regarding Jeff Kern:
Has Dr. Kern mentioned anything about his “Death Run Top” analysis for the general markets as it WAS triggered last week in the S&P? Possible caveat being that the critical sixth down day was the shortened Christmas Eve trading day.
Thanks.
Mate as far as I know there was no mention of it as it was not triggered. Ie 2 down followed by 5 up of more than 10% but I will ask.
Cheers
Allan, it’s NOT for gold but a different indicator altogether of his for the general market. Five days up, exactly, with the five day average gain 1% or more per day. Sixth day MUST be down, by any amount. Five days up, exactly, no more or no less, sixth down and a 5% or more gain for the five up days. I used to subscribe and he warned of an impending trigger last year (May 7th – May 8th) that did not play out. Works just the opposite for a market bottom, “Life Run Bottom” he calls them. Thanks Allan.
FED or CB’s pouring money into a weak economy is the essence of bullish and always has been. The exception is a deflationary spiral -5% or more deflation which I think will be announced when the PPI comes out this month.
Blue .. eventually we resolve much lower ..
of course we do, in the next bear market.
They have not been abolished.
Big upward move in the $ this AM.
In the last big $ up move, 1981, it gained 30 points (85 to 115) in nine months. It has gone up 11 points in @ 6 months this time. This move should actually be bigger as it is coming out of a larger decline and base.
The only thing I am certain of is extreme volatility. Take today for example.
Allan, betting on stimulus has become the norm – not sure why you necessarily think that the Chinese are buying any more than us in the West? As far as I know we all have access to the Chinese market….?
J
js, not sure why you think that it would be us given that the run began on cue with Chinese stimulus? Sure we may have climbed onboard to extent but PBoC has been the driver and continues to be so. If they announced tightening then I can assure you it would reverse hard, which is inveitable at some point regardless.
However my point anyway was that the SSEC has increased 60% in 6 months and that is about as absurd as it can get for a major market on the back of economic numbers that are declining.
It shows how completely out of touch investing has become with reality in every single market globally.
China’s big debt problem lies in its private sector while Public Debt level is fine. Given the significantly high level of interest rate, its CB has plenty of ammo to stimulate as the economy softens and threaten livelihood. Confucius says “people need to eat”.
Traders are taking full advantage of a stimulus, No different than traders’ reaction to QEs.
Bernanke actually wrote an article why stimulus works, The Monetary Accelerator Model. When the economy goes into recession the FED floods the economy with money. Since demand for money is low in a recession, the new money is forced into bonds thereby pushing interest rates lower. The lower rates then make investors look for higher returns so they go into stocks and real estate. This causes a wealth effect consumption boom and historically this begins a self sustaining recovery. This has worked in spades for stocks over the last 5 years, but huge debt levels has mitigated a self sustaining recover. Hamilton Bolton of the Bank Credit Analyst was the first market prognosticator to see the connection of bank credit expansion and the economy and stock market. He is one of only 6 people with a long record of predicting bull and bear markets correctly.
Yes, I think we are both saying that the Chinese market is like any other in the world right now?
Thank you john,
JH I know what you’re saying but I have not seen mention of it nor can I see how it would have triggered in the SPX?
I can not see a 2 down 5 up run as you suggest. It would be possible to get that know though on 5 up days to new highs next week.
http://stockcharts.com/h-sc/ui?s=$SPX&p=D&b=5&g=0&id=p07168841399
Cheers
Allan, better yet, I’ll provide Jeff Kern’s own words from his missive of 07 March 13 describing his “Death Run Top” trigger in the general market, different from gold stocks (USERX). To wit:
NOTE: The general stock market rose for the 4th consecutive day to a new multi-year high. The 4-day rise has yielded a gain of 3.7%. That’s about a .9% rise per day. A Death Run top in the general stock market requires exactly 5 consecutive daily rises that average 1+% per day. Therefore, Jeff is just reporting that a Death Run top could occur if the general stock market rises at least 1.3% tomorrow and then declines the next day. Jeff is not predicting that will happen, but the set-up IS occurring.
Best Wishes, Jeff (5/7/13)
From the very chart you provided the S&P was up five straight days (Dec 17 – Dec 23) over 5%, then down on Dec 24th. There is no “2 down” with THIS indicator of his. That is a gold indicator (USERX), not for the general market. Five up (total 5% or greater) with the sixth day down. The caveat is, however, the short trading day on the Dec 24.
I don’t want to turn this thread into a “Jeff Kern-fest”. And he probably would have mentioned it to subscribers if it had in fact triggered. It did trigger actually (as it did in say, August 1987) on the dates above but not the DJIA or NASDAQ that day. FWIW.
JH, I don’t like to quote Jeff outside of what is said in forum or to subscribers, I hope you can understand and respect that.
Jeff provides updates as you know on 321 but it would be disrespecful of me to divulge too much more.
Cheers
Hi Allan. I can understand your concern about not wanting to expand on Jeff’s work here. I really can. But look at your LONG post(s) in the prior thread describing his system. They were rather extensive and that is simply why I wanted to ask you if he had identified a “Death Run Top” in the GENERAL MARKET. Look at my FIRST questions to you. Short and pretty generic. I had thought as long time subscriber you might be familiar with his GENERAL MARKET analysis too. The reason I finally quoted Jeff regarding a GENERAL MARKET Death Run Top is that my own words were not apparently communicating what a GENERAL MARKET Death Run Top was…..so I used Jeff’s own words in an attempt to delineate the distinction. And as a long time subscriber, I thought that might jog your memory away from the “2 down 5 up” run pattern that has nothing to do with the general market. Just USERX. I’m still not sure I’ve gotten it across…..the question that is. But it doesn’t matter. I think I’ll just re-subscribe to find out. Less painful.
Assuming your Aussie, I can’t help be reminded of the George Bernard Shaw quote that “England and America are two countries separated by a common language”. Methinks it applies to Australia and America as well……:).
my posts are not showing up. John, have you switched over to moderating the posts before they appear?
They’re not in pending authorisation, I don’t see them
nevermind… :-\
Robbie,
One last try (after a few attempts to post this), maybe the link was messing up this post. I changed it to make it look like it’s not a link. You’ll need to rewrite it into correct web address structure by changing “DOT” to a period and removing spaces.
For a different view on the RUT “breakout”, check out this guy’s RUT chart, especially his comments. He has a long term rising resistance line that the RUT has tested 9 times and still has not broken above it. His view is that is very bearish and may be indicative that the RUT will not break above that resistance for a long time, maybe never.
www DOT tradingchannels DOT co DOT uk
I hope no one is too short the $.
Nice fall in the RUT today for those short,
following the recent strong run.
The consensus on equities appears hugely bullish atm.
not sure it’s going to be quite so easy on the long side in ’15.
I’m seeing that too (regarding bullish consensus). Is that your opinion or are you basing that on a particular survey?
Market internal has not weaken to the point where it becomes favorable for shorting.
Interesting that oil stocks are the source of support today despite lower oil price.
Adding to my swing longs at SPX 2053. Currently have longs at 2020 and 2040. Target – new ATH.
Got any stops? Have a feeling the powers at large will drop all the main markets 3-5% in the next couple of weeks to force European QE which will send markets to ATHs. Will be a nice earner for the institutions that create the drop and buy for the recovery. Have a feeling Draghi will just delay QE until the markets force him into it…
I like that line of thinking Krish. Draghi certainly needs a big enough ‘excuse’ to convince the Germans to allow him to play.
I wonder though… The Germans apparently don’t want anything to do with QE. (Weimar!!) Will they care about a stock market drop? Or will it take something more concrete, like rising unemployment in Germany?
Yes pimaC you may be right. Until it hurts the German voters enough to rattle their politicos Ms Merkel may not allow it.
Aah the games that are being played. Lets wait and see.
Stop 2020
Looking for weakness into middle of month based upon lack of Lunar Edge (full plus four to new plus four days), seasonals weak, apogee coming mid month, and declination heading south from here. Looking for a respite when moon crosses equator mid month but that will only last 2 to 3 days. Good shorting opportunity but only if price confirms assumption.
I am trading only the R2K or SPY right now, GDXJ or a variety of other trades may have totally different response to lunar factors.
Fifth year of decades have been strong last century. Maybe 2015 will not follow the fifth year pattern.
Hi John,
A huge coronal hole on the southern surface of the sun is now facing earth again. It 1st appeared and was facing earth in October and rotated away in November.
This is not my expertise but I thought you would be interested in the article:
http://www.dailymail.co.uk/sciencetech/article-2894840/Mystery-sun-s-south-pole-Nasa-reveals-huge-coronal-hole-solar-surface-winds-jet-500-miles-SECOND.html
“The sunspot, previously known as Active Region 12192, began facing Earth in October but did not produce any coronal mass ejection (CMEs).”
“CMEs are the most energetic events in our solar system, involving huge bubbles of plasma and magnetic fields being spewed from the sun’s surface into space.”
“The region, renamed Active Region 12192, has now rotated around to face Earth again, and is likely to create CMEs, Nasa scientist Holly Gilbert told Space.com during a video interview.”
‘This time around, it’s more likely to have some coronal mass ejections associated with it, even though the solar flares might be smaller,’ she said.
‘We have a good idea, based on the structure of that magnetic field and the sunspot, that it’s very possible that it will create some mid-level flares.’
“Magnetic fields in sunspots can store vast amounts of energy, but looping magnetic field lines can get tangled up and snap, releasing their energy as explosions called flares. ”
“According to Dr Gilbert, the sunspot is still large enough for 10 Earths to fit inside it, and is believed to be the 33rd largest of 32,908 active regions recorded since 1874.”
Read more: http://www.dailymail.co.uk/sciencetech/article-2894840/Mystery-sun-s-south-pole-Nasa-reveals-huge-coronal-hole-solar-surface-winds-jet-500-miles-SECOND.html#ixzz3NipMlqMw
Follow us: @MailOnline on Twitter | DailyMail on Facebook
Thanks, geomagnetism occurring from it
I think indicators are telling the truth, but the stock holders are a different crowd this time around? There is nothing to compell selling. I mentioned before they won’t sell shares, issue or split alternate shares until interest rates rise enough that assuming they didn’t get fixed rates on loans to buy back shares, they’ll pay the interest until a threshold is crossed. I previously mentioned that threshold may be a revenue gap? I am starting to believe the next three years as status quo. Interest rates rising for the consumer against demographic induced deflation will be a new one for the central banks. If rate increases in the Bernake era are any guide, the playbook will be similar. Each year that goes by we got more folks qualified to retire, but that rely on the market.
I see DOW 19,000 in 2015. SPX 2200.
Basically it all boils down to what the black swan or trigger will be, but interest rates and bonds are apt to play a role for sure. Rising oil eventually will also be a play once a short term loss assists to a long term gain.
How does this play into solar cycles?
I stick with my framework: solar max April 2014, effective stocks peak June/July 2014, no trigger/swan.
Duncan,
Your previous comment on bears having their opportunity
last October is thought provoking.
And I think the answer to why that downside move
was not capitalised on is the momentum
in the US economy, that for me was and continues to be
the major bullish factor.
While I appreciate US earnings growth is slowing,
mean earnings still continue to move ahead.
We are towards the end of this process,
another 6 months approx continues to be
my estimate.
I think we are both in agreement that new high lie ahead in 2015. Infact im positioned long at the moment for new highs very soon.
I would say, however, there is a strong chance the Santa Rally (last 5 days of 2014 and first two days) will end negative. Bad Santa! But good indication that this year will mean volatility.
wx, yields are still falling.
The US 10 year may be below 2% within the next
few weeks.
I spent my holidays time asking where are we on the John Templeton stages? I concluded that we are still half way onto optimism from skepticism since the world is still fighting worries from deflation to global nil growth …. In 2000, my neighbor asked me how could I not own CSCO at $82? these days, only very rarely would anyone care to discuss stocks with me. The market has yet to mature let alone being euphoric.
I am right as long as CBs are accommodating. I would be wrong when Yellen starts to spank the bulls hard by raising interest rate repeatedly. Until then, BTFD and these dips should be shallow.
When should I exit my SPX 1,450 objective and when the bears start to control the market? Watching if price would fall below SPX 320 SMA (currently at 1,896) and fails to recapture quickly.
John will be right and be rewarded handsomely. Patience.
LOL Newt you did WHAT!?!?
‘I spent my holidays time asking where are we on the John Templeton stages? ‘
For the record I DID read the posts here …twice but other than that I was suitably inebriated as the season required!!
Newt hats off to you for ‘commitment’!!
I have a vet HAZY recollection of my holidays and I’m very grateful for that.
very hazy
2015 outlook –
Long term scenarios on the Dow; 2015 – decennial pattern, presidential cycle; intermediate term tracking scenarios on SP500
http://market-timing-update.blogspot.com/2015/01/mtu-weekend-ed-2015-outlook-1215-close.html
I was hoping your 10/17/2014 entry gave a firm conclusion that the bottom was in.
According to Jeffrey Hirsch of Stock Traders Almanac we may be soon going to be entering into a “super cycle” of stock price rise akin to 1983 to 1999. The fuel for this unlikely event may be the “anti fuel” development where energy becomes cheaper and cheaper due to hydrogen fuel cell technology and highly conductive non metallic wiring. While this seems somewhat out of sync with current cycle, the last 15 years have not been very kind to stock investors and his analysis points to recurring cycles of 15 years flat and 15 years way up. I am planning on trading whatever comes based upon seasonals and lunar/solar patterns but imo the possibility exists that the market may go multiples higher over the next decade.
Just one huge problem with that. Where does that leave valuations given that we are already at overstretched levels?
I am always sceptical of “to da moon” callers and rightly so as history has not been kind to them.
Cheers
Allan, I agree about valuations. However, as I posted in the last thread, the perfect setup for bears was October last year. There was a beautiful rising wedge, QE switch off, a few months after margin debt peaked but bears couldnt even manage a double digut decline.
Some are calling for a market going to the moon and others a mother of all crashes. My personal belief is that this secular bear has run for long enough. But you cant ignore the fact that the US is very strong right now. Perhaps europe and china can bring it down or maybe some something not many people have been discussing – a boring sideways chop market for serveral years.
Duncan, it is a fact that the US is very weak now, and has been for several years. Recession lies dead ahead.
You appear to believe the words you might hear from Yellen et al, but she is telling you lies. The credit markets (in America) have already realised by the way. Stocks are remaining elevated because it always tends to be the least sophisticated of markets. The cycle is cycling, and down will be the direction, for stocks too.
There are dozens of articles at the following site that will better inform anyone that is interested (won’t help with your trading), so that at least you will be dealing with facts rather than fiction:
http://www.alhambrapartners.com/2015/01/02/only-stocks-are-left-minding-the-recovery/
Here is Suspicious Observer on Solar Flares and Weather Alert https://www.youtube.com/watch?v=OLi3sLVf6dU
Here is another video he did on 10 Spectacular Solar Eruptions. This 5 min. video is worth watching. Quite spectacular https://www.youtube.com/watch?v=1qBwmgAnMWQ
Betafish,
While I can see considerably higher equity
levels on a longer term view – 15 years plus,
significantly higher levels with in this bull market
look remote imv.
PER’s are already on the high side, profits as a %
of GDP already at or near historic highs – so I do
not see the catalyst within this bull market.
I can see another 10-12% on the SPX, very approximately
before the next bear cycle begins, anything above that
looks unlikely IMV.
Another 10-12% higher would be right towards
the top end of how I see this developing,
as always this is merely my best estimate.
fionamargaret over on Caldaro’s blog posted this very long term look at the US stock market in “real dollars” going all the way back to 1790. The conclusion is that we’re above channel resistance and every time we’ve been this high in the past, the correction that followed is severe. Food for though, but with long term charts like this, you have no idea of shorter term timing. Next week, next month, next year, several years out…? However, the expected severe correction fits well with John’s analysis.
http://www.amateur-investor.net/AII_Weekend_AnalysisJan_3_15.htm
Excellent and original charts in that article pimaCanyon.
The major market peaks in 1835 and 1853 coincided with SC7 and 9 maxima, but not in the way we’ve come to expect from the last few cycles:- although there was stocks speculation into each maximum it then accelerated from the solar max and continued well into the following minimum. This could be happening in SC24 (which is a similar weak cycle to SC7 and 9), as US stock prices have continued to increase since April 2014 (SSN max). If that continues as it did during SC7 and 9, then we would see stocks increasing for another 2 to 5 years.
So what could cause nominal stock prices to continue significantly higher, while keeping the “Real Dollars” value shown in those charts to fall behind and stay closer to the red line? Very high inflation could – caused by a loss of faith in western-style governments and their paper promises.
Regarding 1836 crash:
SC7 maximum was 1829-1831.
SC8 maximum was 1836-1837.
For the 1835-1836 market peak, did you mean SC8, and if so, it was well timed rather than early.
Regarding 1853 crash:
SC9 maximum was indeed 1848.
I believe that you are reading the 1853 crash from a Dow Jones Chart? — I myself have been wondering how accurate that chart is. If we follow the news on the Panic of 1847, this solar cycle would seem well timed as well.
http://en.wikipedia.org/wiki/Panic_of_1847
True, those very old Dow records are nowhere near as detailed as modern ones, although I personally have no doubt that they reasonably accurately reflect what was going on in those days. And there are many instances where sunspot maxima do not line up very well with market action – like the 1847 crash versus 1848 SC9 max you mention above (ie. speculation peaks do not necessarily always coincide with solar cycle maxima).
The point I’m trying to make now is this:
1 – the current SC24 is similar to SC7, 9 and 16 (weak cycles),
2 – anyone who shorted US stocks at SC7 max during late 1829 then watched the Dow rise from 11 to 24 (or thereabouts) over the following 5 or 6 years, without ever having a chance to get out at a profit or breakeven,
3 – anyone who shorted US stocks at SC9 max early 1848 then watched the Dow rise from 13 to 21 (or thereabouts) over the following 5 years, without ever having a chance to get out at a profit or breakeven,
4 – anyone who shorted US stocks at SC16 max around May 1928 then watched the Dow rise from 220 to 380 (or thereabouts) over the following 16 months, without ever having a chance to get out at a profit or breakeven,
5 – the same thing has been happening since SC24 SSN max during April 2014 – so far…
I agree, Mark, that merely using the sun gives a poor track record, especially because if it is off, the losses from shorting a mania are great. Hopefully, John H’s other indicators will help pinpoint somewhat.
I find that strong cycles can be off as well — no crash in 1960s.
Duncan, GM took the words right out of my mouth.
How is tne US strong? This is the weakest post recession recovery on record. Wages growth is still all but non-existant despite a very slight uptick last qtr.
Organic growth is non-existant and corporations continue to pile on debt whilst pursuing record buy backs to paint the illusion of growth.
primCanyon just provided a link to several charts that SHOULD offer a very clear and sobering reminder to the bullish camp.
I keep hearing from you “bulls” that the markets are going to make new all-time highs in 2015 but not ONE of you can provide really clear evidence and reasons to support WHY they should and can ignore history.
The fact is that history is bellowing quite definitively that markets are at a top and yet somehow I am expected to throw all that history has taught and look for higher markets………NO THANKS not me.
History says we are staring at a 60% decline from this level.
Would you buy the market if it drops 60%? how about a drop of 80% like the NASDAQ in 2002?
If I thought the market warranted buying YES I would buy it, just as I have been buying gold stocks for several months because I consider them value.
So what is your point?
Investing really is not that hard, in actual fact it is quite easy but why do so many find it hard?
I am buying gold stocks because they are cheap and nobody wants them in contrast to general stocks which are expensive and everyone wants and yet bulls keep telling me I am wrong for buying gold stocks and should be buying mainstream stocks………..go figure??!
My point is you may never find the market good enough to be bought because you have such an utter contempt for the market.
If you think the market is going 60% lower, would you be shocked that your gold stocks may go down just as hard as suggested by “history”? Lol.
Allan, im no permabull infact the higher we go the more bearish I become. The reason I point to a stronger US market economy is the material Chris Puplava puts out. I think a trader has to look at different points of view despite how compelling the bearish case looks.
You ask why im expecting new highs? Well the trend is up and price is above most moving averages. Especially the long term ones. Seasonality and the presidential cycle are other good reasons. Why are you expecting the market to tank 60%? Specifically from here and not later in the year? Ive played this market long and short
“but not ONE of you can provide really clear evidence and reasons to support WHY they should and can ignore history”.
While Allan was very convincing in his bearish talk all 2014 and wrong again and again. Allan is wrong most of the time and never learns, so much for his 30 years experience of what? 30 years of losing money or reading/writing about the markets? Like one Mike Loser Shedlock?
Linda Raschke who has been TRADING the market for 3 decades and making money says now : ‘the market may go higher than anybody thinks’.
The Bull is not over, I repeat myself, I said the same in December 2013; the market’s behavior in 2014 didn’t make me change my mind.
I had a great 2014 not only daytrading, but having long term trades as well. Where were you, Allan, when I wrote here a few months ago that I was long USD/JPY and China, hoping I had big fishes in my nets? Now you moan that China had gone up for no reason despite all logic…
I have increased my stake in January 2015 and had a winning first session last Friday. You think that if I cover my living expenses in one trading day, my mind will be flooded with risk aversion or go to sleep? Wrong. Today I analysed some markets and improved my system in 4 areas.
You don’t trade for a living but you surely are misleading others. You also do something else : you are one of my favorite contrarian indicators, so much that when I turned bullish on gold at some point in 2014 I felt uncomfortable to be in the same camp with you…
ps.
Asking and knowing WHY is good for journalists and all wannabes who will never trade for a living. Even in my first year of trading I didn’t ask why. And right at the start I noticed that those who write about the markets instead of trading are usually wrong. Something you don’t see after ’30 years’….
Hopefully my comment would be a shock therapy you badly need.
Allan, my mind is open to what lies ahead, two possible outcomes exist, but it takes an open mind and much thought to see which is the most likely.
Option 1 plays out much like 2007-09, with a standard conclusion to the secular bear, stocks down hard, a certain amount of printing/defence by the central banks, which proves ineffective. That would be the deflationary option.
Option 2 plays out like something we haven’t seen before (ever I believe), where the dollar-supporting central banks (Fed, BoJ, and BoE) along with some peripheral countries, go mad with printing, to the extent that money’s velocity starts to rapidly increase. We then will see a (potentially fairly quick) collapse in certain currencies, depending on how much they try to defend their living standards/size of government/deny reality. I have reached the conclusion that Japan will accidentally see the Yen lose 50-60% of its buying power, sterling something similar, whereas the US will print until the dollar goes full Zimbabwean, total collapse, and leading to a very turbulent period in the US, civil war maybe.
(Worth mentioning here that the Euro is the go to replacement for the USD, as for the first time ever, we have a currency truly managed to be stable, and disconnected from the voters, hence no risk of bailing out governments or lifestyles, the current position in the EZ is evidence of that already, don’t believe the media stories, believe your eyes). US-style QE will not happen in the EZ.
If I had to bet money (which I am via investing my own and client funds), it will be option 2, as there is little evidence that the governments that pull the strings of these US-centric central banks (and indeed the voters) will voluntarily go down the austerity route and slash (for example) pensions by 50% in nominal terms. The gravy train will run full tilt over the edge of the cliff. Other countries (Russia/China) may hasten the crash via gold operations/strategy.
So, I agree with you regarding gold/miners, already there with you. I will wait to diversify a little into the broad markets (hedged back to the Euro) until I see how central banks react, and if it looks like the hyper inflationary route is where we are headed, then trading stocks might make you all nice nominal gains, but if you’re not in the Eurozone, in real terms you will still be losing money, and in the US, potentially you’ll lose your shirt.
Hence, physical gold, as I keep repeating, not paper trades, are an essential hedge. One way or another, the debt overhang will be cleared.
I don’t have to give you reasons as to why stocks are going up. They are simply going higher until proven otherwise. Look at a price chart and you will see higher swing highs and higher swing lows in stocks. The strongest bull markets, be it in stocks or bonds or in grains or whatever, they don’t give you reasons as to why they are going up. They just keep plowing higher. Those are the strongest bull markets. Either you are long or you stand aside. But if you want to be a hero and pick the top of the stock market go ahead. A lot of people before you have tried to call the top in this stock market and the stock market just steam rollered over them.
Gravity indicates a low at the end 2017 with a perigee extreme nov 2016 and an apogee extreme in may 2019. So this indicates 2017 will be consolidating. But towards the end of 2016 I can see nothing to stop this.
The 5 december high was the orthodox high and basically we are down into end of march. An inversion period in december turned the downtrend up from dec 15th. This window closes soon. Short term we go up until january 13/14 before the down trend resumes.
After the march low a recovery into mid june and then down into december with a retrace from early july until sept 21.
That’s what gravity tells me and gravity was up from early 2009 until dec 2014.
And all the best for this new year for everybody.
I am agnostic about bull or bear outcome however the 1983 to 1999 bull market was probably the last thing expected by market participants in 1983. People weren’t using desktop computers or cell phones in 1983, nor were hydrogen fuel cells available. My belief is that an entire armada of new tech innovations are going to appear to most like out of nowhere and make transportation and energy usage much much more efficient and probably less expensive. Most of the cost driver for business activity is transport and energy. Less cost, more bottom line growth, lower price to earnings, high stock prices then can make sense.
Market has not had a bad fifth year like ever and this year will probably chop until the Venus retrograde in June and then zip higher. By the way, a fiat currency system as it is currently configured requires constant increase in money supply to pay off accumulated debt and workers wages need to increase at the same rate (higher minimum wages are present in most of the US). The stock market has to rise with this level of wage and price growth or it will lose its status as the most popular barometer of the economy’s well being. Higher stock prices even if nominal lead to contented and dedicated consumer investors. Most people don’t profit from falling prices and do not spend time on their portfolio.
I think I agree with most of what you’re saying here, in a VERY big-picture, long-term sense, although I think for most companies, they’d probably say labor is their greatest cost driver….
That said, regarding fiat currency, we’ve had a pretty good increase in the money supply for seemingly forever, and the stock market had a pretty tough 1987, 2000-2002, and 2008, regardless….
http://research.stlouisfed.org/fred2/series/M2/
And not saying we won’t see 20k, 50k, or even 100k DJIA at ~some point~ way down the road, but am saying that road can get kinda bumpy along the way sometimes…
And I think most who are currently bearish would tend to agree with that…
Whether now is a good time or not for a “bump in the road” to occur is open to debate, but to say (and it sounds like you are – correct me if I’m wrong) that most people don’t profit from falling prices, so the market won’t go down, seems kind of silly to me because:
A) the market doesn’t exist to create profits for most investors, and
B) even if it did, it’s done a pretty poor job of that from time to time…(i.e. the above listed years)…
Anyway, we’ll see, either way, in the fullness of time, but I’m just not seeing what would take the market much higher from here (~18k Dow)…
Point taken. I guess just because new technology is here, and energy maybe continuing to fall doesn’t mean the market has to climb. I am not sure myself what I meant by the reference to market prices being kept high to keep investors happy, though with the ubiquity of 401K plans most american workers measure their retirement by the value of the stock market where pre 1983 most had defined benefit plans which were not tied to stock market performance.
New tech: fuel cells, materials (graphene), drones, communications, high speed rail, medical (drugs, longevity research), manufacturing (robotic galore and 3D printing), aero-lighter faster more energy efficient.
I mentioned last week that the weakness in crude
may be an outlier for equities.
While it’s difficult to assess precise effects,
significantly lower crude adds to disposable incomes,
it reduces both production and distribution costs.
Whether it can further extend the current business cycle
by a meaningful amount of time remains to be seen.
Another reason to fear a melt up?
John Mauldin has just published one of the best articles I have seen on the potential effect of the rising dollar:
http://www.mauldineconomics.com/frontlinethoughts/why-the-world-needs-the-us-economy-to-struggle?utm_source=feedburner&utm_medium=feed&utm_campaign=Feed:+johnmauldin/newsletters+Mauldin+Newsletters
I will just highlight a few items to think about:
1. The Fed first raised rates last time in June 2004, the market rallied for three more years
2. The last crisis was preceded by a rapidly rising Yen/Usd and commodity prices, this time we have the reverse (bad for gold, sorry)
3. Last time the result was a stock market melt down, is it possible having the best house in a bad neighborhood (high debt to GDP) might result in a flight to safety or a stock market melt up? (my Q not JM/WW)
Newt, I have utter contempt for the market when it warrants utter contempt. The market is historically overvalued by just about every single measurement you want to look at. In fact it is abusrdly overvalued, thus my contempt.
The general assumption that gold stocks will plummet with the broader market is based upon completely unfounded and misguided research.
I will say it again, this time is akin to 2000 not 2007/08.
The gold sector will respond as such
To wit I say. How could you not have anything but contempt for markets that behave like this. Up another 4% today and over 60% in 6 months. Pure insanity.
http://stockcharts.com/h-sc/ui?s=$SSEC&p=W&b=5&g=0&id=p59900337318
BTW two things to pay attention to.
One, I said back in December that the big engulfing candle on AAPL was significant. i stand by that. AAPL looks decidedly shakey.
http://stockcharts.com/h-sc/ui?s=AAPL&p=D&b=5&g=0&id=p03878915835
Two, gold and gold stock strength despite new highs the last two days in the USD.
I am expecting USD to stay strong and this is key to all markets now. Therefore SPX should be at new ATH this week. My target for Yen is 124. Gold should finally succumb below last lows testing 1100 level. Major reversal in the markets seems to be pushed few weeks or even months away. Only if SPX and Yen move below December lows means that collapse is already in motion.
Although I suppose gold could break to new lows in the very short term, June of 2013’s low of $1179.40 remains the mathematical pivot point, as I’ve posted here before. Yes, those who suppress the gold price can push it below that level for brief periods, but they can’t keep it there.
They’re ramping the U.S. dollar for many reasons, but one of them is clearly to keep the gold price from breaking out in USD. If you look at the gold price in other currencies, however, you can see what’s really happening. Guess what outperformed every currency on the planet last year except for the U.S. dollar? I’ll give you a hint: It starts with the letter g.
Liquidity is drying up – so look below from here.
“Wow, They Really Are Tapering” http://www.safehaven.com/article/36267/wow-they-really-are-tapering
A sensible forecast of what the Greek elections portend: http://www.marketwatch.com/story/greek-stocks-are-a-great-buy-regardless-of-the-elections-2014-12-30
And welcome back John – good to have you back in the saddle again.
Thanks Gary
Mark, John Li, you can be assured that the records from those times are pretty good.
Quoting from a private letter from the Foundation For The Study Of Cycles:
“The only figures I have for this series are monthly–the details of the method of compilation are not included in any of the material in your library, but Leonard Ayres was highly regarded by his peers, and probably the data are as good as you can gest for that early period.”
The section of the index from 1831 to 1834 is based on the Cleveland Trust Company Index of Railroad Stock prices as prepared by Col.Ayres.
And despe906; maybe LBR has improved her trading over the years; but she also
lost a good bit of money for some folks back in the day.
Thanks eclectic. I agree with Mark that the Dow does not follow the sun in the 1800s, and therefore I am unsure of the quality of the data. However, my main point is that the US was not the financial center, and it makes more sense to look at Europe for crises, such as in the Panic of 1847. Do you have data from Europe? I couldn’t even find the chart for the Vienna crash of 1873.
Could you help me with the begin and end dates of the crash around 1832? I only know of the “Les Miserables” French Revolution.
Thanks eclectic. There are two even older examples from Europe (the financial centre at the time) – South Sea Company shares (and many other companies) increased from £128 to £1000 during the first half of 1720 AFTER the sunspot peak of 1718 (difficult to be exact with the sunspot numbers from then though). Also, the tulip bulb mania occured though 1936 into early 1637, at least a year BEFORE sunspots peaked.
Coming back into the 20th century, SC 23,22,21 and 17 saw speculation peaks coinciding with SSN peaks (SC20 too, but markets quickly went on to new highs, so nimble timing was required). Shorting (the appropriate market) at these SSN peaks was very profitable.
But in SC16,18 and 19 (as well as 7 and 9), shorting at the SSN peak was very costly.
There’s definately a connection between increased solar activity and heightened speculation, but the timing is about 50:50 when using the SSN peak alone.
Divergence between Euro and Yen is most significant in my view.
Hi all ! I am in great shape as we start 2015. I expect another tremendous year for longs. My recommendations are again QQQ, AAPL and IBB. You can also throw in a short on GDX or GDXJ. So, I am looking forward to another very easy year for me. I will keep you updated on my research.
Hi Nicolas;
Any chance you happened to read my note to you on Dec. 30th??
It’s a couple of blog posts ago, at the bottom, so you probably missed it, but I’d like to think it would be worth your time to read….
If you saw it and don’t care, that’s fine too, but didn’t want it to go by with you not having a chance to read it…
GL…
Hi Barry ! Sorry, i missed it the first time but I’ve just read it now. Very good post. Thank you.
My answer would be that the BOJ was focused mainly on the bond market and not really on stocks until recently. Also, the financial crises of 2008 changed everything. Now, the central banks act as a backstop and will not let stock markets go down. That’s why the BOJ is buying ETFs. The FED is probably doing the same thing secretly.
Well, okay then…. My work is done here…
Yes, that’s possible, and certainly been done before….
Probably why Zimbabwe has become the economic powerhouse that it is, so I guess it all worked out…. *big sigh*
And I guess you have a point…
No one can say it’s stock market didn’t go up, that’s for sure…
We’re all sure to be millionaires in no time…. :-O
I don’t understand the entertainment business
30 sec funny superbowl commercials cost millions of dollars
and i can come here and read posts like those above for free
Com’on, man… You don’t appreciate the “research” you just got?? hahaha 😉
WOW, OMG moment. Bryan Reynolds of Rosenblatt Securities just explained why commodities and particularly oil have been so weak. Our good friends on Wall St. have subprimed commodities. They securitized them on massive leverage in the OTC derivative market to the tune of $22 Trillion on 100 to 200 X leverage. Then, they rented off shore tankers to store oil and rented warehouses to hide aluminum and other commodities to create the false appearance of shortages. It is unwinding now. Will Goldman be the next Lehman?
Kent is this a proprietary report or a public one? If the latter then please would you post a link. Thanks
Purvez – i googled brian reynolds and found the video at cnbc (take with grain salt)
it would make sense from the perspective of the baltic dry index collapsing yet the tanker business has been just ok.
over the years the copper story has rarely made sense to me
i’m inclined to believe brian’s story to some degree pending further info
Specie thanks, I found the video and you are right. Mr Reynolds a couple of videos earlier on CNBC was saying that this drop in oil was only lasting a few weeks more. Now its suddenly going to last for a ‘looong’ time.
These ‘analysts’ will say anything to keep themselves in the news. Just listening to the 2 videos of Mr Reynolds I’d run a Mile if Rosenblatts wanted to have me as a client. Lol.
It was on cnbc
Just a heads-up, if anyone follows….
~If~ we close anywhere around here today, I’d expect that my trading system will flip back to a “Sell” condition….
Any longs taken from the 12/23 buy signal should be liquidated, and a 50% short position goes into effect…
This is just for tracking purposes, and as noted, this is not a confirmed signal at this moment, just a heads-up that we are approaching that point…
Great to hear from you Nicolas. I was starting to get worried that you wouldn’t return.
And thanks for the tips!
Kent, very interesting. During the 70’s they used the same tactics to create the illusion of a ‘shortage’ of oil. Maybe the same market conditions now; but in reverse using gold as the ‘commodity’ of choice? Think about it!
John Li, I only have the monthly data supplied by the FSC from 1834-1848. I’ll bet the data you are seeking is out there but it will take a lot of effort and time: asking questions about sources. I’d start with libraries; perhaps the British Museum Library?
https://en.wikipedia.org/wiki/Long_Depression
Thanks — the 1873 crash was overdue vs the solar cycle, but I am using the 5/1873 crash date. I have always wondered if the peak date could be much earlier.
For example 1/1906 was the peak date, but the crash was only realized in late 1907.
Euro over sold and Dollar over bought. Greece will be allowed to leave Euro Zone thus ECB QE no longer necessary; and, US Treasuries rallying strongly which means no FED rise in interest rates.
Click to access GoodhartDelargy_pluscachange_02.pdf
Maybe the guys who did this research know?
Thanks.
As I mentioned last week regardless of your 2015
outlook an increase in volatility looks perhaps the easiest
current call.
Nicholas,
equity bear markets have not been abolished,
regardless of QE.
Of course the FED will come in again, and hard,
however the FED cannot abolish the business cycle,
they can alter it – it’s a subtle difference in language
and a huge difference in reality.
That will become all too apparent with the next US bear market.
This down draft may need to touch the trend line from mid Oct’14 lows to mid Dec’14 lows before reversing. Although how high it goes after that is anyone’s guess.
8 day Forecast
Based upon “Lunar Chord” and Seasonals
Lunar Chord is made of Lunar Phase, Declination, and Distance
Today: Dwn
Tues: Dwn
Wed: Dwn
Thur: Dwn
Fri: Dwn (with chance of stap back rally)
Next Mon: Mixed
Tues: Up
Wed: Up
Betafish I’m running out of space on my wall with your ‘rules’ / predictions!! Lol.
KEEP ‘EM COMING!!
..and many thanks for them.
I can’t profess to understand any of this Lunar Phase, Declination and Distance now christened as Lunar Chord by yourself but so far it appears to work and I for one am very grateful.
P.S. In case some one here gets the wrong impression I still use FULL money management techniques in case we get a ‘rogue’ Lunar chord whip lash!! I love the imagery with all this chord and whiplash stuff. Hehehehe.
The Lunar Chord is simply a three ply rope or chord made up of Lunar Phases (Full plus four to New plus four price positive, inverse price negative), Lunar Declinations, (Far South plus two to Far North plus two positive with a mega up move at Far South plus four to six, and inverse negative except for a slight up move at Far North plus four to six), and Lunar Distance (apogee plus four days to perigee plus two days price positive, and inverse is price negative).
Your positive response to this phenomenal market timing rope or chord is much appreciated. But wait there is more!
Seasonal patterns act as a metallic wire within the chord to give additional strength:
First week every month prices tend to rise.
First three days of second full week prices fall (like now), last two days up.
Entire third week of every month prices tend to rise.
Second to last full week of every month prices fall.
Last week prices tend to rise.
The exceptions to this rule are that first week of April is not good, and after US
tax day April 15 until May 2 prices tend to rise dramatically (rewarding tax day
investors with lower acquisition costs and an immediate return on those investments). Also June and September tend to have an additional week of price weakness.
Now the moment that I am waiting for is for Peggy to update us with her spiral methodology including something that she has dubbed the “triple clicks”. Sounds intriguing.
You are hell bent on blowing my mind…aren’t you Betafish?
I barely ‘get’ moon rises and falls effects so anything else just fries my brains.
I just follow your lead but with relevant stops to manage my money.
Much appreciated though.
$NYDEC at 2,445…need more gusto from shorts to indicate breadth capitulation.$NYLOW at only 117….Longs be patient and wait for the bottom. let the market do what it wants to do first.
I make no prediction as the market can go both way…but my know my bottoms.lol.
Hehehe. Knowing your bottom is quite IMPORTANT Newt. Otherwise sitting down becomes difficult.
Excuse my attempt at humour but its late in the UK and I’ve had a ‘good’ trading day so feeling a bit jolly.
GL to all tomorrow.
The moon is fundamental with regards to finding bottoms.
A really interesting analysis here on:
Ichimoku: US Equities Fragilely Balanced At Peak Disequilibrium
I’ve never really used Ichimoku, but the way it’s presented here makes it kinda simple… I like simple… 🙂
http://tmblr.co/ZCFv5q1ZuOwGB
Thanks Barry for that link. I had been intimidated by Ichimoku as well but you are right this guy has provided an easy explanation. Like you simple works best for me too.
Is this decline for real? Perhaps but a bounce is still coming after SPY filled gap and hit trendline support, while TRIN spiked up above 2 also pointing to ST bottom. I am long SPY at the close.
My guess its a very short term bounce. But I see your logic.
Thanks all, new post is out