
Well, is it a bear market rally or a bull market rally?
20 months after topping indicators started flagging we still can’t say for sure. That sounds incredible, but before the 1929 top the first topping indicators flagged from May 1928 onwards, and before the 2000 top the first topping indicators flagged from July 1998 onwards. So long difficult tops can and do occur.
In our current scenario we can pick out these 3 as the longest standing divergences from January 2014 onwards, then picking out May 2015 as the actual bull market peak:
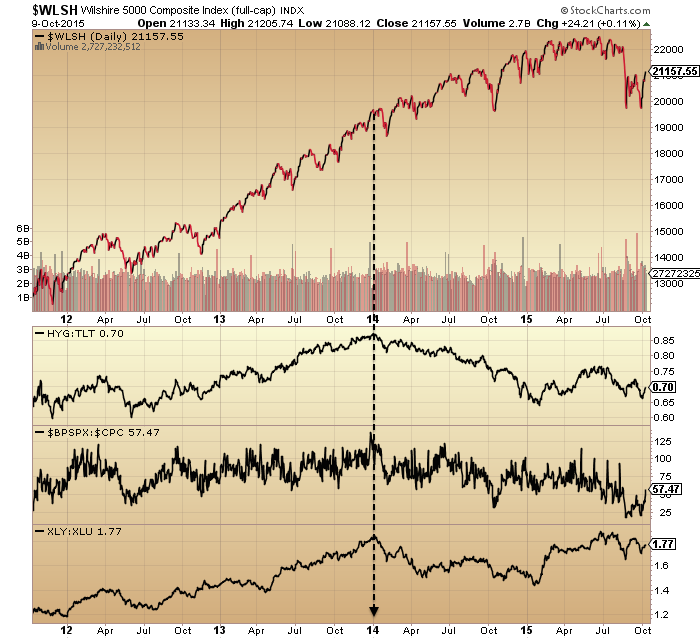
Source: Stockcharts
Collectively these 3 indicators represent a shift away from risk appetite, which is a typical topping process identifier. Apart from these, it’s worth recapping what other clues were there way back at the start of 2014, so this is how things stood then:
The previous 2 years rally in US stock indices was made up of less than 20% earnings growth and more than 80% multiple expansion. The last 2 such occurrences in history were 1985:1986 (leading into 1987 crash) and 1997:1998 (leading into 1999 real Dow peak).
Compound annual growth rate in equities since 2009 was only exceeded in 1929, 1937, 1987 and 2000, all of which led to steep market declines.
Valuations (aggregating various measures) were the third highest in history after the 2000 and 1929 peaks.
Russell 2000 reached trailing p/e ratio 88; Amazon trailing p/e 1440; Facebook trailing p/e 148; Twitter reached $40bn market cap with zero profits.
Declining breadth in the number of countries participating in world equities rally.
Cluster of extreme Skew readings not seen since June 1990 before recession began July 1990.
Investor Intelligence percentage bears and bull-bear spread were both at 1987 levels (market crash).
NAAIM survey sentiment was in the 98th percentile = extreme optimism.
US household exposure to equities had risen to the same levels as the 2007 top.
Fund manager allocation to global equities at levels that previously led to a market peak or correction.
Rydex bull-bear and levergaged bull-bear ratios at an all-time record.
Margin Debt had escalated to 2.5% of GDP, only exceeded at the 2000 market peak.
And the list did’t stop there. But, we can unify these varied measures and indicators as (1) evidence of an unsustainable mania and (2) divergences in breadth and risk appetite. The first warned us of a coming peak and the second of a peak in progress.
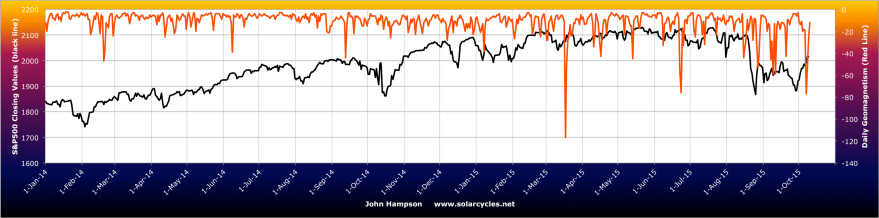
At the time solar scientists believed the solar max was already through, but this didn’t turn out to the case until mid 2014.

Fitting in with this, at mid-2014 the bulk of other negative divergence topping indicators formed. We saw a similar bulk-flagging in Jan-Mar 2000 (before the August final roll over) and in June-July 2007 (before the October final roll over).
Here we see high beta to stocks, stocks to bonds, stocks to dollar and junk bonds as examples of that under-the-hood mid 2014 peak.

Shortly afterwards geomagnetism started to ramp up as is common post solar maximum and weighs negative on the market.

All four charts so far in this post show the same thing: peaks in the past and downtrends in place ever since. This aids our conviction for a bear market in progress.
A closer look at recent geomagnetism reveals this:

There has been an intensification of storms since around February this year, after which the market struggled to make any further gains. The latest spike down was right at the end of last week, meanwhile sunspots have dropped to close to zero, so for now solar influences are very much aligned for a bear market.
By the recent stock market low of late September, capitulative breadth, contrarian put call and sentiment readings had formed, out of which the market has made a sharp rally upwards to the current point. Bear market rallies are typically fast and furious so the strength doesn’t provide decisive confirmation of bull or bear.
The Zweig breadth thrust flagged at the recent low, and history shows that these have been potent rally initiators in bull markets but overall poor in bear markets. So again, that doesn’t particularly help us here.
Also, insider buying flagged at the recent low, but again, history shows us that this group is a dip buyer at both bull market correction bottoms and bear market pauses, so wise enough to be buying after falls but not wise enough to differentiate between a bull correction and a bear market.
Capitulative breadth returned to zero earlier last week (i.e. bullish edge gone) and Nymo hit a rare extreme of over 90 by the end of Thursday. Here are similar such Nymo prints from the past:

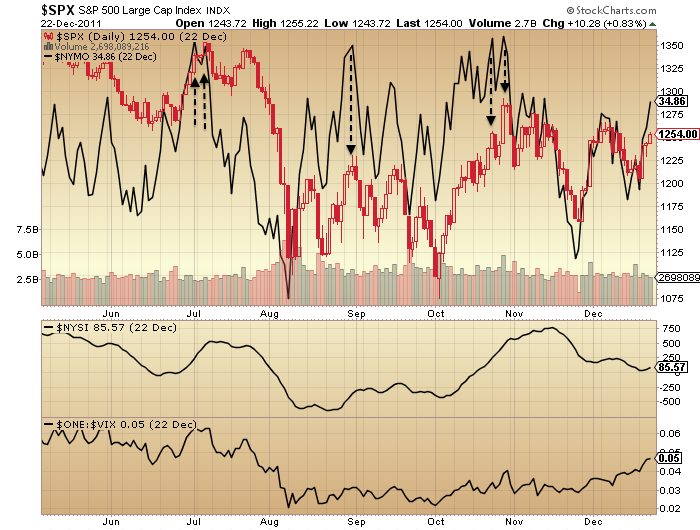

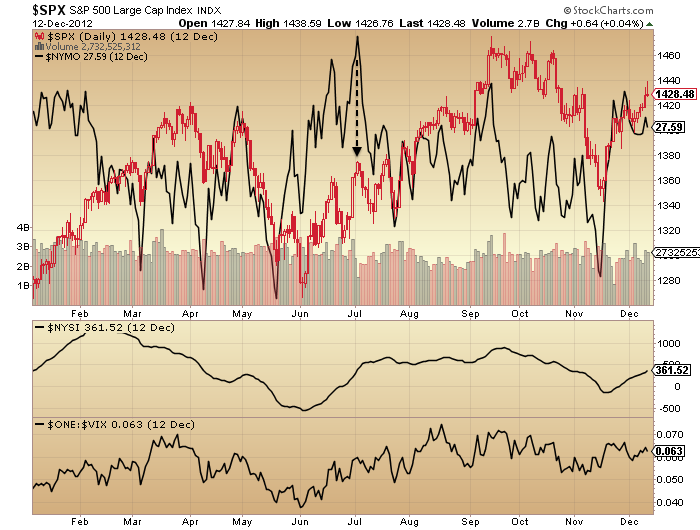
Fairly consistently they initiated a pullback in stocks either to the day or within a couple of days. At the start of this coming week we have the new moon and US earnings get going, so that, together with the very recent geomagnetism could help trigger the fresh reversal. But what then?
Drawing on historic examples of the kind of price pattern in progress, I suggest two possibilities, shown:

One is we reach up to the 200MA then are repelled back into the bear market. The other, and my favoured option, is we pull back lower, then make a lower high, then resume downwards.
Chris Carolan merges previous similar solar lunar years from the past and creates a model. I don’t know how successful this is but the method appeals.

It might fit with my favoured scenario of pullback, rally back up to lower high, then down again properly as of November.
October is typically the worst point seasonally geomagnetically, from which pressure then eases. Plus earnings may collectively surprise worse or better. These are two wildcards for the rest of this month.
ECRI leading indicators are still negative but maybe forming a higher low, whilst narrow money leading indicators for the US suggest weakness over the next several months. Financial conditions in US, Europe and Asia are united negative.

Source: Bloomberg
Biotech, the mania leader, and my biggest short, has only managed so far to make a bear flag down at the lows, post parabolic break. Gold and miners, my only longs, have taken off this last week, but as yet we can’t differentiate them from the bullish break upwards in oil (whether they are acting as safe havens or commodities).
To finish, if we step back and look at the big picture again, there is considerably higher likelihood this is a bear market rally rather than bull market post-correction resumption. The US indices are currently less damaged than most others but the wider world is more convincingly bearish. The Dow Jones World index shows a fairly telltale topping process:

And Leuthold provide a nice summary of matching divergences in the US into the May 2015 peak to the 2000 and 2007 peaks.
Source: Leuthold Group

Years end in “5” don’t go Dow-n.
Finding Nymo sounds a bit fishy to this clown.
Forgive my silly puns,
But it really would be different if this year is down.
In my opinion, the decadal cycle is a red herring. It’s the way solar cycles have fallen the last century, with solar maxima mainly falling near the end of the decade, thus causing what looks like a decadal pattern in the markets. Can you give me a compelling reason why years ending in 5 should do something to the market?
Good post and I agree about year 5’s, over last century they have almost all been during low to high sunspot cycle.
Can you tell me why solar cycles should affect markets ? Same logic really. Why would astrology work ? Why certain dates or patterns ?
I don’t know but if sifting through goats entrails works I will use it.
I’m open minded too, but a correlation on its own isn’t enough for me, I want a scientific or logical reason AND a correlation. How and why solar affects the markets is explained in my PDF, Trading The Sun
Nice work John. While a bit lengthy, there is certainly clarity in your synopsis and work. Bravo Zulu!!
Thanks
Thanks John, much to ponder re the big picture, although I am still firmly in the bear camp. I thought the length of the post was just right by the way. 😉
Commodity price falls in the past year and generally weak end demand are bound to be compressing corporate margins (from their abnormal cyclical peak), so I think earnings will disappoint.
Some were expecting Kuroda to up the ante in Japan as their data continues to show weakness, but nada. Perhaps he’ll leave it to Abe to nuke China, purely for stimulative reasons?
For me, the big tell will be the USD. Weak very recently, but I am expecting the dollar to soar as the squeeze on eurodollar borrowers continues to mean a shortage of dollars, as well as safe haven flows continuing. If the dollar heads up, it hits the carry trades, and knocks commodities back down again. I see that as a certainty, and a killer of all things bullish. Saudi selling of US financial assets also likely to continue apace.
This piece from Jeff Snyder (as complex as ever) hints at the troubles lurking just beneath the surface.
http://www.alhambrapartners.com/2015/10/09/swap-spreads-implicate-huge-dollar-divergence/
Thanks gm
It’s shaping up for a fascinating week, whatever your current
view.
YUM grabbed the headlines last week but there were some
other notable and significant misses, AA. as one example.
Many appear to expect imminent price weakness, so
some more upside would not surprise me.
However, risk look to the downside here and I am in
the bear market rally camp.
As always it’s best to stay open minded and alert for
evidence that suggests something different from a preferred view.
The economic recovery was not led by bank lending but by non-bank lending and that non-bank lending is drying up –fast:
http://finance.yahoo.com/news/us-economy-risk-warning-coming-012031217.html
Thanks
I have “flopped” back into the camp of a crash in stocks. Why? Because I have expanded by view of Delta. Delta is a striped down version of the theory that Celestial Bodies effect Humans on Earth. Delta is not only striped down in its number of Celestial Bodies, three, but also further striped down to only how those three interact in only a two dimensional plain.
For the longest time I was expecting the six point rotation long term point 2 to be the “crash” point that would bring in super long term point 6. Instead of the usual “average” of those points because the 2 point is a “crash” point (Inversion Window point) I expected a crash –up– that would have the power to bring both points in at the 2’s due date. But I now think that both have come in together but on the 6’s due date. But why because it doesn’t “add up” very well SOLEY FROM A DELTA POINT OF VIEW. And that is the rub.
If there is a “general” Celestial Body theory then Delta is a very stripped down version of it.
Here is my latest thought: It isn’t Delta’s six point rotation Long Term point 2 that is averaging in with its Super Long Term point 6 but with the Solar Cycle top. In other words the reason the Solar Cycle top is so late in –crashing down– is because Delta’s Long Term point 2 is early in its –crashing up–. While one is trying to “crash down” the other has been trying to “crash up”. Accepting that Delta is a very limited and stripped down version of a more general Celestial Body theory of market behavior allows and explains why the Solar Cycle top is so late and why Delta’s point 2 and 6 did not average in together or on the 2’s due date. It is the Solar Cycle top that averaged in with Delta’s 2 point with both coming in on Delta’s 6 point due date.
Yes I’m bearish from 2134.72 EW count is 1 2 1) 2) 3) 1867.01. The persistent rally from 1867.01 = 2020.86 for A B test of low 1871.91 and what appears to a 5 wave C to 2022.34. From 2022.34, a mini 5 wave decline to 1993.51. In the meantime retracement abc up abc down and possible 5 wave up for a std 335 retracement. The strength of the retracement bothers me as I believe we should be heading down from here.
3 times we have seen such a combo of $vix $vxv spike followed by $NYMO extreme with such put/call levels: 2015, 2011 and 2008. Here they are and what happened next:
I know that you don’t consider “wave counting”. Delta is a system of “waves” within a very limited Celestial Body cycle (two dimensions) of 19 years, 5 hours. Elliot is “wavial”, only, with no reliance on any cycles –Celestial or otherwise. As far as “waves” are concerned, Delta is “outer to inner” while Elliot is the opposite of “inner to outer” of their effects on Humans. But when both align –look out!
With my new view that the Solar Cycle is only going to effect Crude (and not American stocks) means that in the past several days both Elliot and Delta have aligned for a big decline in American stocks.
Opps, error, I meant with my new view that the Solar Cycle is NOT going to effect ONLY Crude and not effect Stocks. I other words I am back in the camp that the Solar Cycle is effecting Stocks and not just Crude.
The fact that it isn’t Delta’s Super Long Term point that is causing the Solar Cycle top to be so late is further proof of this Solar Cycle’s weakness. Delta’s (six point) Long Term rotation Inversion Window (i.e, Crash Window) being the “cause” of the lateness of the Solar Cycle crash is “proof” that this Solar Cycle really is weak (but doesn’t rule out an eventual crash).
The classic view of the (bull) 5th Primary wave having commenced is not yet confirmed by a long way. The high probability of complex (corrective) Primary 4th remains firmly on the table with ongoing complex form. Mind control enthusiasts infect media like locusts. So wear a Faraday cage on your head at all times and just read the charts. The foot was shot over 7 years ago and counting, gravity always wins, interventionism always loses. Its just a matter a time. An extended 4th wave foretells a failed 5th and a multi-decade grinding bear. So I better be careful what I may choose to wish for.
Multi-decade, inevitable, and that’s just leading up to the triumph of gravity.
Best not to ponder the thereafter.
A small sunny island somewhere safe will be nice.
Thats why I moved to Maui.
Very sensible, and no doubt very nice too.
I’m thinking a Greek island myself, or the Canaries.
There is a huge head and shoulders formation in the S&P 500 if you look at a two year chart. The upwardly sloping trend line that connects the October low of 2014 and the recent low in August of 2015 is the proverbial “line in the sand.” If it is breached (we are at the right shoulder now), one can reasonably presume several things. There will be waterfall selling (with unusual velocity, margin calls, algorithmic computer generated sell programs, etc). At some point, the Fed will either jawbone QE4 or in initiate it. There will ensue a huge counter trend rally, from much lower levels. Gold and silver will take off in the greatest bull market of our generation. In 2008, the panic selling dragged down the precious metal mining stocks and when the panic selling was over, those stocks took off. If the same thing happens this time, considering these stocks are already at historically extreme low levels, I would consider them to be the buy of a lifetime.
Like many H&S patterns, this one is only two-thirds formed, imagination required to see the right shoulder. Worth monitoring though.
Great observation, ES contract reached left shoulder high at 2014.50 on Sep 19th, 2014. Today, on Oct 13th it reached perfectly same high !
There is a huge head and shoulders formation on a two year chart of the SPX, with an upwardly sloping trend line connecting the October, 2014 low and the recent low in August, 2015. If that trend line is breached (we are at the top of the right shoulder now), one can reasonably presume several things. There will be waterfall selling of unusual velocity (exacerbated by margin calls and algorithmic computer generated sell programs). At some point, the Fed will either jawbone QE4 or initiate it. There will ensue a huge counter trend rally, from much lower levels. Gold and silver will take off. In 2008, the panic selling dragged down the precious metal mining stocks. When the selling ended, those stocks took off. If a similar scenario unfolds in the coming months, considering the mining stocks are already at historically extreme lows, I would consider them to be the buy of a lifetime.
I am not considering Gold to be a “buy of a life time” until Delta’s US Treasuries Super Long Term point 1 comes in as the high of the two-19 year cycle in 2020 just like if did in 1944 and, also, was the two-19 year cycle low in 1982.
Faith in US Treasuries will last until 2020 and radically fall after 2020. That is when I will be buying precious metals for the fall/decline of the US government/society. 2025 will start the usual 19 year cycle crash of American stocks and 2030 is expected to be the bottom of the coming mini-Ice Age.
Sound reasoning Richard, although those outside of the US will not have the luxury of waiting til 2020. Anyone buying gold now will be getting the buy of a lifetime.
I saw this a while ago, it ties in with your thoughts, but includes CAPE for equities, which should bottom in 2020 I imagine.
http://screencast.com/t/kfulwlSH7
Stan Harley says and shows bonds have 40 year runs 1940 to 1980 down and 1980 to 2020 up. It works backwards from 1920. Hard to believe!
The more I learn Kent, the more I realise that pretty much everything is just a bunch of cycles. Wish I’d learned this back in my 20s, be a billionaire by now!
GM, hate to pop your ‘bubble’ but surely being a billionaire also must come in cycles… no? 🙂
Market moving NEWS will be coming out of Lima, Peru, and now it starts:
http://finance.yahoo.com/news/euro-zone-vulnerable-ecb-cant-141752314.html
It must be serious. Sabine Lautenschlaeger frown is impressive. If there is a correlation between level of frown and seriousness of the situation and we are in the scheisse.
Time to start talking US “r” word:
http://www.businessinsider.com/warning-signs-of-a-us-recession-2015-10
Now, the Global “r” word:
http://www.businessinsider.com/-global-recession-2015-10?r=UK&IR=T
Frau Lautenschlaeger no doubt frowning as she knows that all of her weekends are going to oh so busy in 2016 and 2017, resolving certain banks.
Good luck to her.
PALS this week:
Phase: New Moon +
Declination: post equator moving south – Wed to Fri
Distance: – all week
Seasonals: opex week, slightly positive
Planets: post Uranus opposition, negative; wrapping up Mercury bullish period post inferior conjunction; overall –
Summary: Choppy week ahead. Most of strength will be from morning lows to end of day. Sell offs most likely overnite.
The SPX is in overbought territory. Definitely should be some selling this week
Gann’s Master Time factor has been on the money predicting the last several years. Bullish stock mkt, strong $, and weak commodities. Well , per the MTF, commodities should bottom in Dec and rally for 2 years. We are repeating a 1950’s type era. Stock mkt strong with mild bear markets and $ strong but weakening. I am going with bear mkt rally in commodities, strong $, and weak stk mkt. I could see how geopolitical concerns could cause the previous. What is it, sell the drums of war and buy the actual beginning like Iraq 1.
Well this week should be the second chance top of this bear leg down. I would expect the dow to fall to 14750-15000 if this is the case. I have started building short positions accordingly but am wary of further upside due to….well no logical reason.
Thanks John, I havnet been on Solarcycles in a while but last few articles have presneted an excellent bear case. However, I feel we are more near a long term bottom than top. I do believe we will have a bear market – we always do. But that may be many months away. I expect new highs either this year and certainly next year.
One aspect that you mentioned before has been demographics. However, isnt this being adressed in part with the mass migration going on in the world. Germany is a good example where they have identified a demographic issue but want to overcome that with new migrants.
‘I expect new highs either this year and certainly next year.’
Hello Duncan. As you rightly say, JH presents an excellent case.
Would you mind sharing your bull case with us please?
Re German immigration, I guess that explains why ISIS was created then, to cure the West’s demographic issues. 😉
Dent has taken into account immigration to the US. He says it helps but does not void the overall negative.
This morning 30 year treasury futures are rallying much stronger than 10 year treasury futures. So what does this mean? Another QE? Gold Bugs seem to think so. However, I interpret this as the beginning of a major rotation out of stocks and into treasuries.
Richard I, You will be happy to hear that JAMSTEC, the Japanese World Weather model, is starting to predict the La Nina. Considering the JAMSTEC is known for being one of the better El Nino/La Nina forcasting models, I see that as very interesting and supportive of your previous thoughts on US droughts. How that affects grain will be your area, but we are still 1-2 years away. For now expect large precipitation and significant snows in the South of US and east coast this winter. The Winter may be colder than normal in High population areas and average, Nation wide.
Thanks, Heating Oil is breaking down hard today and is pulling Crude down with it. Note that neither the NASDAQ, Copper, nor Heating Oil have confirmed the upward breakout of the DOW and Crude. Today, Crude is reversing from its Elliot A-B-C upward correction. Only the DOW is still holding up and trying to rally further.
With Treasuries continuing their rally, the long bond much more than the ten year notes, points toward an imminent reversal in US stocks and hard fall in an Elliot major 3rd wave.
The NASDAQ, Copper, and Heating Oil have all made Elliot upward corrective Truncated “C”s while long dated US Treasuries are rallying stronger then short dated US Treasuries.
I am expecting today to be the reversal day in the DOW and the highest that we will see it for years to come. I expect an EOD sell-off of the DOW.
Today is also the New Moon which means declining stocks to the next Full Moon too.
Take a look at the major American stock indexes as per Elliot major upward corrective 2s with the usual A-B-Cs. The DOW is the best in an almost “picture perfect” corrective rally. The S+P 500 is next. The NASDAQ is making a “truncated” C of its 2. And the Russel 2000? It’s “B of 2” broke to a new low, unlike all the others, and it has a badly truncated “C of 2”. Warning, Warning, Warning.
Heating Oil has reversed hard to the downside today from its truncated “C of 4” and is pulling Crude down from its “C of 4” too. Heating Oil is the first market to “give it up” and reverse hard from its truncated C and I am expecting Copper to be the next and most likely will do it today. If that happens then I expect US stocks to also top and reverse to the downside in their Elliot major 3rd wave sell-offs.
Treasuries are behaving “weirdly” but in accord with a major top in equities.
Anyone with a rational brain can workout that the following chart is proof that PM markets are manipulated, whether that is by design or purpose matters not.
Itis what it is.
FACT: Ag production has collapsed in Australia, by over 30% in twelve months and has declined in almost every other major producer to some extent over same time period, whilst Indian demand has exploded and yet price declines.
Then looking at the weekly chart ones only needs look at the 50 wma to see that it has kept the lid on price……….WHY?
Because technicals control price via paper controlled markets that dwarf the physical markets through absurd leverage and determine price, NOT fundamentals.
Gold currently sells at approx 72 x the silver price and yet there is roughly 11 oz of annual Ag produced for every 1oz of Au.
This makes perfect sense……………NOT!!!
http://stockcharts.com/h-sc/ui?s=SLV&p=W&b=5&g=0&id=p02679229482
It is rapidly becoming SHTF time as everything, including Gold, will sell off hard as the USD and US Treasuries rally. Heating Oil keeps on selling off for the biggest down day in years. Copper is negative for the day and Silver just turned negative. It is clear that the Metals have made a Delta Long Term low Inbetween point and their Long Term 1s will be highs. I think that Gold is making its Long Term 1 as a high, today, via the close. This is a slightly early high point pointing towards a hard sell-off in Gold to come as it breaks to new lows in its Long Term inversion (crash) window.
Hang on to your hats as the Metals (especially Gold) goes much, much, lower.
“Hang on to your hats as the Metals (especially Gold) goes much, much, lower”
Not according to Aussie gold miners. You gonna tell me that history is wrong this time?
This is the collapse of debt, fiat and everything paper!
And it is the collapse in paper that will finally expose the sham that is COMEX and many many other markets. The COMEX never had anything to do with hedging risk or fundamentals.
As American Retires dump their PM hoards the PMs will drop like a rock. It might be better, now, to cast your Gold into an anchor and throw it over board to beat the rush.
Richard I, much as I like your ‘diverse’ and contrary (against yourself) views it is your hyperbole that truly ‘gets’ me. If American retirees had gold they wouldn’t be in the state that they are in now….’flipping burgers’, poor souls. The only thing they can throw overboard would be themselves in desperation. ‘GOD FORBID’
markets are rarely rational and often do not make sense.
This is more gossip than anything else but it’s ‘gossip’ of the highest order!
http://wolfstreet.com/2015/10/11/bill-gross-pimco-seeks-revenge-deceit-greed-power-struggle-lawsuit-complaint/
Wonder if Bill Gross’s billionaire cycle is coming to an end. Just as Solar Cycles crew’s is just beginning.
Using Martin A’s 8.6 year cycle and teaming it up with EW I get 22.575 of impulse waves and 13.975 of corrective years. Both can go in either direction.
Given that we can safely assume BG has had UP years I would be very interested to know whether they were 22.575 UP years. IF so then the bloke has at a minimum of 13.975 DOWN years.
It’s a hypothesis that is VERY MUCH Work in Progress SO BAGS of Salt requred.
This interminable back and forth is driving me crazy so I’m going to tell a story that the Fed and the PPT need to hear so that they can clearly understand their ultimate fate. : (Note : The ‘gist’ of this is something I read a long while back so I can’t credit it to anyone particular….suffice to say it’s NOT MINE.)
A wealthy owner had a slave who had served him well. One day in the market the slave saw a hooded person with a scythe (aka grim reaper) staring at him. Later he saw the same person in a different place once again staring at him. This happened a third time.
By now the slave was in total dread as he knew who that was and so asked his owner to give him a horse so he could flee to City ‘B’ to avoid the grim reaper.
The owner who was a kind man gave him one of his better horses and some money and the slave fled to City ‘B’.
Later the owner was was wandering in the market and he saw the grim reaper so he accosted him and asked him why he was following his slave. The grim reaper replied ‘I wasn’t, I was surprised to see him here. I’ve got a meeting with him at City ‘B’ tomorow.’
You can’t escape DESTINIY!!
All the best to ALL.
Here’s another one, true story: In 1980 a Native American living in Tacoma, WA, began having dreams about Mt St. Helens erupting. In his dreams he was walking around outside during the daytime, but it was dark as night, the sky and sun obscured by dense clouds of ash from the volcanic eruption. This man interpreted his dream as being prophetic, and because Tacoma is fairly close to Mt St Helens, he packed his bags and moved to Spokane in the far eastern corner of the state, which is much further from the mountain than Tacoma.
Sure enough, Mt St. Helens did erupt a few weeks later. But the prevailing winds carried the ash hundreds of miles to the northeast and dumped a lot of it on–you guessed it–Spokane. Day was turned into night in Spokane for several hours as ash rained down on the city. Tacoma, even though it was much closer to the eruption than Spokane, received only a slight dusting of ash, nothing like what Spokane got.
Wow, pimaCanyon that is far more SPOOKIER than my story. Mine was, as far as I could gather, an anecdote.
Maybe we can use these at Halloween time eh?
GM, did I read you correctly above? You are getting a Greek Island? Wow!! They must be going VERY CHEAP at the moment. Will you become Varoufakis’ neighbour? Tell him I admire him for not ‘selling’ himself like Tsipras.
So this ‘Morocco trip’ is a shopping expedition eh?!! LOL .
Enjoy your holiday.
Maybe Crete depends how high the gold price goes p
😉
Hahaha!! You don’t want something ‘small’ then. We went to Agios Nikolaos (maybe that’s where Nicholas is?!?) many many years ago for a fantastic holiday. Hired a motorcycle and toured the south west part of the island. It was very very nice. You have to be young to do mad things though…..although if challenged I’m sure I could do some ridiculous stuff now too.
The numbers are in and OPEC continues to pump oil. The fact that oil was unable to breach the Aug. high probably means we go down from here. I personally would like to see a double bottom to hold Aug Low. But we may just stabilize in a trading range. OPEC is putting the pressure on Fracked oil and they are not letting up. The US frackers will have to submit. They recently showed an acceleration in rigs shutdown. This will probably continue. A trading range until the supply glut is clear and then a climb to $60-70 sometime in 2016 is my prediction. I would not be surprised if we get a big stock sell off and oil goes with it either. But I will stick with the 2016 prediction for now. US production WILL (By Economic force) rebalance the glut.
“As American Retires dump their PM hoards”……..LOL
You are joking right!
What PM’s pray tell do American retirees hold?
Richard I have been around long enough to know how the large investment banks have cornered and operate in this market.
In the 90’s they used huge and I mean mean MASSIVE paper leverage to suppress the price so as to force miners into absurd hedging, in some cases years into advance and those same bankers were there to take their gold at a discount.
Once that was flagging they then began accumulating those oppressed miners for pennys on the dollar ahead of the run up in price……….they ain’t stupid!
They knew they would finally lose control of that game and when the dot com bubble burst and investment demand exploded on the back of 911 amongst other things they rode up the miners.
That is why miners begin to outperform well ahead of the metals buddy. Just as they have been for many months.
Aussie miners, particularly juniors are seeing massive volumes. Who is you think that has the reserves to drive that volume?
Get ready because once they have accuumlated as much they can and they know their price rigging is exhausted again this time, off it goes agan.
The prospect of American retires not getting their Social Security checks is real as the Republicans decide to not extend the credit ceiling. When they go with out checks they will turn to dumping their PM holdings in order to continue gambling in all those American Indian casinos.
In addition to that possibility there will be no American Federal pay increases for retires and civil servants next year.
Lol they don’t own any PM’s so they have nothing to dump.
I’d expect possibly the last up day to be tomorrow if it’s going to be one before declines into end of the week. If it’s just a constant rise all week a rethink will be needed.
Martin Armstrongs theory is that the massive explosion in US denominated debt is a huge short on the dollar.To wit I say….
The vast majority of that debt will never ever be paid back amd will simply implode. At which case it beomes a huge noose around the neck of the dollar.
Yes Allan, but there is an interim stage….during which people scramble to ‘get’ dollars to pay off the debt. In that period the USD will go parabolic. ONLY AFTER the game is known to be up that we’ll have the situation that you define.
Time scales, as I think I’ve mentioned before, matter.
purvez, won’t be happening. Just as in 2001 the sell off in overpriced US securities will drag the dollar lower.
There will only be one safe haven this time around. Martin A says that there is a collpase in not only Bonds but the economy and then says there will be a flight of capital to the private sector?
That is insanity and flies in the face of all logic. Not that markets are at all logical at present. However the economy will collapse as a result of debt implosion and there will be a scramble to sell bonds and stocks.
I can only say what I have learned from history and Aussie gold stocks are telling me that the bottom is in for PM’s
It’s been happening for a year already Allan. It’s going to take the dollar index to 110+ in the next couple of years IMO.
Hello from sunny Agadir, I’m off for a 2 hour massage.
Keep selling whilst I’m gone please.
Like crying wolf too many times?
https://smaulgld.com/why-comex-wont-default/
COMEX does not have to default for the sham to shwon up for what it is. In fact I don’t remember ever using the words “default” and “COMEX” in the same sentence.
The COMEX will eventually just lose its effectiveness to govern price, ie it will lose importance and fade away. As a result OI will die. That is already occurring to an extent.
I have the utmost respect for Steve Saville but he has the “bulll by the horns” with the following article.
To befin with he impkies that RRP’s are not an indication of liquidity issues amd then posts a chart showing that during the GFC, which was the greatest liquidity crisis in modern history, RRP’s spiked dramatically.
Secondly comparing RRP’s ratios to reserves is just plain dumb. It totally distracts from the real issue and that was the huge spike in dollar terms.
There are several other issues as well but I don’t have the time to cover suffice to say why is it scare-mongering to raise an eyebrow or point out anomalies?
http://www.investing.com/analysis/reverse-repo-scare-mongering-267708
And, thus, Gold will crash in the second half of Delta’s second most powerful “crash window” (Inversion Window). Note that Gold’s Long Term 1 point was a high that came in yesterday via the close. (There was a low Long Term Inbetween point which puts the odds of the 2 point, a crash point, being a low at 85%.) Down, down, down will go Gold.
Richard seriously?…….it appears you were wrong about stock markets moving to new all-time highs into October so what makes you so certain you are right about gold, because the BEST leading indicator bar none for Au and Ag is saying up?
And I’m sticking with it.
Next equity market down leg underway?.
Yes should be. We had the bad news out of China which is needed to start the decline. Now hope it follows through to a 10% fall in equities at least. Should be done by end of month or mid November if there is an intermediate bounce. Then mega rally into year end before next year sees 30% declines.
Dow recovered earlier losses. Shame! Europe still down so might drown the uber US bullishness over the week.
Closed all dow shorts at a small loss. Waiting to see how much power the bulls have left before shorting again.
Let’s hope so, short FTSE and Japan here for a couple of days as well as Glencore. Looking a bit oversold on the 60 so may get a bounce soon and looking to see if a flag will form.
imho
J
Nicely done.
I’m 97% cash as of this morning.
Two weeks from now, might the Full Moon also include zero Sun Spots?
Very interesting. Thank you.
HVA sorry….but OMG!! This guy just took out 48 minutes of my life to say ‘I don’t know anything’!! Ugh and we wonder why our economic world is in the state that it is? It’s because of guys (my term : idiots) like him who our even more idiotic Politicos listen to.
https://www.tradingview.com/chart/XAUUSD/BHz6Jv7J-Gold-Wave-3-in-Wave-3-Combined-With-Breakout/
This link shows that it’s all a matter of interpretation as we all well know. A couple of comments. Regards Neely, I CANNOT accept the idea that the move from the August, 2011 highs can be counted as the beginning of 5 down waves. An analysis of 5-minute charts clearly shows the move to be corrective and correctly classified as 3 waves down to June, 2013. Since 2013, to present; there are several scenarios in play. Still, the entire structure looks incomplete and seems to favor at least one more new low. My opinion and of course I could be easily wrong.
ES contract might just have topped at at 2014.50 today with the mighty burst out of the triangle consolidation although pefect 61.8% Fibo would be at 2017.
In the same time SPX reached 2022. For perfect A=C equality the top would be at 2024.
We are close to the top
Bunell, I saw your call earlier when you made it and much as I like it, it hasn’t been validated by a 5 waver to the downside on the 5 minute chart.
I had been tracking what you saw and were brave enough to call. I just didn’t have the guts to make that call.
No matter what happens it was a GREAT CALL!!
In real time that is AMAZING!! Thx very much for your contribution.
Thanks Purvez, we’ll see soon if that was correct I have my stops at today’s highs.
If that is really C wave then I would like to see it cutting at least 38.2% of 2009-2015 bull , landing somewhere at SPX 1570-1590 (support at 2001 and 2007 tops)
Black Swain event “risk” rises to highest level –ever.
http://www.cnbc.com/2015/10/13/black-swan-risk-rises-to-highest-level-ever.html?__source=yahoo%7Cfinance%7Cheadline%7Cheadline%7Cstory&par=yahoo&doc=103073883
Tonight’s American Democratic debate may have an unexpected consequence of “hardening the hearts” of the fractured Republican Party such that the government debt ceiling is not raised.
What will matter is not what the Democrats say nor what the two Republican contenders for the Presidency say; no, what will matter is what the hard headed factions of the Republican Party say and do, or, not do.
Richard I, from everything that others here have been pointing to for my reading, my guess is that the ‘black swan’ will arrive either from Switzerland or Germany’s financial organisations. Deutsche Bank or Credit Suisse are eminent candidates.
There are many reasons for the “price” of buying “risk” for a Black Swan event is at its highest in history.
The American Republican Party is fractured and its many factions are unusually hard headed. Those factions don’t want the Democrats in power and neither do they want the current Republican front runners for the Presidency to rise to power either. This means the “risk” of a governmental debt ceiling impasse is unusually high and that could be the deciding factor as to why a new all time high price for Black Swan insurance.
Richard I, yes that too. True.
our 4 year nightmare is over
file:///C:/Users/Basement/Desktop/Gold%28Weekly%2920151013220736.png
dang file
The four year, once in a lifetime, bargain basement sale of the century is nearly over you mean?
ah the buy the dippers always start at 9am……:)
J
Yes, but this time they don’t seem to be able to hold on to the gains. The character of the action is changing…..slowly.
Euro QE is a total failure:
http://www.marketwatch.com/story/europe-shows-everything-we-knew-about-qe-was-wrong-2015-10-14?siteid=yhoof2
Only thing to keep an eye on right now: huge triangle pattern in USDJPY.
Has been heading lower for a few days, I expect it to plunge, taking all risk assets down with it.
And it just *crashed* 30 basis points on weak retail sales.
Today has the potential for some capitulation.
I’ve started becoming rather bullish short term with the recent price action. Have gone with a dow long at 17076. The bears are really starting to struggle. Still feel a larger decline is due this year so this is short term trade.
Death cross on the USD now joins all US major indices. Coincidnce??Not in your life.
Everyone still holds to the principal that the USD will surge in the face of global turmoil and debt default. Rude awakening coming……….
Also it’s no coincidence that PM’s are rallying and Aussie gold stocks are up in the lsst 12 months, in one case over 1700% in the last 12 months.
It’s 2001 all over again. Market turmoil/USD down – Au/Ag up as global security threats reign.
10/14 10:22 Updating the Spiral pulse – Oct 8 to Oct 28 – 2nd half is “where the action is” https://twitter.com/mjmateer
Peggy, what does this mean?
the pulse chart has dates on it and a forecast path. expecting more “action” in the 2nd half of the pulse.
Gosh on the DJIA the 17020 to 17120 area has become a real ‘bun fight’. Let’s see who wins that one. The ‘bulls’ manage to have higher highs and higher lows …. just. It’s either a psychological manoeuvre or….
Today’s American morning session is not about Gold but about Treasuries. The question is: Is strongly rallying US treasuries a good sign for the economy or a bad sign. If it is a bad sign then, soon, there will be a major rotation out of equities and into treasuries and Gold is just making a kneejerk reaction higher that will reverse to new lows as US Treasuries and the USD soar.
Awesome, my mortgage just went down 0.25%.
Lol…
John Li, speak absolute dollars man. Did that save you a million a year?…or not? LOL
Saved me enough to lease a luxury car for “free”.
Richard you keep saying that Au is going to crash but you continue to ignore what has been the trend for months. Market weakness has coincided with dollar weakness and gold strength.
Two days ago you said the highs were in amd today we have another push higher in gold on stock market weakness. More evidence of the overlying trend.
I now I keep saying it but it can’t be understated. Australian gold miners have been setting the trend for months and are the best historical indicator bar none, always leading the Au price out of major bottoms having led all the way down.
All the evidence is clear.
WMT, that is a shocker.
The largest retailer on the planet warns.
The slowdown now appears to be spreading to
different sectors.
They can still announce a new $20 Billion buy back
I notice, made me smile.
Agreed, not a ahocker at all. They anounced a layoff at Corp. HQ recently, they have been reducing 24 hr stores to more reasonable hours. They now seem to want to blame employee wage pressure as a headwind, because they increased pay, but in reality they are not increasing their operating cost, because they are reducing work hours. So sounding like a scape goat to me. Bottom line is the economy is not doing good and so far all the earnings reports are showing decreasing top line growth. I think it will be hard for the market to find any joy this earnings season.
My God!……Is it just me or are people in total denial RE the USD?….the trend is quite clear.
The USD is now trading below its 50/200 dma’s which gave a death cross today along with a break again below its 50 wma.
The trend is a lower high in April with a lower low in July and we just put in what likely is a lower high yet again in Sept with a lower low below July to come.
http://stockcharts.com/h-sc/ui?s=%24USD&p=W&b=5&g=0&id=p54362588316
Bull flag Allan.
Just wait…… 😄
Well now, the sky could fall. It could evaporate, it might even turn into green cheese (my favorite). So read what each and every actual moron has to say and “LETS SEE”. But why when its 3 weeks later do we never have any “LETS REVIEW WHAT WAS LETS SEE”. OK lets see if an oxymoron can be made to be seen. Maybe we will see it was something to do with YOU
With you is true as we all do.
https://blog.variantperception.com/2015/10/14/higher-volatility-and-credit-spreads-ahead/?utm_source=twitterfeed&utm_medium=twitter
Late last week I went long US Treasury futures and I just took nice profits. BOA and Wells just reported O.K. profits and this, along with other banks, could send the DOW higher. My Delta Intermediate wave count also points to a higher DOW along with the 18 point long term rotation point 6 not due until late this month allows for more upside with the large trend still lower.
If this happens, along with good bank profits, the DOW and S+P 500 could easily trade up to new ATHs:
http://finance.yahoo.com/news/wti-crude-oil-price-forecast-163500004.html
Valley,
I haven’t heard much from you this week, we are in tight range. I think we dip little more here and then go up to test 200 sma at 2055, which would be excellent point to short for at least 80/100 points. How does your PALs look next week.
Bill
Bill, posted PALS for this week earlier and based upon it’s mixed reading I chose to go long into today’s OPEX and not bad outcome. Monday morning I will be in cash, and will deploy it to down side if strong opening. 🙂
Next week PALS is mixed again but planetary is bearish so tips scales to negative and Tues Weds of next week are seasonally unfavorable. Won’t be agressively short past Weds of next week.
Thanks Valley,
I remember you wrote you see the market is in a bearmarket ( mild) that will continue into spring 2016.
Do you think this rally will stall en we will plunge again this month into november?
I see a possible decline if I look at the Jupiter/Sun cycle just like 2014.
First bottom in Beginning of August and the later one Oktober 15
Thanks in advance.
I forgot the link:
http://time-price-research-astrofin.blogspot.nl/2015/08/spx-vs-sun-conjunct-jup.html
Sun Jupiter cycle is not good for stocks until October of next year, imo. That said, Sun Saturn cycle is wildly bullish until 2017 (Sat in Sag). So, seems like cancelling effects with slightly bullish tone. Presidential cycle will not be supportive, nor is solar max having ended. So best guess, is flat for next year at least. Higher into December, lows next summer, etc.. I am short into next week with SPY puts, which I will sell if market falls, and then will look to stay long into the October month end as it is a very bullish time seasonally.
USDJPY down by 0.5%.
If this is leading *risk* then this little rally would be worth fading.
I’m holding short.
Not sure about being short right now GM. I think one more burst upwards to damage the bears further is likely. No catastrophic waterfall declines are likely any time soon but still think a test of 16,000 dow is very possible this year.
I still think short is going to deliver profits krish.
This is typical of early stage bears, whipsawing everyone.
I’m at break even after today, comfortable to be patient.
I think Mr Hampson’s scenario of down, bounce, big move down is still in play, with the best bit just ahead.
We shall see. I’m looking to exit longs tomorrow on option expiry and start going short for next week.
I am thinking of “dip buying” Heating Oil, Crude, and Corn. Heating Oil might have made an upwards Elliot 1 wave followed by an A-B-C of a 2 and is starting back up in a coveted 3rd wave. Crude may have already started up in a mouth watering 3rd wave. Corn may be “channel” trading higher and all of this points to higher US stocks.
If Energy and Grain futures are going to start rallying then so will those stock Sectors. Both those Sectors are a large part of the US economy. If so, then the odds of a general US stock crash will be greatly reduced and the odds of a return to a Bull market for US stocks will increase.
Looks like you are right. Bull market is back!
From their August/September lows all three look like they have made Elliot impulsive 1 waves higher and A-B-C 2nd waves lower to start back up in the much desired 3rd waves. If so then the odds are dropping that American stocks are going to crash again anytime soon.
Richard, I remain bullish on WTI oil in the long run and a normalization to $60-70 by end of 2016. My shorter term forecast is a trading range until we see how the glut is going to be resolved. I am encouraged that the recent news did not crash the price more than it has. I still think this is a risky news generated play and prefer to play Nat Gas (UNG), which is getting hammered as of late, but in general, I am expecting a BTU cost recovery, in which all energy sources will be climbing out of the multi year lows. This Winter in the US I am expecting it to be stormy and cold in the high population areas and this should spike heating fuels, but that will be mostly between Jan-Mar. I will continue to sell stocks if it continues to rise. I completely lucked out by selling my STX which cratered today by 13%. I still see them as a buy but not right now. Stocks in general do not excite me. Energy is my focus for now.
LOL NFLX management making up excuses already!………I’ll repeat what I said last year. NFLX are in one of the most overcrowded and competitive spaces going that will see margins get ever more tightly squeezed over time.
Expect many more excuses in the future as I believe that their abusrd valuatiion will never ever come even remotely close to justification,
It will go down as one of the poster child stocks of this bubble.
That seriously has to be one the most lame excuses I have ever heard for a miss. I hope for their sake they use a little more imagination in any future shows they produce!
Allan, Are you saying you have an issue with a PE of 250??? Sounds like good value to me. I say buy the dip then get the chips and watch a movie. `,~>
Short squeeze this afternoon smacks of a C wave on smaller scale.
If we do not close significantly above Tuesday’s highs then it means we may be starting to build triangle or other consolidation pattern that can last until the Fed.
Bunell on the S&P I couldn’t see 5 waves down from Tuesday but on the DJIA (which is the one I follow & trade) there are clear 5 waves down. Also the up wave today since last night’s close is a clear 2 waver for the DJIA (up till now).
Given a lack of a clear 5 down on the S&P and the high today above tuesday your call seems reasonable for the S&P.
However I’m struggling to reconcile it with the DJIA count.
Any thoughts on that discrepancy?
Let’s wait until end of the week to see how the pattern develops. But I think that the market is not in the position to drop immediately. Rather we should see some consolidation with final exhaustion move, possibly back test of SPX 200 DMA. It is all about the Fed, again. Hopefully that trust in the Fed will evaporate sooner then later
Still not a single large company reporting top line growth. Sure they are squeezing out some profits, some just meet their target, others warning of reduced expectations. I still do not see how a bull can continue if earnings reports continue to lack top line growth. I have not sold any stocks since last week, but if the market does mange to go up, I will be selling again. Today did not show bull to me, it did not even breach the high from two days ago. Maybe tomorrow will give a better queue on short term direction. If by miracle this keeps going up, I am a seller. Oh wait I said that already. Just saying it again. Cash is KING for me.
Oh, what I do find interesting is that the companies that warn or do not meet expectations: NFLX, STX, WMT. It seems they are getting punished severely. Much more than usual. That and one other thing that bothers me quite a bit. Mergers, the kind that are good for short term book modifications seem to be pretty high. I have not studied this with data, it is just a feeling. But my feeling is that companies are consolidating rapidly and doing so in an effort to make their numbers look as best they can. This is yet another sign to me the market is in big trouble. AND even with that magic accounting trick, the earnings are still not good. Hmmmm, interesting times.
IBB chart looks ripe and ready to drop. Looking to buy CELG if we get a BIG drop in the Bio-wrecks. $90 price target for buy.
http://www.screencast.com/users/springheel_jack/folders/1510/media/0d604773-4bd3-43b9-b3be-91125bd9cb9d
Interesting comments on skew here.
I’m mentally prepared for more upside, possibly re-testing the Fed spike high level from a few weeks ago. But just as likely we fail at a lower point, and quickly take out Augusts lows. On this occasion I will take a risk that the bull resumes, just seems improbable to me.
Of course we are nearly at the Fed high right now.
Too much sun.
Bob Wenzel really made my day today. Please read this article over at EconomicPolicyJournal. It says, in part:
“Former Federal Reserve chairmen Ben Bernanke was in San Francisco last night.
In conjunction with the promotion of his book, The Courage to Act: A Memoir of a Crisis and Its Aftermath, he appeared at the Commonwealth Club of California in a Q&A format where he was questioned by Michael Moritz, Managing Partner, Sequoia Capital.
I was stunned by the way the Q&A began. Stunned.
If there is a clue as to what government officials are concerned about by what they go out of their way to lie about, then it is clear that they are very concerned that American citizens may not believe the US government has the gold it claims to have in its vaults. That is, gold that is listed on the financial books of the US Treasury and via Treasury certificates on the books of the Federal Reserve.”
http://www.economicpolicyjournal.com/2015/10/ben-bernanke-visits-san-francisco-to.html?showComment=1444925246073
Options pricing providing a clue that we’re at (or very near to) the peak of the second chance rally:
http://www.zentrader.ca/blog/thursday-evening-options-brief-08-oct-2015/#more-26036
Everybody out there seems to be expecting: renewed bull, gold breakdown, Fed easing, weaker dollar, commodities bottomed, EM to recover, China to stimulate and continue to grow.
When I say everyone, I’m referring to traders on blogs and the mainstream media.
Hardly anyone sees the potential for a big bear seen here. We have a nice edge I believe. Thanks to John and many of my fellow posters. Not being a trader myself, I’ll add my usual tip….get some real physical gold for your later years. If you’re already in your later years, get some anyway. (Purvez 😉 )
Am on my way to the airport and saw this. Here’s my response:
🙂 🙂 😉
Look out for the last one!!
GM, just to clarify, it’s a bit too early for my trader instincts. I’ll let you know when I’m ALL IN…..promise… along with ‘why’ in EW terms…which is all I understand with my 2 brain cells. LOL!!
Oops just realised that I hadn’t mentioned that I was talking about gold….but you guys knew that eh?
I agree with you GM, there is some shit about to come which makes us go lower than the August 24 bottom!
Cheers,
W
Whazzup,
Give us some more info on your thoughts!
Earnings: The trend continues. I have yet to see revenue growth in a large company.
GE – Revenue Fell
HON – Revenue Fell
MAT – Revnue Fell
SLB – Revenue Fell
AMD – Revenue Fell
WYNN – Revenue Fell
JaFree, what an amazing contra signal….NO? OK I’m joking here, I hope. LOL.
Wait….. I thought a Contra was a Central American Jungle fighter No? `,o)
Touche!!
interesting cycle symmetry over the last 10 month pre/post monthly op/ex
http://www.zerohedge.com/news/2015-10-15/what-happens-next-hint-nothing-good
ties in nicely with Peggy’s October spiral projections and current chart resistance just above at spx 2035-50
Scott I saw that yesterday and it looks good for a drop after today. Hence i closed my longs today and am not positioned with a short. Lets hope that graph stops working now that its been discovered….
Obviously I mean doesnt stop working!
Looks like Corn’s Elliot downward corrective “C of 2” came in today and should Drought expand in India, South Africa, and Brazil a strong rally in an Elliot much-sought-after 3rd wave is likely to happen:
http://eldoradocountyweather.com/climate/world-maps/world-drought-risk.html
As of today Chicago Wheat has also made an Elliot corrective “C of 2” lower to its .618 fibo just like Corn has done. Russian and Ukraine dryness of their Winter Wheat areas points toward an Elliot 3rd wave rally in Wheat too.
Keep that Corn: Basis is rising:
http://www.agweb.com/article/keep-that-corn-basis-is-rising-NAA-tanner-ehmke/
And that points to a reviving US ag market/stocks.
One of my favorite technical haggards, Louise Yamada, warning to not get comlacent. I do not follow her closely, but I always find her comentary interesting.
http://finance.yahoo.com/news/bear-claw-strike-market-again-110000393.html
Demographic data…
Click to access Key_Findings_WPP_2015.pdf
http://esa.un.org/unpd/wpp/
The way it looks this week, next week the Shorts could panic and cover thereby sending US stocks much higher.
This rally was mostly short covering. There are very little shorts left to cover so any big rise would be the result of a lot of new buyers.
But doesn’t SPX look like it made the perfect ABC wave up, and so wave 3 down is next?
Flat wave 4 is finishing. 5 Down is next.
Cheers,
W
Or it could be wave 3 of 3 of 3 of 3 of 3 of 3…
🙂
Take note:
http://stockcharts.com/h-sc/ui?s=%24TRAN&p=D&b=5&g=0&id=p71055365993
http://stockcharts.com/h-sc/ui?s=CAT&p=D&b=5&g=0&id=p81097489598
The broad stock bull ended months ago. The gold bull began months ago. Both coincided with a toping pattern in the USD.
Investors will be dragged kicking and screaming in denial as gold climbs hundreds of dollars higher while they await the next wack down that won’t come and whilst expecting the next huge upleg in the USD………which again, WON’T come.
Broad denial and scepticism is how bull markets begin.
Also of no coincidence. The USD forming a bear flag under the 50 wma whilst gold consolidates above its 50 wma and 200 dma.
PALS is showing short term weakness until at least Thursday’s open in SPX. Fully short at close on Friday after being fully long with leverage into Friday : ). Will post full info. in next posting on this site.
Any support level that you are looking at next week? Thanks!
1945 on SPX would be my guess.
Valley,
I Agree this site is offering very interesting information looking forward reading your and John Hampson’s next post what your thoughts are on the market.
I would not be surprised if we see a big dip this week and after that rebound till end of the month after that november will be interesting if the sun/jup cycle will be in play just like 2014 and take us by surprise
Nice weekend
By the way, I really appreciate all of the posts on this site. Very insightful.
And the next thing is a move from HST to Instant. That should enable total certainty of total control to the one that gets there first. Game over….
http://tinyurl.com/p568kre
The Bull Market in American Stocks is “firing on all cylinders”:
http://blogs.barrons.com/stockstowatchtoday/2015/10/16/no-ordinary-rebound-stocks-gain-for-third-week-sp-trades-highest-since-august/
Barrons, yes, they are a great contrarian indicator.
Thanks Richard, down in a hurry then.
New post out