
A recap of the big picture.
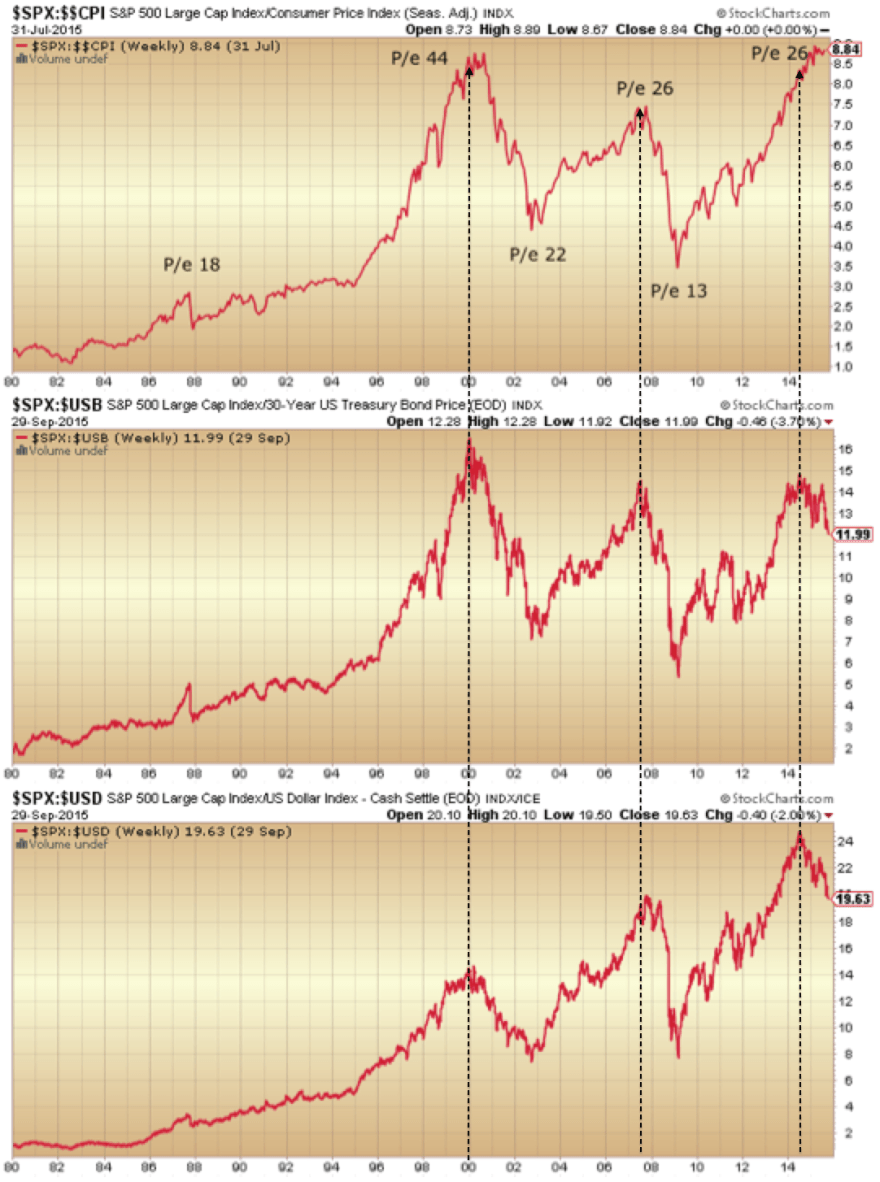
In 2014 around 40 stocks bull market top indicators gathered. The list includes valuations, leverage, allocations, sentiment, money losing IPOs, buybacks, breadth and risk divergences. Collectively, they depict what we just experienced as the second biggest mania of all time.
Here is the SP500 price to sales ratio reaching a record in 2015.

Now understand that the Nasdaq price to sales ratio escalated to 6 at the 2000 peak but the Biotech (poster boy for this mania) price to sales ratio reached 10 at the 2015 top.
The caveat to all the above is that conditions are historically anomalous: low inflation, falling commodity prices, ultra low interest rates and QE. Nonetheless, conditions were indeed similar to this in 30s US and 90s Japan and tellingly both bear markets and recessions occurred, i.e. stocks did not need ‘repricing’ or otherwise recalculating.
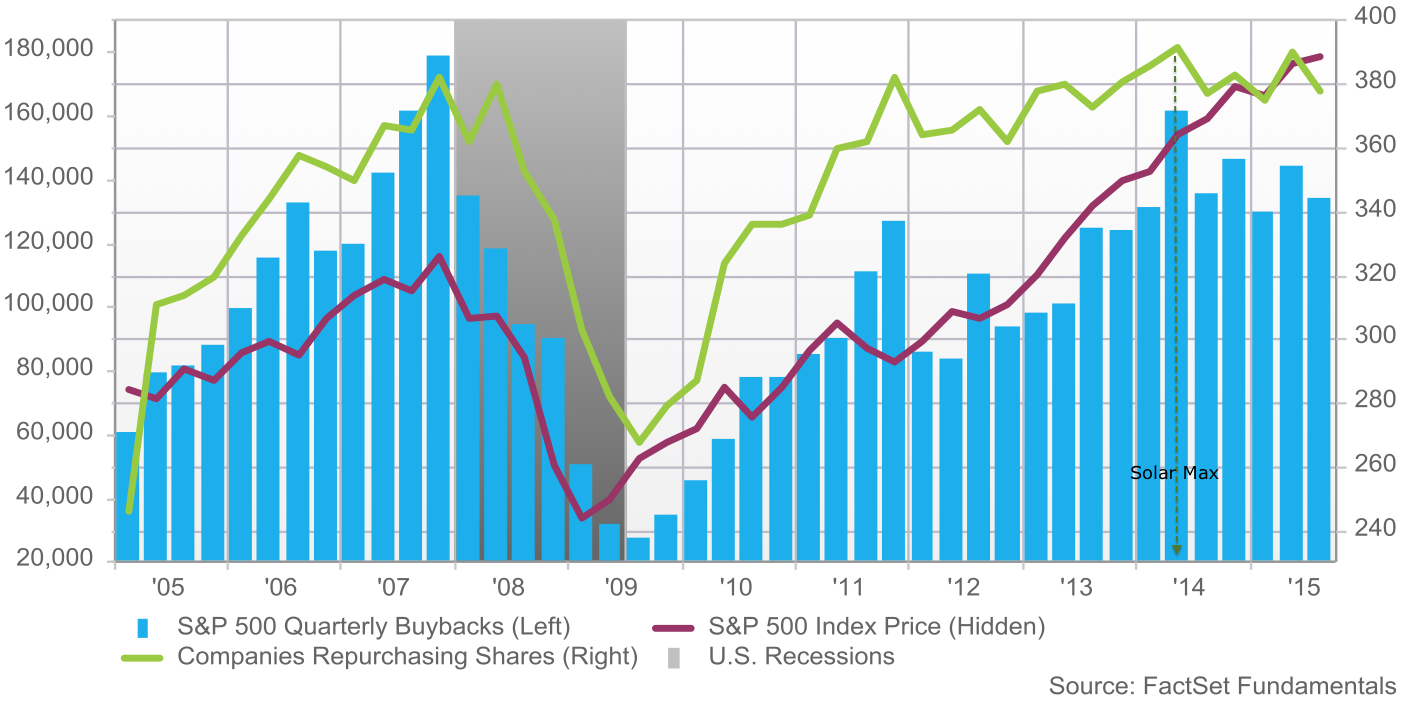
Add in the solar max for timing and we can see that under the hood multiple financial and economic indicators peaked out mid 2014 along with the solar reversal, adding to the likelihood that we are now in a bear market and heading into a recession.
The mania burst in August, with a fairly vertical 10% price drop. Certain indicators that had been stuck at extreme bullish (contrarian bearish) fell sharply to low levels. These include sentiment surveys, put call ratios and inverted volatility. Based on the new readings in these indicators, some analysts are calling for a price bottom and bull market resumption. However, be aware that certain other indicators such as valuation, leverage and household allocations are still very high and a long way from mean reversion.
Many depict what we are going through as similar to 1998 or 2011. So here are the charts.
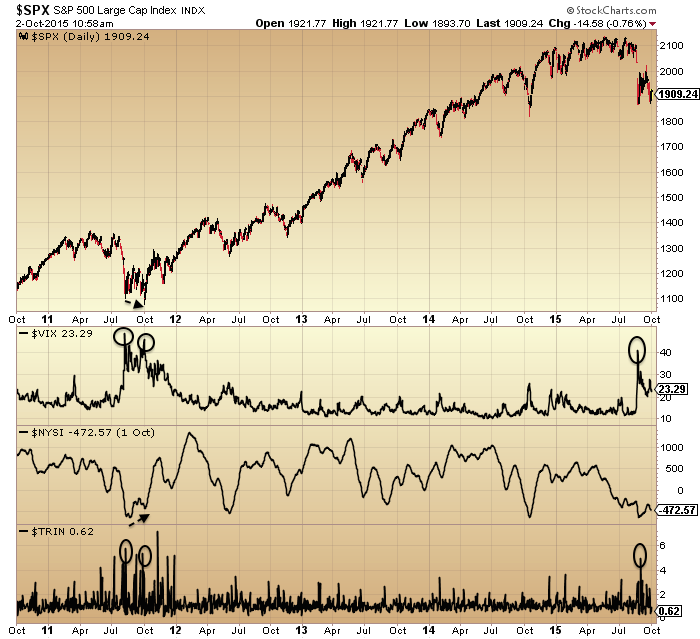

In both instances price made a lower low on a second capitulation reading before taking off again. Bringing us right up to date, the price reversal of this last week did not occur from a similar high volume high fear secondary low, which may mean a lower low is still ahead.
As an example of that partial case only, here is bullish percent to call out showing a suitable washout but volatility to stocks not there.


However, rather than 1998 or 2011 I think a more pertinent comparison is a bull market mania peak, such as this:

The arrow denotes a possible analog. The sharp declines and post sharp declines stabilisation are similar, followed by a couple of days rally into the arrow that then failed.
Should last week’s price recovery instead be built upon next week and through October, then we may be looking at a slower bear market initiation, whereby we perhaps head back up towards the 200MA like in early 2001 or 2008 before rolling over again.

At this point I give negligible odds of the market resuming in a bull market and making new highs. Understand that we saw max saturation in terms of allocations, leverage and buybacks, whilst we have negative demographic trends in the major nations meaning a shrinking buyer pool. For prices to rally to new highs from here we would need to see allocations and leverage break to new collective records. The bursting of the mania that we just saw makes this very unlikely, plus buybacks peaked back with the solar max.
On the flip side of equities, gold and miners have been either basing or languishing: which one is yet unclear. Yesterday may have been a key day as they both rallied on the poor jobs number and did not then reverse, unlike equities. So, we see how they develop next week too.
Earnings season kicks off again this next week.
My positions:
Short Biotech – I see the mania as burst, the parabolic broken and the second chance done. Therefore, I expect hard and fast falls to resume here promptly.
Short R2K – the R2K reached its highest ever valuation at this peak and history suggests small caps should retrace their full gains under a bear.
Short Dow – more likely to hold up than the others but a lower high or sideways range trade are the most bullish outcomes that I can conceive.
Long Gold – has been unnervingly weak but I continue to believe it must be the beneficiary once stocks are more clearly cemented in a bear.
Long gold miners – new position as indicators depict washed out and positive divergence. A position on which I will rigidly use stops, however, due to uncertainty as to how this asset performs if stocks break lower.
To finish here is US equities on a longer term view:


John Hampson,
Just wonder if you have any thoughts on yesterday’s intra-day
US reversal?, many thanks.
My suggestion: the markets bottomed tues at an obvious bounce point of double bottom (some indices above some below) and then got into rally mode. The poor jobs report blew the market temporarily off course but only briefly then it got back into its rally. They key is how far and long the rally now stretches.
Hi John
I dont think the low is in this fall. 1998 and 2011 are possible analogs, but I see a better comparison in 2000 and 2007. If so we can look at Nov 2000 and Feb 2008.
Looking at last weeks SPX, we could have a typical ABC correction pattern. On avregae they are 8+4+8 days. So far A=8 days, B=4 days. The bounce-B will typically end around 20MA, which was 1944 on Friday.
So either the C-down begins on Monday-Tuesday. In bear markets however, the patterns are often more irregular than in bull markets, and we may not get the typical 8+4+8 ABC. We might do a bigger B-up, which results in a bigger C-down.
From my shorter term solar cycle work, we have 3 cycles to look at:
-the 13 month cycle (induced by Earth-Jupiter) points down to around April 2016
-the 6 month solar wind cycle suggest a low either in Oct or Nov
-the 4 month solar flux cycle had a low mid-Sept and the next low mid-Jan, then May
It is not easy working with these three cycles, and some experience is needed. My interpretation is to look for a low around November, which will correspond to the Dec-2000 low and March-2008 low. Then a high/shoulder around Feb, and a deep low around May-16.
this is SPX compared with 2000 and 2008 (calendar days) and syncronized by the ~6month cycle. We can see a possible low around 40CDs from now, but short term we could still bounce a week or two…

Thanks Jan
Thanks, Jan. Very good data. Interestingly Jupiter cycle corresponds to Chinese Zodiac in lock step. Jupiter in Virgo is always year of goat which are slim pickings for stock markets on 100 year time frame. Please continue to post because I have never heard of solar flux having a high low intrayear cycle and that seems important for market timing.
Many thanks.
Weak Father Sun is limping along with the assistance of Strong Mother Moon. The past two Northern Hemisphere Winters were so cold that the USA suffered economically. But this Winter will be warm with continued low energy prices and lower food prices so the Consumer will be “optimistic” and willing to “expand credit” (Elliot Wave principles). This Winter will be a party winter as the good times roll. The “real” economy won’t top out until the transition between the El Nino to La Nina which will be in July, 2016, so that the “false” economy called the stock market will top out six months before which is January, 2016.
Similar crashes from the past:
Sorry, I only meant to provide the link to that article.
LOVE THE PICTURE!!!!
Richard,
I understand your meaning on Weak Father Sun, but educate me on Strong Mother Moon. Why is the Moon particularly strong. Is it related to the Metonic cycle? What makes it strong versus weak? Thanks in advance,
SC
The Sun rises and sets from extreme North to extreme South every year. The Moon does the same except that it takes 18.6 years and goes 5 degrees further North and South than the Sun does. This is the Lunar Declination Cycle.
There are four El Ninos in every 18.6 year Lunar Declination Cycle. At this point of that cycle the Moon rises and sets near the Earth’s Equator for three years. This is where the most powerful of the four El Ninos occurs and is occurring as predicted. Powerful El Ninos usually are followed by powerful La Ninas. This produces a one-two punch to the Ag markets.
It now looks like that the El Nino is sending Rough Rice and Sugar into major Bull Markets but that it is going to take the coming La Nina to do the same to the major Grains.
Earth is already going into a Mini Ice Age which is why the last two Northern Hemisphere Winters were so cold. This El Nino is going to give the illusion that the Mini Ice Age is not going to happen when in fact it is but is only in its earliest years wherein a powerful El Nino can still overwhelm it but from 2017 onwards everyone on Earth is going to know that Cold is on its way.
The Solar Cycle is part of a much larger Cycle: the Mini Ice Age cycle (about every 200 years). This Solar Cycle is the weakest in one hundred years and will be the last for the next three decades.
To understand why I consider the Moon’s cycle to be strong and the Sun’s cycle to be weak requires an understanding of the Principles behind the Elliot Wave counts. It is my opinion that at this time the Moon’s influence of the Human Herd’s flows from pessimism to optimism is greater than the Sun’s influence from optimism to pessimism. This means that credit will expand and part of that expansion of credit will drive stock prices higher.
Thank you.. very interesting.
Richard, You consume massive amounts of real estate in the comments. I still dont know what the heck you think will happen in the next ten yrs bc you have a new permutation you feel strongly about at high frequency. Can you summarize your thoughts ?
Thanks, Richard. the moon does seem to have more influence in earth’s weather, etc. than is commonly understood. Greatly appreciate your data on metonic cycle and equatorial crossing adding a predictive tool. Monthly declination is one of the elements of PALS and is potent, so makes sense that 18 year metonic declination cycle would be something to consider. No wonder Gann was moon only last few years of his trading career.
I did not even read what you wrote yet Richard, but as a wxguru, there are a lot more tiers besides just the lunar declination, yes it is involved, but you have to factor in physical sources of energy and chemistry, and well as photons driven fields aka electromagnetics. Furthermore the position of the Sun relative to Earth is key; actual position and gravitational force exerted by other planets against a non-solid surface. Just science here, no astrology.
Glad you are back in the crash 2016 camp and not the 2026 camp.
Delta is a 19 year 5 hour cycle of the Earth, Sun, and Moon limited to a geometric plane or 2 dimensions. Within that cycle there are “waves”. The largest wave count is 14 points/waves for stocks. Point/wave 14 was the high before the crash in 1722, 1929, and 1987. In 2006 there was an Inbetween point after point 14 that made point 1 in 2007 the high point instead of the usually low point after the crash. It doesn’t always happen but the cycle points to point 14 due in 2025 to be the highest point of the 19 year cycle before the 19 year cycle crash.
Very interesting. Thanks for this.
Intriguing…..can you show even a rough graph of this?
Excellent post, John. Shows clearly the potential for sell off in equities based upon their high valuations and peak in solar cycle.
Thanks Valley
Thank you John.
In regard to Au. Whilst Friday’s bar falls just shy of an outside reversal to the upside it is pretty impressive nonetheless.
Ag even more so. There is a huge wmount of scepticism toward Au and Ag, even on this board.
I suspect that most will fail to climb aboard until we are much much higher.
http://stockcharts.com/h-sc/ui?s=%24GOLD&p=D&b=5&g=0&id=p40333296438
I have never seen investors complicate things so easily. Whyiisitso hard to buy low sell high. You will never ever EVER consistently buy the exact bottom or sell the exact top.
The PM metals complex are a buy, the stock markets and real estate are a sell. Accumulate bottoms, distribute tops.
It really is that simple.
Hello Allan.
Armstrong having a dig at you with his gold chart in Aussie dollars showing it declining.
He will catch a few dopes who don’t realise the chart is from 2013.
Poor guy, has serious issues.
Meanwhile, glad I got rid of my shorts a few days ago, but keen to sell this recent rip shortly.
Armstrong alludes to his benchmarks again for golds final low, his box chart shows the second of those in January, the first has past.
GM, the guy def has issues and I have major reservatiins regarding his true intentions.
He is making a motza from selling his reports, conference tickets etc, and I susoect the reason he has resorted to that is because he knows as a trader he ican’t hack it.
Never forget that whilst he tries repeatedly to deny any wrong doing from his hedge fund days the fact remains that his fund made huge losses. He has stated that he was not responsible for those losses and has blamed others and one thing I have come to learn over the years how “egotists” refuse to ever accept the blame for their failures.
I have followed MA for nearly 30 years when he first came to prominence after the 1987 crash and whilst he has made some great calls, that is exactly how he has made himself so highly read and followed.
He beats the table and makes really “outlandish” forecasts and statements. One reason he loves gold and talking about is because he know it raises eyebrows and gets attention.
Bottom line mate, I believe there is anulterior motive in their somehere.
Cheers
PS Aussie goldies had another stong day. No doubt he would try to deny that as well.
Make no mistake MA is very clever and I have no doubt that he will miss the bottom in gold just as he did the last time when he advised investirs not to buy until it crashed under $200.
I also have no doubt that he will spin it to make himself look like a genius anyway, because that is what very smart manipulators do 😉
What would posters on this site think if every time the Demographic argument had been used to back up the Solar Cycle argument that the greater Solar Cycle argument of a cycle over 200 years with the current SC as a very weak one was used instead?
Wouldn’t it be more correct to only use the Demographic argument when the full SC argument was used, and that means to point out that the current SC is weak, instead of leading others to believe that it will be as strong and as accurate as several recent SCs?
I don’t see a compelling correlation between the intensity of the solar cycle and the market bubbles in the past.
ACCURACY is a problem with Delta’s Super Long Term points. It takes 30 data points to compute a proper Standard Deviation and that would require about 600 years of accurate data of stock prices to correctly compute Delta’s standard deviations for each Super Long Term point.
If you don’t see a “compelling correlation between the INTENSITY” then how about a “compelling correlation between the ACCURACY” and “the solar cycle and the market bubbles in the past”.
That one is not a full ‘proof’ in the logic you inquired. You cannot use a full demographic always with a full solar cycle pattern; here is why:
Research depicts a peak in solar cycle leads to more erratcism, and hence higher birth rates, same as disease; counts in wildlife have shown similar behavior. John, have you looked at that one?
In addition to the peak yield births, troughs show increase in deaths. Peaks also kick off political intolerance which typically results in wars. This can further alter the demographics of say, middle aged men. This impacts a woman’s ability to find a suitable mate. All the soldiers come home after WWII, no more riveting, now baby making. There is a book on amazon that speak to how a population boom over its life cycle has an impact on different economic and political activity; young to liberalism; older to conservatism; birth rate of this demographic relative to its own offspring (birth control, abortion, antibiotics), could go on, etc.
Elliot waves are interesting, but absolutely cannot count for an entire picture.
Here is the book, more fascinating the the plethora out there:
http://www.longwavepress.com/bbgxscv1cont.htm
you need an huge supply of erasers when using delta…….beware
Talk of gold in Aussie dollars had me take a look and I see it fit my 62 month up and down cycle in OZ since the bear low of 1982. Often its exactly 1884 cal days. The last low was due Jul 6 2013, which looks like where gold bottomed. The next high is Sep 2 2018 for what its worth.
This is simplistic but it may be profound: Is a Double Bottom in Copper pointing to “the worst is over and let the good times roll”?
Have hemlines (female dresses) bottomed and turned back up?
BANG! Like I’ve said before this bear market is going to be incredibly frustrating. Short term swing shorts will be the way to go as there will be many sharp rallies.
Richard I, A strong La Nina is only correlated to a strong El Nino about 50% of the time. I wouldn’t count on that just yet. The winter in the US will be much more normal than you think. It will be brutally cold in the south and could have some big snow events as well. The east coast with most the population will be colder than normal. The analogs for the prediction are similar to ’57-’58 perhaps. If that analog sticks with the ocean temps that look similar, there was not a La Nina after the El nino. Having said that, I still think it is too early to call. I expect Nat Gas to spike this winter on a stronger than CPC predicted winter. The CPC is horrendous on long term predictions and for some crazy reason, the market follows those predictions. It is a good for those that see the errors and trade it. I expect Winter storms to cause the spikes.
Calling ALL (any?) Martin Armstrong fans. He was supposed to have given a TED talk on Oct 3rd 2015. I can’t find it on TED. Anyone here have a link please? Thx.
purvez, don’t waste your time. The guy is a genius at spin. Stick to what John Hampson does better than anyone I have ever followed.
John’s research is the best of the best and he gives it or free!
I said it in an earlier post. Whu do investors complicate what is essentially easy?
Buy and sell at extremes. We are at extremes in both PM’s and PM stocks and broader stocks. Major reversals are underway in both amd will take time to become fully evident but expect some further big moves anytime soon in the direction of those new trends.
Despite the last few days strong move in broader stocks todays intraday charts are screaming distribution.
BTW that distribution is right where you would expect in a bear market. Right at the declining 50 dma.
Yes Allan, you are ABSOLUTELY right. However timescales matter. I (for various reasons) trade daily / intra day. You have the luxury of trading over decades.
One day I hope to be in your league.
Valley,
are you planning shorts or is it too early? wait till wed?
Wed at the earliest for me. Will not short much this week and only intraday.
Valley,
Any idee how next week will look like entering new moon at Okt 13?
I am playing this week as bullish, and from New Moon(Tues) open plus three days as bearish.
Today’s parabolic rise since Friday’s low seems more like a ‘C’ wave rather than a 3rd. I’m beginning to think that we are in a triangle since the Aug 24th low.
IF we are in a triangle we are completing wave ‘c’ of the triangle (as long as it doesn’t go above 16920 on the DJIA) so we’ve got a ‘d’ down (but one that stays above 15920 on the DJIA) and then an ‘e’ up to complete which must stay below wherever ‘this’ wave stops.
Hope that makes sense.
P.S. These are HUGE swings but very difficult to trade. You need to stay on top of the ‘action’.
Primary wave [4] likely has bottomed, might have ended, might be forming a very large triangle. This cycle chart has been spot on calling tops and bottoms. I’ve shown it before and warned a pretty rapid sell of was predicted. so far it looks to still be on track.

Can you give us a primer on the two waves indicated in your chart? Does each wave have equal intensity? The probably effects of these waves convolute with a sequence of scenarios I rehearsed when i was still bullish in mid 2013. I do not anticipate a “jaws of death” like some do, at least in nominal terms (in real terms it’s very probably with the demographic tsunami coming at us)
Some VERY suspicious trading has occurred since Friday morning and say suspicious, because it has all the hallmarks of “intervention” as some level.
On Fiday as the indices were on the cusp of breaking down from a very bearish flag. With momentun increasing to the downside and a potential double bottom break looming thatwould have sent stocks crashing……….. suddenly, out of nowhere buying?
That buying has since been relentless. Some would say nothing but short covering? The fact is however, that the algos have become masters at leading investors in one direction only to whipsaw them in the other as they are now doing so again, or so appears to be the case.
no conspiracy, just social behavioral patterns at work. we called the bottom last week
alpha, this type of action used to occur infrequently. In recent years it has become increasingly common and I suspect will continue to become more common as algos trade against brains.. There is far more to it than just social/,psychological behaviour.
It also one resson I gave up short term trading.
you and me both, I only swing trade now. But my System went long last week, I’ll post some captures of it after the close today
Actually, I have the DOW long since 8/27 AND Real Estate, which is often the leader long since 9/17 (see green B). The Real Estate is leading in bullishness. It closed strongly over key resistance, now support in the red/green indicator. The leading equities like the DOW are testing it. if it breaks, then look for new highs.
i don’t get this site, i just tried to post some charts and now it’s awaiting moderation. did i do something wrong?
here’s the Real Estate index long since 9/17. It closed strongly today over the red/green indicator, which is now key support https://alphahorn.files.wordpress.com/2015/10/real-estate2.png
My system has been long the Dow since 8/27, see green B. It flirted with a short, but didn’t confirm one.https://alphahorn.files.wordpress.com/2015/10/dow2.png
Seasonal Buy Signal triggered on Friday: (Buy when MACD==12,25,9) is positive on SPY on or after Oct 1.
LMAO….
Valley,
did you mean bearish from oct13 (new moon) ,next 3 day as bearish.
Bill
If I was short at this point I would closing all of them until this bullishness comes to pass. been caught out too much in the past with how extreme these counter moves can be in both directions.
Good call Krish, you’ll be a great trader yet.
Yes, that is what I am looking for.
I am expecting ES contract to rally further in C-wave of A-B-C correction from August lows. If C=A (272 pts) which is common then it gives 2042 as target. That would roughly correspond with SPX 2050 which means that 200 DMA will be finally backtested. That will also test lower range of 2015 top consolidation box.
All that should happen right before FED meeting.
After that, we should be ready for either C or 3rd wave down that should complete somewhere around 1570-1600
Correction – C-A=180 pts and not 272).
272 was initial crash from 2103 top to 1831 bottom. That should be extended by 1.618 in next stage
I may be premature, but opened a short on the Ftse this morning.
Can’t see much more than another 150 points of upside, if that.
Will add more on any further bounce.
Suspect a trap door will open suddenly.
Thanks Valley,
That should be in line with the next Mercury max elogation west?
Do you think the retrace we are making is going beyond Sp 2020 and setting us up for a bigger decline?
Max elongation west often is good time to avoid long positions for about 20 trading days. Seems market lacks buyers so up moves will probably be muted, yet 2020 by next Tuesday could be. However, October 15 to 31 is probably the most bullish seasonally of year due to setting up for holiday shopping season. So I won’t be too excited about being in cash from October 15 until latter part of November.
Fortress Investment Group LLC told investors that the emerging markets are at a beginning of a bear market that could rival the Asian financial crisis of 1997.
The sell-off in emerging markets, which began in June, has led to a credit contraction that will last until at least March 2017, according to a letter to investors in Fortress Convex Asia Fund Ltd., signed by Singapore-based Chief Investment Officer David Dredge, and fund co-managers Nicholas Heaney and Andy Wong. Fortress said it used past economic cycles as a guide in evaluating the current market.
Mood for no Fed rate rise since jobs report. Uncertainty about Draghi adding to interventionism. Otherwise dehydration caused by salivation.
In respect for those who respect me: I am going to start posting less on this site.
I have changed my Delta Grains rotation such that a low Medium Inbetween point brought in their low Long Term 5s –and– that their high Medium 1s is bringing in their high Long Term 6s …early. I now am looking for their low Long Term 7s to be the bottom of the Grain’s Bear Market which is due the next Northern Hemisphere Spring/early Summer (2016).
El Nino’s pump moisture into the Americas and that includes South America which is beginning it’s planting for their next season’s crop. “Rain makes Grain” is the old adage and that applies to South America and not just North America. The El Nino is expected to continue getting stronger for several months to come. This points to a very large South American grains crop on the heels of one of the largest North American grain crops.
I am short the Grains. (There is a difference between the “Softs” and the “Grains”).
Thanks Richard, and good call so far on stocks rallying to 1/2016 too.
No Arguement on the rain and I will leave the grain call on the expert, but the El Nino has peaked and it is turning out to be a strong El Nino and NOT a super El Nino. Be careful of weather sensationalism, it is rather ridiculas these days. Some of the better forecasters predicted this El Nino far better than the NOAA CPC. And they do it with Analog History as a guide.
Thanks, Richard. I have learned a lot from your multithreaded analysis.
I am pretty perplexed as to why so many analysts are stunned by the collapse in Australian Ag output.
I said back in January to expect BHP’s Ag production would plummet, in no small part due to its Cannington mine (now under a different name).
Expect further declines and continued increased buying in Ag going forward. Perth mint are producing record levels of new 1oz Ag Kangaroos.
The gsp between reality and the fantasy paper market has never been greater!
Clarify that. Expect further declines in Aussie Ag output. I also expect however that the gap between the obvious fraudulently set paper price and physical price will soon be blown to smithereens.
Hehe Allan is there a way of playing the ‘physical to paper’ spread? I’d definitely go with that one.
p, possibly but to be honest I haven’t given it much thought. I am pretty much vanilla when it comes to investing. I don’t like complications.
One of the issues for me in the last decade or so has been the increase in the complexity of that in many cases makes it impossible to ascertain and price risk.
I remember just over a decade ago many non-US miners were using complex currency hedges and spread bets against production, in some cases years in advance. Most when asked what their exposure/risk was, didn’t have a clue.
Needless to say most went under.
KIS.
Biowrecks are still candidates for that 85% decline from the highs
somebody was looking to get in them a few days ago – hope it was just a short term trade
Agreed, Biowrecks as a sector are getting killed and I expect more. CELG is the baby in the bath water and is making money like crazy and growing fast. look at the recent rally relative to IBB. They out perform the IBB and they fall into my category of value right now. However, I am hoping for them to get slammed in IBB wash for even better pricing. Watching closely.
People, I had originally said yesterday that the up move ‘then’ looked like a ‘C’ wave rather than a ‘3’ wave.
Well after today’s sort of decline and high I’m going back to thinking we’ve completed a ‘3’ at today’s high. Now once 4 finishes we should get yet another high (No idea where it gets UP to though).
I don’t know where this ‘4th’ wave will decline to but a 38.2% retracement on the DJIA will pull it back to 16535 ish. Of course MM’s are not going to make it ‘that’ easy.
I’d love to see an update to your OAS & margin debt chart
Just one point in RE to my previous and risk/exposure brings to mind the current situation with Glencore and their debt.
I doubt that Glencore reslly understand what their actual exposure is, nor does the market.
I conclude that the market will test any breakng point inside of three months.
Citadel are the guys doing the intervention work for the Fed, and judging by recent news stories are doing quite well out of it and are looking to expand operations. Just be careful out there, got rid of my remaining SPX long today in small profit as it has been underwater for over a week. The FTSE is hard to call right now due to the mining complex recent extreme upside, but if I had to decide now one way or the other would go short as GM has done. I am not seeing many clear opportunities right now, so am keeping the positions I currently have and waiting to see what happens. In my opinion Glencore is not out of the woods yet and oil could quikcly reverse potentially, although I have started to add energy stocks to long term investments. Allan was right in terms of no interest rate rise, could be a catalyst for a few weeks of bullishness but high volatility either way seems likely. VW likely too big too fail so watch for the height of bounce from such oversold levels imho.
If I was to make a medium term prediction, it would be that interest rates won’t cause a/the major decline, in my view it will be unemployment this time round.
GLA
J
Thanks, Jegersmart. Agree until mid October good time to be nimble and not have SPX long too many days in a row. Am expecting some green candles until New Moon, but will probably settle with break even.
Valley,
Can you tell us what’s in the cards in the PALS system are we gonna see a pullback
or a big dip after the new moon or a repeat New moon -full moon like September
so new lows arround Okt 27?
I see a pullback till Okt 19 and after that up again till end of the month.
Thanks in advance
Big day for Oil, let’s see if it can go more than a three day rally. Still alot of unknowns concerning all the factors. US production dropping like a rock, Demand increasing, or is it? Iran getting ready to come out of sanctions. OPEC feeling the pain of low prices. Overall, I think the we are near the bottom. I would have liked to see a retest of the low, but we may not get that. I still favor a break up, but I am not playing this space. Nat Gas is my space and rising oil is a BTU proxy to raise Nat Gas. Right now I expect oil to respond to news rapidly in both direction.
First rally off the August lows was c.150 SPY futures points, second rally was c.122 points, current one is c.122 points.
Hence, given I share JH’s view that we’re in a bear market and this is a corrective rally, I’ll add to my shorts tomorrow morning.
1980-2000 SPY looks like a band of resistance, even looking back to last year, expecting sellers to sell in this area now.
But I’m also thinking…should just be building my junior gold miners positions now rather than swing trading.
Shorters capitulating big time. Energy and mining also boosting markets. Unfortunately higher commodity prices will prove a drain on global growth worsening the outlook. I’m now looking to start going short as this bull leg is getting overdone. All the news will now read how the bull has resumed and the bottom is in. Perfect bull trap if this is going to be one.
Have a friend who has been completely wiped out by the rise of the last few days. The dangers of trading against the central banks! I’ve taken a small short at 16880. Hope markets drop before Nicolas comes back!
Central banks? Jeez, that nonsense still permeating around here.
When the bear is in full swing, everyone (perhaps) will see that the CBS are impotent, as they were in the 2000-03 and 08-09 periods.
It’s markets and maths and Mother Nature.
Ok then this recent explosive rally has nothing to do with central banks and all to do with investors suddenly becoming mega bullish due to no apparent reason.
John are you still short or sitting this one out? Waterfall decline scenario falling to pieces…..
It’s up to you what you believe Krish, free world.
But a cursory glance at the CBs loosening in the last two downturns shows they were impotent, it was just animal spirits running scared.
These big rallies are entirely normal in a dying bull.
I think you will find we actually are aligned. CB are impotent but short term can be rather powerful. I expect this bull run to die off soon. I’m just saying its stinks of some sort of intervention.
The UKX had been savaged by the commodity melt down,
so it has predictably bounced strongly with the rebound on crude.
The Index came within 4% of dipping in to a bear market in August
on futures.
It should become clear if we are in an early stage bear market
on major US markets within the next few weeks.
This Q earnings may be the deciding factor.
If that is the case my top window call, July-September 2015
will have been correct.
It was a guess based on the peak in the US cycle which I estimated
at Summer 2014, markets tend to roll over approx 12 months
following this.
But the market topped in May Phil, go check the charts.
Where might we be in days gone by? Perhaps a Xmas run to late Nov.
http://bigcharts.marketwatch.com/advchart/frames/frames.asp?show=&insttype=Fund&symb=MHCAX&time=13&startdate=1%2F4%2F1999&enddate=10%2F7%2F2015&freq=2&compidx=aaaaa%3A0&comptemptext=SPX&comp=SPX&ma=0&maval=67&uf=8&lf=4&lf2=2&lf3=32&type=4&style=320&size=4&timeFrameToggle=false&compareToToggle=false&indicatorsToggle=false&chartStyleToggle=false&state=10&x=7&y=13
Added another 1/4 of my account into FTSE shorts this morning.
I’m looking for a pull back on the DJIA to about the 16550 area…but then I’m expecting another final wave up of about 500 points before the correction from 24 Aug low is over.
Hello p.
That would be a 5th wave up I guess?
I could see 2020 on SPY in a final push, so will hold off placing more shorts for a few days.
If it falls, it’s then whether to take profits or hold on.
You back home again?
Hi GM, yes that would be the 5th wave. I’ve done a chart lower down which shows my count but on the DJIA.
Regarding taking profits or not….as a trader always best to take profits. If however you are thinking longer term then no need. Actually that argument has never sat well with me. If there are profits then take them unless your dealing costs make that not a favourable way of working.
Yes I’m still in Karachi but will be heading back next week.
NAS peaked in July, RUT last week in June,
MCX June.
Some of us can appreciate a decent call as your call
on yields describing them as a fake out was,
all be it they continued to rise for a few weeks after that.
But we are all guessing, some of us are aware of this
and others not so much )
My call was the end of Q2/ Q3 as the peak.
It’s all there, it can’t be edited.
That was a good call given how I thought Q1 2015 was the peak. I believe others thought so too, after the failure to crash beyond 10/2014, but I won’t throw anyone else under the bus.
If it gives you satisfaction to claim this ‘call’ Phil, I’m happy for you.
I never refer back to my comments, right or wrong, readers have memories, I am not a fan of blowing one’s own trumpet. Repetitively.
While I favor the count that primary wave [4] has bottomed. The blue count on the 30 min chart below is my favorite alternative. It has an expanding triangle forming for intermediate wave (B) of primary wave [4]. Once complete the blue count looks for five waves down to complete [4]. https://alphahorn.files.wordpress.com/2015/10/spx-303.png
alphahorn, since I’m in the camp which said we completed a ‘b’ wave at the May high my count from the Aug 24th low looks like this:
http://postimg.org/image/lwg6ad48v/
We are both expecting some highs from different perspectives.
you and daneric, that’s one hell of a b wave
🙂 🙂 You should see the ‘c’ wave that’s going to follow it!!
In this ongoing C-wave of Primary IV there has been rampant bullish action built on a quicksand of wrong-footed sentiment.
For the bulls the IMF gives sustenance to bad news = good news as far as Fed rate change is concerned. For the bears the promise of WW3 bearing fruit from the loins of the lion brained humanoids has a different flavor of saliva. Whoever wins humanity loses.
Short further 1985 SPX
Add short 1993 SPX
there are a lot of sky is falling guys on this site, but i believe that sentiment is premature. sometimes the simplest charts paint the most obvious pictures. Here are some monthly charts for the major equity indexes. The counts very clean for now and until the lower channel breaks, there is no reason to be expecting anything other than one more push up (imho of course).
Here’s the DOWhttps://alphahorn.files.wordpress.com/2015/10/dow-monthly.png
Dow:

AH, what would be your target for the Dow?
Here’s the Nasdaq:

Where the big decisions are being made (USD/JPY):
http://screencast.com/t/LjTVviDBhVvI
Bear flag? :
http://screencast.com/t/hHTKrn1tYu
GM what the heck is the second chart showing please? But I’d agree it’s a Bear flag of ‘whatever’.
S&P monthly purvez, I was hoping someone would ask!
the RUT:

THAT is a VERY VERY GOOD argument alphahorn. What’s your plan ‘b’ (no pun intended) if the channel breaks?
BTW if your ‘blue’ count from an earlier post holds true then surely the channel will be broken. How would you account for that, alphahorn?
I am keen to understand your answer here because it will give me yet another perspective. Something that I ALWAYS have an open mind about. Thanks very much for sharing these charts.
alphahorn, your charts are very impressive and have given me pause for thought. I’ve been examining your DOW chart in more detail (as that’s the one I trade most). Your wave [I] count doesn’t seem to have a wave-iii within it which is NOT the shortest.
Please I hope you won’t take my analysis as a criticism. I’m merely trying to ensure that I have as many perspectives as possible to consider. I know I’m not able to consider all possibilities and therefore an opportunity to consider an alternative point of view is VERY welcome.
Thanks in advance.
Something I’ve noticed about alphahorn is his inability to respond to questions. It’s almost like you either believe his ‘pronouncements’ or you don’t but asking questions doesn’t provide a response.
I hope it’s not something that EWers get which is catching. I certainly don’t want to be someone who can’t answer a question put to me about my analysis or worse get annoyed about being questioned.
and the SPX. all have found support and bounced off the lower channel

All channels/trendlines break eventually, hence I never use them.
Look instead at lateral support/resistance levels.
yes eventually
The rise needs to reverse soon or I think we will struggle to break August lows this year. Year is typically bullish so I expected a terrible October followed by a bounce in December
So the answer is no, Oil cannot rally for more than three days, but today was still a bullish sign for oil. If we break the recent Aug 31 high, we will probably head higher, otherwise we just raise the trading range a bit. The down side looks increasingly less likely, but the right news could send it down.
From one of my credit guys today:
But the fact is I’d never seen a 15bps turnaround for the better in 3 trading days, which is what IG CDX doing (≈ 150 $SPX pts). Crazy stuff…
********************
Market rally is extended (NYMO now up to 78) but the apparent improvement in credit markets has to be a sobering development for the bears. We’ll see if it lasts.
http://www.alhambrapartners.com/2015/10/06/is-the-dollar-missing-something-this-week/
Interesting conjecture on the lack of stress during the Chinese holiday, which ends today. Will recent dollar pressures re-appear, and kill the rally?
http://screencast.com/t/fBRZh17d7
H&S?
I am taking profits on my DOW longs and standing aside for now.
Nice trade Richard I. Hope you continue to have successful trades.
The DOW “looks” good but take a look at the NASDAQ. Triple Bottoms do not hold and the NASDAQ is warning that the recent rally is only an upward correction in the DOW as the NASDAQ fails to rally but goes back down to a Triple Bottom that fails as they usually do. This agrees with JH’s position.
Gold/Silver ratio popped today, an early warning of ‘risk off’.
USDJPY down today.
I added the 3rd of 4 shorts on the FTSE.
Reading a few other blogs, they are mostly bullish and think the bears have been sunk, they see no more troubles on the horizon.
Second chance for bull complacency?
Hi GM, but you do need a ‘firm constitution’ to suffer these gyrations. I do hope our ‘bets’ pay off.
Me too p.
Soon we will have an ice cold torrent of water for this rally, called earnings season. Let’s see how the bulls fare during earnings reports. I personally do not see anything good for the bulls.
10/8 9:52 Update: 7442 Spiral expecting 2021 and then down to 10/28 around the August lows. http://www.ustream.tv/channel/7442-analytics
I have started selling some more core holdings into this strength to build more cash and increase energy trading. If by some miracle we rally into end of the year, I will sell even more core holdings. Cash is King for me until this market has a serious Bear. I continue to be constructive in Nat Gas, even though it has not been great as of lately. Winter should create the trading spikes I am looking for and if oil starts rising, Nat Gas will have more upward pressure.
JaFree, thanks very much. Your perspective on the market is very much appreciated by me.
Thanks purvez, we all must remain humble for the market humbles all. Over the long term, I have made more successful calls than bad calls and I hope to continue this trend. It seems that the longer a person is in the market the better they are at improving your odds for success, but even then we all get stung. Just so you know I also enjoy the EW discussions by you and others.
Alphahorn
I don’t think I would be drawing my trendlines quitelike that, and due to the scale that could make a difference of 50-70 points on SPX – maybe more. How doesit look on a shorter timescale chart in your opinion?
Not saying you are wrong though but just sold the rest of my IWM longs.
imho
J
Treasuries rallying all over again?
http://finance.yahoo.com/news/wall-street-guru-nailing-interest-123836864.html
Note that weekly continuation charts of Ten year T-Notes shows an exacting declining trend line for over three years. “If” that trend line is broken then Treasuries could rally strongly also implying a stock sell off. Off course, the single “market” argument for Demographics is Treasuries over the past several decades. “If” Treasuries are “ahead of the curve” of Demographics –then– stocks could play “catch up” (to the downside) as Treasuries soar.
Here is another must read:
https://www.washingtonpost.com/opinions/the-global-economy-is-in-serious-danger/2015/10/07/85e81666-6c5d-11e5-b31c-d80d62b53e28_story.html
This report backs up John Hampson’s arguments.
Hi All,
I have updated the 17.6 week cycle date to include the anticipated low. As you can see it doesn’t line up perfectly like the highs, but it is still pretty good.
The low for this correction is forecast to be on 19th October 2015. For what it is worth, I think we saw the lows last week (29th September 2015) and am positioned long.
http://www.17yearstockmarketcycle.com/
ATB,
Kerry
Yet another day without waterfall declines. The wait continues…its getting to the point where I feel we actually need a global recession as confirmed by data for a waterfall!
Krish, we already are in a global recession…or rather have been for some time now.. The data only arrives ‘after the fact’ to confirm. Stay safe and don’t sweat, you’ll get your declines. Perhaps not Niagara style but still quite impressive.
Oh come on. Dow has smashed 17k. The recent bearish set up is dead. Must trade the bull leg we are in so its but the dip time again.
Krish, you ever think this is maybe a short covering rally?
I’m delighted to be in short within a couple of percent of current prices, and a final short to be added tomorrow.
Matters look very tasty to me.
Not sure now is the time to be chasing long mind, but each to their own.
Hello Kerry.
Somewhat odd that your cycle predicts a low in 11 days, but you *think* we saw the lows last week.
Of all people, I would have thought you would respect your cycles, otherwise, what’s the point?
A bitter irony awaits if you are wrong and the cycle is correct.
Hi GM,
As with all things, I know that sometimes they work, sometimes they don’t. I am not Mystic Meg and deal with probabilities not certainties. Cycles (be they solar, lunar or 17.6 are all fallible.
The worst thing that could happen is that I lose all my money, not that I am wrong. So I am long, but wary of the possibility of a decline. The low dates are not all spot on, so what we really have is a low window of opportunity which I captured nicely on 29th September.
I expect a sharp drop next week due to declination, perigee and planetary conjunctions. These also happen to line up with my cycle dates. But nothing is certain.
http://bobs-spaces.net/sky-shots/october-2015-multiple-conjunctions/
ATB,
Kerry
With exhausted gap in drive who needs reverse. May the algorithm with the most leverage wrestle with genuine manic tendencies. Freak echo of double top exactitude. How much to drive your planetary milking machine Kirk, just for 5 minutes so I can feel the power as it swamps all humanity associations from my feeble brain and makes me into like one of your spitballs. Will a Trillion do?
Man that feels good, see all those suckers squirm.
Cool, but I was more of a Picard fan myself.
At this time could it be that the two most important markets are the NASDAQ and Ten year Treasuries? The NASDAQ looks like it will fall to a Triple Bottom and Triple Bottoms don’t hold. Ten year Treasuries, last week, hit a three year trend line and look like they want to break above that trend line. Could problems with the American House of Representatives along with the Earnings Season set these markets off? Stocks crash and Treasuries soar?
I guess anything can happen…are you entertaining a market top call now?
17k Dow!! Small long at 17002. Run up to 17500 most likely now. Waterfall postponed to 2016.
For now it is all about the Fed. Until it is not and then the rug will be pulled away in most unpleasant way. I hope it will not be geopolitical event that finally breaks it.
Still SPX can make its way back to 200 DMA at 2050 or so. That would be great place to reenter shorts
If the ES contract gets above its September Fed high today then I will go with initial short even now. All that is required for C wave is to get higher then A was
Although ES contract did not reach 2011 (Sep high) I shorted into the close anyway. Top may be reached during Globex session and tomorrow we may get reversal. Gold also looking promising, they try to maintain it back in the triangle but when it finally closes above 1150 bears will run in panic
Year end rallies always possible, as people invest their bonuses…
Look no further than the chat below to understand WHY the market has rallied the last few days.
Last Friday the markets staged a sudden dramaric reversal higher as downside momentum was threatening to break a double bottom that would have sent the markets crashing lower.
I still say the likelihood is that there has been covert intervention in the last week to stave off a major market crisis on the heels of VW amd Glencore
http://stockcharts.com/h-sc/ui?s=%24SPX&p=D&b=5&g=0&id=p61947107112
When will such an intervention not be successful? It has been fantastically successful over the last few years to prevent a market crash. I think we need even worse economic data to really send markets tumbling. And when they tumble it will be major! Until then we may have to get used to the Dow climbing 1000 points in a week even if it all reverses in the end.
There’s zero intervention.
A mini/maxi crash shortly will at least put this BS idea to bed for good.
Closed Dow long for +85 pips. GM you sound frustrated by the lack of a crash. I expect a large equity drop but in the interim if investors want to push things up I’ll take the opportunity to go long and profit from it. I’ve placed a initial Dow short at 17089 with 20% of my normal stake. Will build this up to a full short if the rally continues. Target is 16700 area.
Only frustrated at the BS about CB intervention. As I said.
Closing my eyes to all the attractive “curves” and putting my ear to the ground; I hear a “rumbling” that is indicative of a major rotation out of stocks and into treasuries.
Well that is not right because energy stocks already crashed and so we have to rally to the next solar cycle peak, or so I have read.
As I said, I have closed my eyes and opened my ears. I was long stocks and I took a nice profit. I am no longer long any stocks. In fact, due to my ears and not my eyes, I think “the time has come to take the money off the table and get the hell out of Dodge”.
Btw: I am thinking something new concerning Cycles/Waves and will soon post about it, maybe with JH’s next report.
Irrespective of whether you are right or wrong Richard, you must realise your thoughts and views are somewhat all over the place.
If it works for you of course, that’s great, but as a reader of your theories, I (sometimes) read them, knowing they’ll be replaced by something totally different in the days/weeks ahead.
Much like the weather forecast, lacking credibility.
This is a VERY EARLY CALL but IF the 17080 on the DJIA holds then we’ve just completed the upward correction from the Aug 24th low.
Now let’s see what the market really gives us.
A repeat of October 1987. With wheels on.
Whether you are long or short, just have stops in place – preferably guaranteed ones – to avoid blowing up any accounts. At the times when there is a potential trend change, the most damage is done.
imho
J
Hahaa here we go….the smokng gun?……..what occurred to move the Fed into the largest RRA’s ever after the 16 Sept?…………that is easy…..A massive liquidity vaccuum that threatened to crash financial markets. That is why we had the sudden reversal.
http://www.silverdoctors.com/here-we-go-fund-manager-warns-something-just-blew-up-in-the-global-financial-system/#more-58825
Is this the reason Janet Yellen had to seek medical attention?……was she under so much stress that she was unable to cope with the probablility that financial collpase was a very real prospect under here watch?
You tell me??
As you ought to know, by year’s end we will be in US Treasuries long term inversion window. I place good odds that it will be a “crash up” in treasuries with the break of the Ten year note’s three year down trend line (panic buying of US Treasuries as next year starts).
That’s a nice site Allan. Thx for sharing.
Hi pirvez, SD’s has more than its fair share of looney contributers, however there are some really grest contributers as well.
I am sure you will work out who and what deserves paying attention to 😉
10/8 16:04 7442 Spiral price targets for 10/9 – 2021 and 2069. Then down to 10/28.
1028?
Cool.
😉
1773, 1734 and maybe 1599
and 1676
And this. I’ve said all along that ETF’s are hidden danger amd that even those that bet right won’t collect after the system collapses.
They will simply pull the pin and wipe the slate clean and reset the whole system.
http://www.silverdoctors.com/systemic-leverage-blackrock-calls-for-pulling-the-plug-on-stocks-to-prevent-big-drops/#more-58829
Love me hate me, I don’t care. I am making money. That is what matters.
Elliot major degree 2nd waves are usually A-B-Cs that end on 61.8% Fibos. Take a look at the DOW. The NASDAQ is not confirming that the DOW will continue higher but that the odds are growing that the DOW will start down in an Elliot major degree 3rd wave. Elliot 3rd waves are usually linear, go far quickly, and a minimum of 1.6 times its 1st wave. If you think this summer’s sell off the DOW from its ATH was impressive then multiple that amount by a minimum of 1.6 and that is what might happen, soon, as per Elliot and Fibos.
In addition, the usual lunar rally is coming to an end and the decline from the New Moon to the next Full Moon is an additional warning to the DOW along with the non-confirmation of the NASDAQ.
I will respect any view you put your money on. It seems like we are all aligned now from the new moon to the full moon. As Peggy says, to 10/28 lows we go. Good luck!
This weekend 13 years from low and 8 years from high.
13 and 8 are Fib numbers of course.
Oct 10 has the most turns of any date in market history.
I see references by some to 17.6 weeks. Similar to Armstrong who would say 17.2 (8.6 X 2).
Both are close enough to 1/3rd of a year, a Gann principle.
Thanks maybe it’s another big hit like your other August 18..
“Love me hate me, I don’t care. I am making money. That is what matters.”
Who knows, but if you repeat it often enough it must be true…?
J
Taylor Swift, is that you?
Good one!
Is this where we are at based on a history repeat scenario:
http://content.screencast.com/users/prince3000/folders/Default/media/33b40d35-bbc0-43f7-a71a-223380308ef7/Image1.bmp
That does look the same as today.
Patterns can repeat but you need to watch for when they diverge like 1987.
The DOW has reached a “classical” Elliot Wave count for a larger decline than what happened this summer. This summer’s decline was Impulsive, the rally is Corrective meaning that there are overlapping waves, the rally is the classical A-B-C, the B did not exceed the ending price of the 1 that it is correcting, the A-B-C corrective wave is part of a 2 wave, that 2 wave has reached the classical Fibo of 61.8% of the 1 wave that it is correcting. Add to all of that a classical Lunar rally of the C wave and it is dangerous to continue long the DOW which is some of the reasons why I no longer am.
This could be JH’s “second chance” top before a larger decline occurs.
Both the DOW and Crude have made corrective A-B-Cs higher but the NASDAQ and Copper have not. If the NASDAQ and Copper don’t then the odds are increasing that the DOW is making JH’s “second chance” top before the bigger crash occurs (an Elliot major 3rd wave decline).
Voltaire thx for that chart. A picture’s worth etc.
Second chance, it’s one of your more interesting
thoughts Richard )
I have read some TA folks saying there is now a
DB on the UKX and DJI, not sure is this observation
valid?.
It looks very much like a bear market rally
to me, let’s see.
Certainly a rip your face off rally if margined short.
Clearly, the DOW is at an inflexion point of classical Elliot Wave theory. Either it continues up in a 3rd wave or it reverses and declines in a larger degree 3rd wave.
As the EW contributor here who gets it more wrong than right, I would like to advance (enhance?) Richard I’s theory about a 3rd wave decline.
First some background:
If we accept that the big drop to 24th August was a 3rd wave of some degree then the resulting corrective wave by definition should be wave 4. The bit that I’ve been struggling with is the size of retracement of this 4th wave. 4th waves usually die out at the 38.2% retracement. 2nd Waves on the other hand retrace around 61.8% although they can go higher and have in the recent past usually done so.
SO….here’s my take on this deep retracement. I believe that the drop to 24th Aug was not ALL of wave 3 but (i) of wave 3. The retracement we are seeing is therefore (ii) of wave 3. And that leads me to the most exciting part. We should soon have a ‘3rd of a 3rd’ wave down. As Richard I has already suggested that a 3rd wave is usually the size of wave 1 x 1.6. However if it is a third wave then they can stretch to x 2.6.
And that’s what I think we are going to see. Some awesome action to the downside soon.
Hope I don’t die of boredom before that.
Elliot corrective A-B-Cs are often channels because the C equals the A. When the C is 1.618 times the A it is a warning that the C may be a 3. When the C equals the A and the “C of 2” is .618 times the 1 that it is correcting and there is usually a channel that intersects the .618 Fibo line. That is happening right now. The DOW is failing just below the upper channel line and at the .618 Fibo line. This weakness, combined with the failures of the NASDAQ and Copper are pointing towards an imminent Elliot major 3rd wave decline.
Can’t see any evidence this bull leg has finished. Will continue to short term trade long and build medium term shorts. It will take time for the confidence of short sellers to return so not expecting any swift falls for a while.
Krish, here’s my ‘proof’ of it ending. I see 5 waves up in the DJIA from the 29th Sept low. Hope that helps. There may be some residual further small high.
http://postimg.org/image/trx1rs37b/
whoops the v of 5 tag somehow disappeared. Any way I’m sure you guys can work that one out.
Nice graph. I hope you are correct. We need some sort of negative event to kickstart the fall though. Maybe that will come next week. The gold rally could be frontrunning a market fall too!
Yes Krish, I can’t see the MMs allowing a fall today (too obvious). The time to do it would be overnight Sunday when most of the world (of small traders) is asleep.
concur, looks clean and clear purvez.
I was concurring with krish’s comment on the chart.
What seems like a long time ago now, the key to this market toping was always the strength in the nasdaq. As long as it remained stronger, comparitavely, to the overall market; the trend remained up. It was only when they began to falter that a red flag was raised that the trend was turning. I no longer follow this data on a day to day basis; but I think in hindsight the stats will point this out back during July of this year.
purvez, that’s a big call, interesting.
Just to reiterate. I get more calls wrong than right. The ‘difference this time’ is no triangles involved. Lol.
http://www.marketwatch.com/story/ceos-and-other-company-insiders-are-gorging-on-shares-2015-10-09
This and the improvement in credit conditions give me pause.
If it’s a bear they may be too early, but if not they may be a bottoming indicator. Gary can you point me to improving credit conditions?
I use these two John. I am also a Gary!!
http://research.stlouisfed.org/fred2/series/BAMLH0A0HYM2EY
https://research.stlouisfed.org/fred2/series/BAMLC0A4CBBB
The trend is up, last years highs have been taken out, I don’t expect the current reprieve will change the trend of tightening.
Thanks
John, this is where posting with a few sentences can be dangerous. I should have emphasized that the improvement in conditions I’ve seen (see OAS spreads) has been of a short-term nature and time will tell if there’s been a real turn.
By the way, interesting chart you put up. In terms of MarketWatch, the one fellow I do pay attention to is Mark Hulbert. I know him personally and know he’s a very thoughtful guy. So I’m wondering if the difference in what the professor he quotes is seeing in terms of insider buying and what your chart shows is just a matter of timeframe, with the professor’s data being of more recent vintage.
There is a three day Candle Stick pattern called an Advance Block. Should the DOW close up from its opening today they the odds are high that there will be an Advanced Block that also points to a major turn to the downside to follow.
Both Copper and Crude could be in Elliot major 4th wave corrections implying that both will break to new lows. Crude could be making a C of a typical Sideways Triangle while Copper is making a C or a complex 4th wave correction possible a declining Triangle. Of course, both eventually breaking to new lows imply a worsening Global economy (American Recession in 2016?).
I sold even more core holdings today. I am at the highest cash percentage ever in my 25 years of trading. I see value out there, but good value often turns to great value. I am taking a risk and selling several core holdings at the bear (specific stock chart, not general market) high side trend line hoping to get back in at lower prices. I am not too worried if I miss a bull run, I have been building cash for 18 months and today is peaking my cash percentage. I find it harder and harder to believe that this market can go through this coming earnings season without some big drops. Companies have been laying off employees like crazy. This is not a good sign for earnings anouncements. They can claim operation cost reductions to try and overshadow their poor earnings. Time will tell. Cash continues to look better and better to me.
Lay-offs means bad debt at some point sooner rather than later. I think this is my main concern in terms of stock market.
J
Also, The layoffs are high paid positions. IBM,MSFT,CSCO,HPQ,CAT and many more big names with big layoffs; it’s been going on for a while and has recently accelerated. Even the retail side is starting to see it. Walmart is having a layoff and cutting hours on 24 hour stores.Small amount, but Whole Foods had a layoff. Dunkin Donuts closing some 130 stores? Not entirely sure on that number, but the fact that big spender middle class jobs are getting whacked is not good and if these smaller low paying job companies are starting to see the decline, we are in for a poor consumer cycle. This Christmas spending season should be interesting. I do not trust the job numbers at all. Most of them are not good jobs and the evidence is in the housing market for young people. They are not buying houses.
On this day…(re. Sean on watching 7442 analytics):
https://en.wikipedia.org/wiki/Stock_market_downturn_of_2002
Evening all.
I got my final quarter onto FTSE shorts at 3.50pm from the car.
Happy with my average prices, it’s all in the 3x short ETF, and I’m down by 4% at the moment, so effectively in within 1.3% of today’s close.
Like many here it will be nice to catch some serious droppage, a crash perhaps, and interesting to see a convergence of views here. My approach is mostly gut instinct, but thanks to all commenters that share here, Richard I has added some useful info these past 2 days on more ‘normal’ matters.
So, good luck all, I can tell you the bulls over at Ibankcoin are knees deep in ‘buying the dips’ and are still adding all this week, no thoughts but bullishness.
I suspect most are unaware of the potential dangers.
Hence, the crash could be a wonder to behold.
I’ll be ‘doing a purvez’ and watching it all from foreign shores for a couple of weeks, in sunny Morocco from Tuesday, apart from time on the golf course when more concentration on a smaller ball will be required.
GM morning ;). Timely?……AA had a shocker and CAT chart looks bloody horrible. Those two alone are a huge red flag.
Daily Indices are the most overbought I’ve seen in a long time. Enjoy your trip!
Thanks Allan, good morning.
Meanwhile, I’m delighted to see HUI having another leap today, clearly some buyers nibbling the sector now, my clients happy we bought that plunge some weeks ago. Early days of course, but all bulls have to start somewhere.
Mate the Aussie goldies are powering. One of favs ASX: SBM hit a new intermediate high yesterday of $1.275 from its low last November of .075.
That is a bull market!
That’s huge, and at this early stage. Wait til gold hits $3k in 2017.
Must get my junior miners portfolio sorted, rather than this trading malarkey!
GM, have a good time in Morocco. It’s a place on my ‘to do’ list. I did go to Tunisia and had a bad experience (due to my origins) and my better half won’t go anywhere near the mid east or N. Africa since. More’s the pity.
There is a huge culture there that I would like to explore.
Thanks p.
This is my 6th visit, I’ve never been to Tunisia, but I think the two are similar.
I have made some very good friends in Agadir amongst the local Berber community, very hospitable and good people. Tough lives they lead, but better values than in the West. Can’t wait to get there.
Ag really hard up against it here. For the last 4 years, but particularly the last two, the 50 wma has been huge hurdle for it.
Currently it is up against the triple. 50 dma/wma and downtrend lines. IF it breaks all three and holds for a week or so the move higher will be explosive.
http://stockcharts.com/h-sc/ui?s=%24SILVER&p=W&yr=5&mn=0&dy=0&id=p15736163443
Sorry way too early too again for me to be posting. I meant to say 200 dma/50 wma not 50 dma/wma.
Ftse has dinged the 50% fib and retreated today.
http://screencast.com/t/F5cJxiQWFG
The weekly candle looks a little…..exposed…to me.
Could it reach the 61.8% fib?
I’m betting not, it’s done here, but I could sweat another 200 points next week if need be.
GM, are you leaving the last 25% in cash for 62% fib?
No John, that went on this afternoon.
I sold all my longs yesterday too.
Valley,
How is the PALS system for next week.
I believe Valley is off to that second island he purchased recently –
PALS:
Phase: + all week
Declination: – Tuesday to Friday
Distance: – Monday to Thursday
Seasonals: + all week
Planets: slightly negative post todays Uranus opp.
Summary:
Will trade mostly to down side next week with assumption that price may retest 1831 on SPX and supported by negative declination and distance. New Moon effect is hard to overcome so market could move higher all week. No clear PALS signal next week.
My neighbor is Nicolas who retired several months ago from his biotech profits :).
Congratulations or Commiserations!?! Valley
Please tell Nicolas that I had to move to a short as he left us in the lurch.
Cool site re cycles and astro influences:
http://time-price-research-astrofin.blogspot.co.uk/
Flag?
http://www.screencast.com/users/Gary_UK/folders/Jing/media/66213c09-6032-4842-879d-9b6abc0e675f
dugh?
And seeing as Caldaro has price action rather than EWT theory working then we must say thankyou Caldaro for all the misleading?
Should we conjecture that you also been bought? Everybody has a price not?
New post is out