

US Stocks:dollar, stocks:bonds, junk bonds and volatility (inverted) all peaked out mid-2014 with the solar maximum.
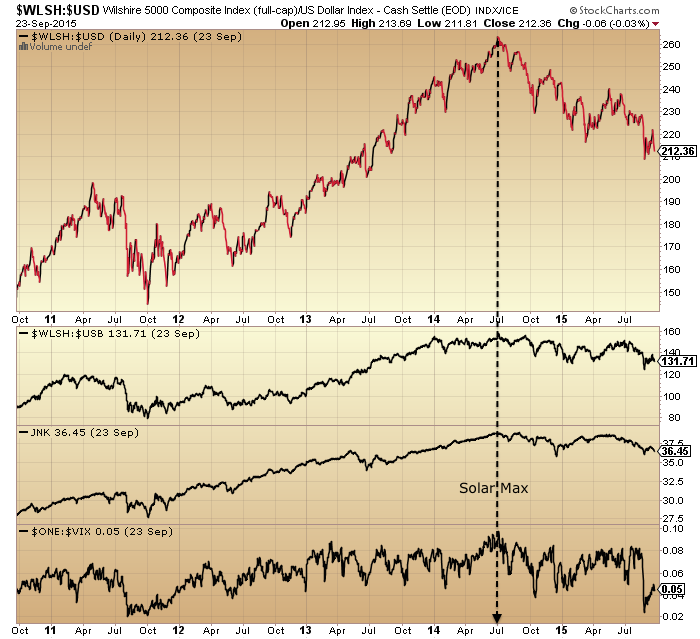
Source: Stockcharts
Crude oil, put/call, breadth and bullish percent did likewise.

Sornette’s bubble end flagged then too.

Source: FinancialCrisisObservatory
Global business activity peaked out at the same time.

Source: Thenextrecession
And economic surprises.

Source: Not_Jim_Cramer
So did financial conditions, Europe and US.


Source: Bloomberg
And geomagnetism has played a key role in these developments, intensifying since mid-2014.
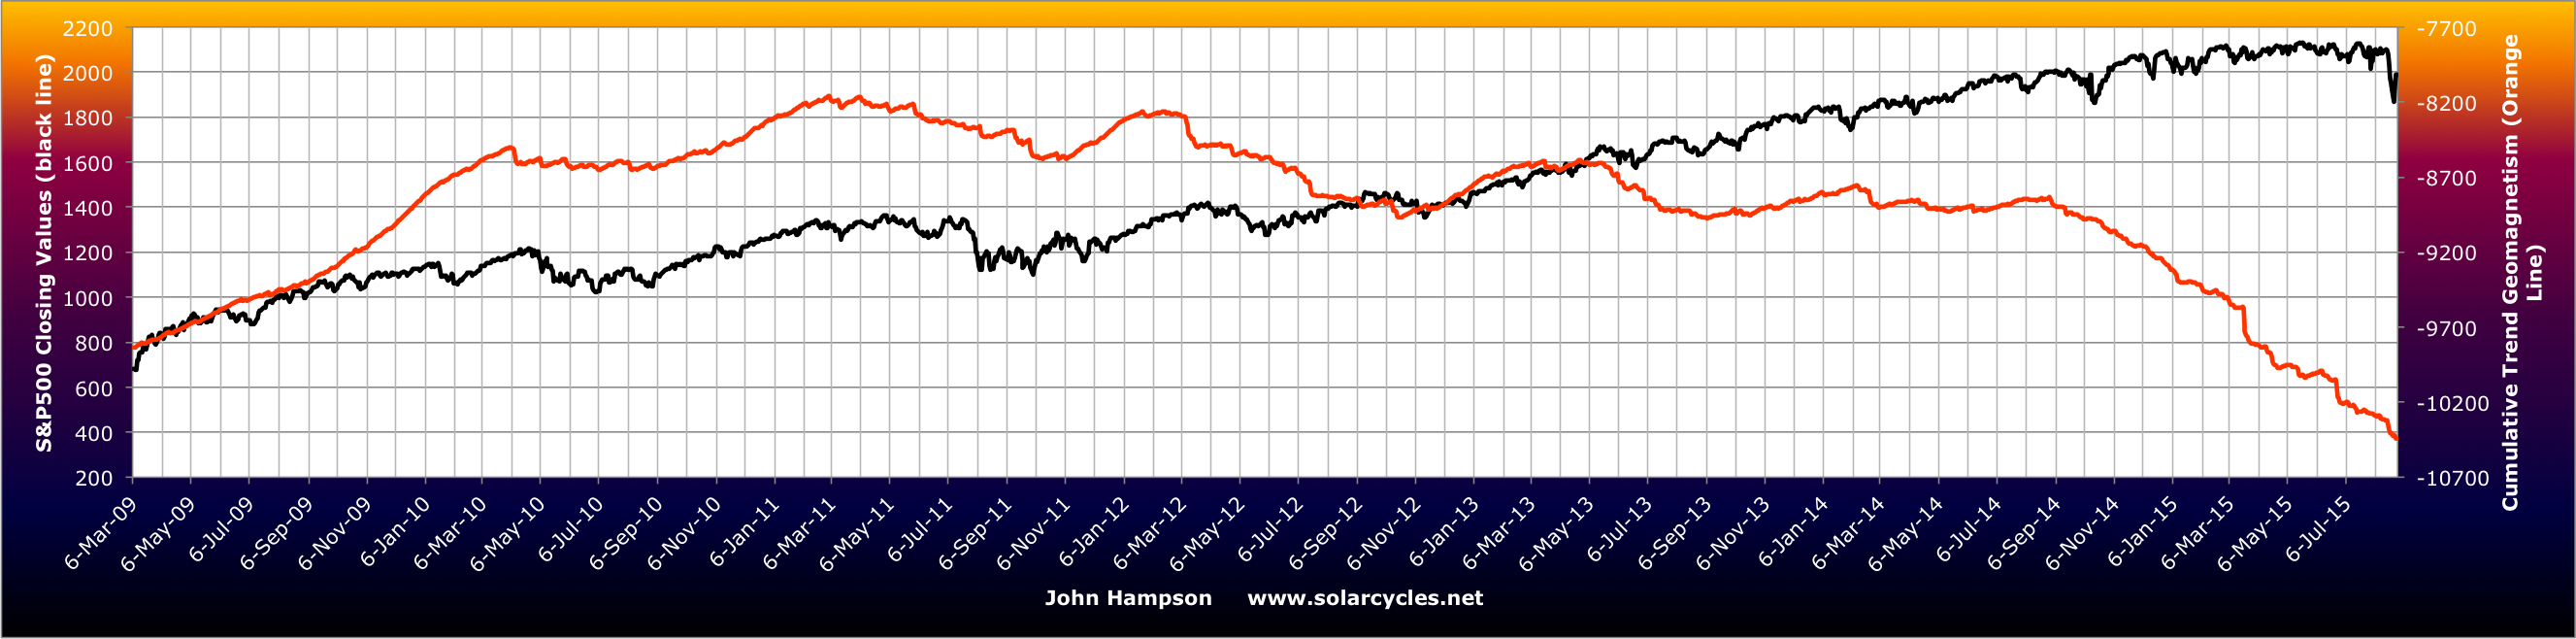
With united demographic downtrends in the major nations, solar history suggests markets and economy should tumble down to the next solar minimum.

Source: NOAA

Source: Tarassov
Drawing demographics, solar cycles and valuation together we get this:

It fits all three and that’s what makes it fairly compelling.
The mid-2014 peak we see in many indicators and assets is unrecognised by most. They see the August 2015 drops as the first drop in a topping process or a wave 4 in EW, both meaning we head back up. But the drops into last October fit better with this, with a secondary and final peak then forming in May 2015. The nominal price action has been uniquely confusing in this major peak, but the clues are provided by those under the hood and cross asset indicators.
What resonates with me about Elliott Waves is the waves of mass crowd psychology. We see this phenomenon playing out in solar cycles, lunar oscillation, demographics and valuation. But the weakness of Elliott Waves is that on any chart at any time multiple different counts can be produced and are then refined with time to make the count always ‘right’ with hindsight. I simply don’t see evidence that Elliott Waves are reliable market predictors (emphasis on the reliable), but the general underlying idea is very much in play in overall price action, something like this:

Source: ProfitF
We all know an up trend rarely ends abruptly but instead typically peaks, reverses a while and next heads back up. Then, typically, the move either fails before the previous peak, double peaks with it, or makes a marginal higher high but on negative divergences, before the trend reversal takes off in earnest. All akin to turning a tanker at sea: it takes some time. Whatsmore, the last move up is typically the stage on which the retail money makes its usual late and painful act.
Between last July and this May we saw smart money flows weaken, dumb money indicators hit new highs, leverage jump to a new record and stock market internals notably diverge. All evidence of a wave 5, a secondary peak, or the terminal rally after the primary distribution, whatever you want to call it:
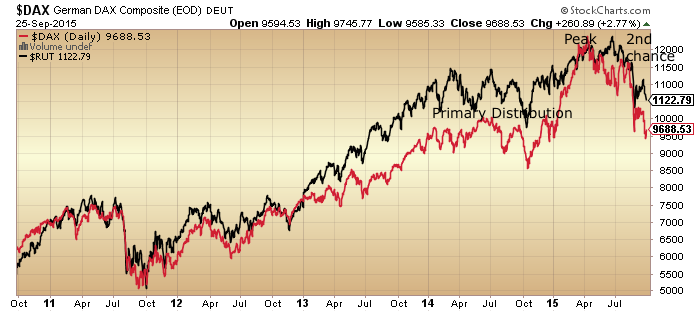
That second chance peak is now looking fairly potent on Biotech:
 The point is that topping processes share similar characteristics which reflect how humans work. A peak takes time to form with some back and forth, some telltale signs in those leaving early and those joining late, and some health warnings.
Finally, let’s recall that this has been the second biggest mania of all time, as measured by valuations, leverage, allocation and sentiment. The second major error analysts are currently making (to go with the failure to see the topping process began last July) is to see charts like this one as contrarian bullish:
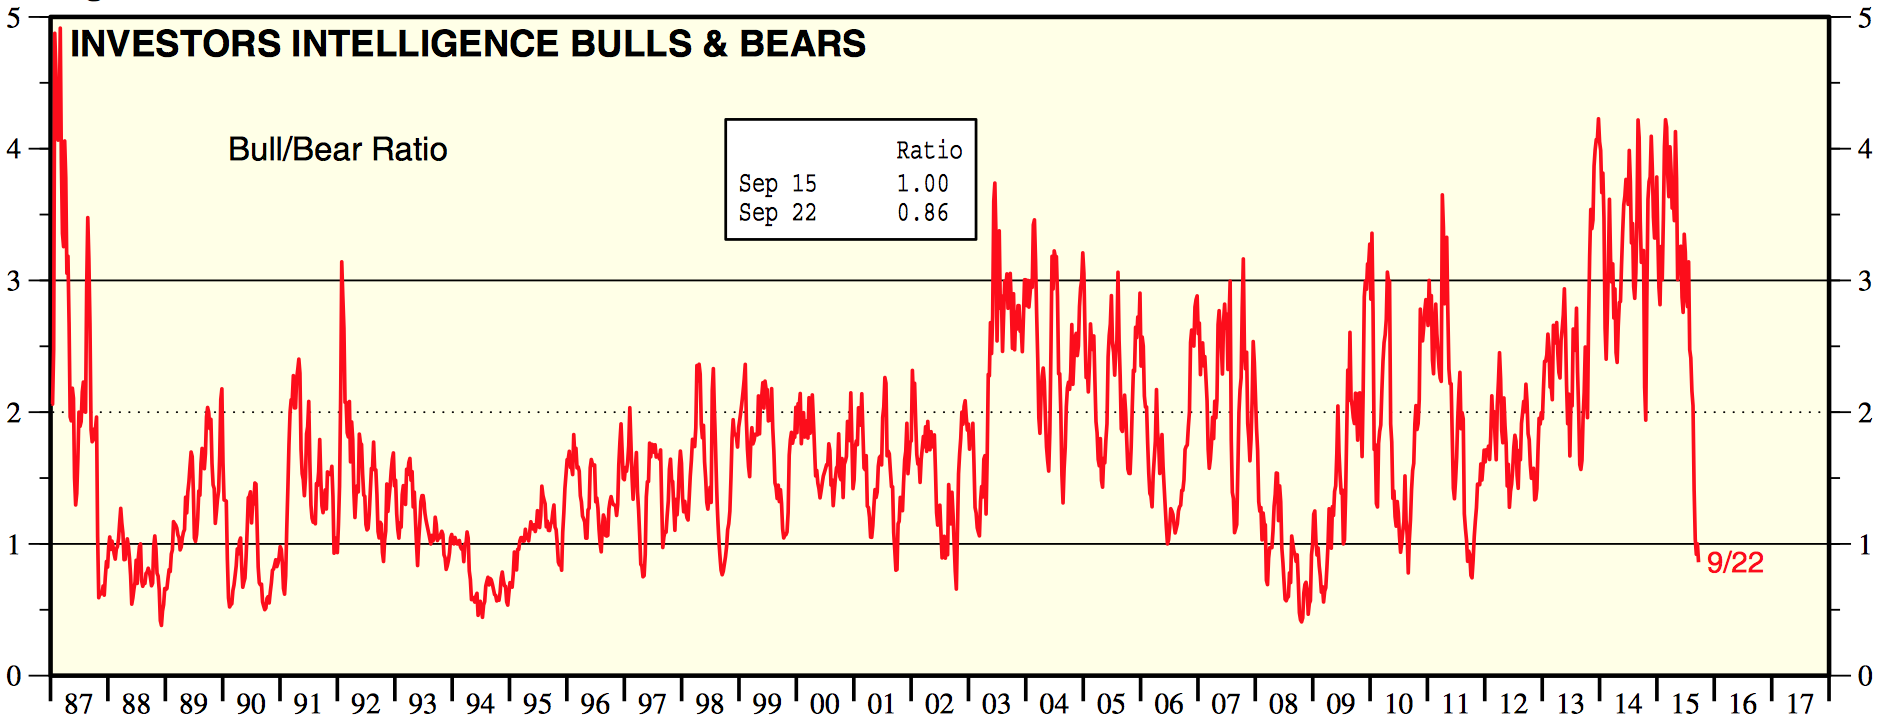
Source: Yardeni
The jamming of the indicator at record highs last year highlights the mania that was in play. The subsequent crash is the mania bursting. The low reading is bearish, not bullish. It will take some time to recover, maybe even years. Given how ultra saturated the market was in terms of allocations, leverage and sentiment, it is unrealistic to think that the market will now go make new highs. Some of the dumb money was wiped out in the August falls, some more is selling on every move up to get out at break even.
The most bullish outcome is that the market gradually digests the falls and range trades whilst all the excesses of 2014 are gradually mopped up. But, there is no precedent for this in history. From 2014’s valuations, leverage, sentiment and allocations levels we have only seen devastating bear markets in the past. The post solar max and demographic environment add to this likelihood.
Gold looks to be completing its basing. Global stocks are now retesting their August lows. Clearly, if gold takes off here and stocks decisively break down beneath their August lows then the mood will properly change. The most bullish outcome I consider is that stocks range trade and recover some whilst the 200MA gradually arches over, as bear markets often aren’t in a rush, more of a slow bleed. However, written into the record leverage, is a period or periods of panic selling. Biotech is in an ideal technical set up for that to now occur. DAX and RUT look post second chance, which in past major peaks led to waterfall selling. So maybe we fall apart rapidly here – or, my bullish scenario – we hold up (without exceeding the highs) into the end of the year and fall apart in early 2016. Every man and his dog thinks that stocks are going to bottom out and resume bullish in October in line with seasonality so it seems likely that something else occurs. I think actual (rather than seasonal) geomagnetism is likely to play a role in this, so I am watching developments. I favour the falling apart option but you know my positions disclosure. Trades-wise I’ve been increasing shorts and adding to gold on the basing evidence, and adding stops to all of it. I’m going to carry on with this strategy unless the market bounces on positive divergences and shows evidence of a renewed move up for the bulls.

It seems to me your kneejerk reaction in July 2014 was 6-12 months too early.
There is no question I was too early, but this has been one of the most challenging trading environments and topping processes of all time.
Not that JH needs any defense, but the last adjective I would use in relation to his analysis is “kneejerk”. That’s a queer description. The other point I would make is his preferred short at the time was the Russell 2000 index. I’d advise you to go examine the performance of this index since the beginning of 2014.
Thanks John. Your blog is by far the best on the internet.
Many thanks Valley
Yes, no one’s timing is right very often. JH’s analysis is what is valuable, how you trade it is up to you.
J
J,
That is the most valuable comment I could give to younger investors as well. Read the data and apply your experience and do not expect anyone knows when things will happen. The market humbles all.
Urgent! Paging Nickolas!!!
Nickolas, whats going on, buddy, what do we do now???
I got a post card from Nicolas. He says he is not worried. Rather keep buying biotechs at these low prices, because their earnings are quite good. But yes, if you have to sell, definitely sell the gold miners.
I also received a post card from Nicolas, on his visit to Fantasy Island. On Fantasy Island, biotech is still going to double every year for the next five.
Thanks John, a bit more meat on the bones in this post for me.
A question occupying my mind re solar maximums & minimums and the markets is that sunspot numbers peaked back in 2000, and fell to the low in 2009, but within that period (03-07) we saw another cyclical bull in markets back to the highs in 2007.
I am pondering whether we see a very sharp short bear now, 40-50%, but only into 2016, then (yet) another cyclical bull in stocks (as the govt bond bubble bursts) up into 2019, then a final brutal crash down into the solar minimum in c.2020.
That would tie in with my timescale expectations for monetary developments.
Whatever happens along the way, I am sure your ongoing analysis will be helpful for all who visit here, so thanks for your generosity in freely sharing your work.
Yes I’m open to that too. But my reasoning is: I believe the 2007 peak was a demographic peak for Europe and there are no demographic peaks in the window ahead. Plus, we saw in Japan and post 1929 the kind of long bear to which I am referring. Anyhow, the ferocity and depth of the bear will make it clear which option is likely occurring.
Thanks, hope so.
Increasingly compelling analysis, thanks again Mr Hampson.. I combine my preferred Elliott take and surmise that we likely gonna see a failed Primary 5. On the other hand very few 5th waves fail. But then very few come about in similar circumstances to the present. The short-term application of Elliott theory should be in conjunction with other TA indicators, foremost being Fibonacci and channels. Results improve with wide eyed usage and for me the reliability of trading decisions has been enhanced thereby. Learning from others whilst paper trading followed by solo paper trading from TA chart analysis is most advisable prior to the real thing. Following others in order to avoid the necessary personal involvement in any trading decision is not advisable, even (especially) if you pay for the hand holding. If the advisers were as good as you believe them to be why would they want your money so badly.
Every TA indicator is only as good as the related interpretation process. Elliott theory indications are no different. As with any indicator the interpretation flows from the dynamics of multiple variables in a familiar pattern.
I correlate my wave counts across select bourses and indices looking for clarity, and find value in doing so.
Can you explain what a failed 5th is, in terms of say the S&P or the Dow?
Pattern e… http://www.prognosis.nl/support/faq/principle/principle2.html
Please do not leave a mini ice age to me cos I just got rid of one.
The 5th wave is the last wave of a 5 wave sequence: 1 up, 2 down, 3 up, 4 down, 5 up. A normal 5 wave sequence has each of the 3 waves that move in the direction of the trend (i.e. waves 1, 3, and 5) make higher highs. So wave 3 tops out at a higher price than the wave 1 top, and wave 5 tops out at a price higher than the wave 3 top.
A failed 5th (also called truncated 5th) is a 5th wave that tops out at a price that is below the top of the 3rd wave.
So in other words, he’s expecting a rally which would be the large 5th wave counted from the 2009 low, but he’s expecting that that rally will fail to make new highs. Maybe a double top, maybe a lower high, either of those would count as a “failed 5th wave”.
Massive bear flag break downs in several global indices (sp 500, dax, ftse, bovespa) to name a few. We are all set for some big downside.
Finally I’ve found someone who I totally agree with regarding Elliott Wave: very useful as a pattern tool, hardly for making reliable predictions.
As for this article as a whole: razor sharp analyses as always, thanks John!
My experience has been that the practical use of EWT has remarkably few active and adequately successful employers. Your sentiment is by far the most popular one. It is difficult to many and algorithms for it also flop. So if you find it gives you an edge (which is the best any “system” can offer) you join a minority. Cool, not?
Probably the best thing I learned from Elliot Waves is the ABC correction cycle. I learned to be patient and wait for cycles to finish. The up cycles, I tend to just sell on the climb and try not to time the tops. So we agree as well. That is not to say that rigorous users of EWT cannot be successful, but I do not use it that way. I find that using the technical wave forms and combining it with value works pretty good for me in choosing entry points and selling guidance.
Thanks gents
“Every man and his dog thinks that stocks are going to bottom out and resume bullish in October in line with seasonality so it seems likely that something else occurs.”
I do not think this is the current “mainstream” view of the general public. If anything I would speculate that the media and many professional fund managers seriously believe that the slow down in China growth will tip most global markets into a recession, which will trigger the start of a new bear market imminently, if it has not already occurred from Jun/Jul already.
Disagree based on what I read and see, haven’t seen ANY calls for a major bear like we see here.
In the mainstream media I meant, obviously the Hussmans and the Fabers and Grants have called this for a while. Vast majority are still bullish.
I agree with steve T, most probably we wash out and little below 1900 and rally..everybody is expecting a second test of lows.
Valley,
How are positioning next week. I plan to enter small short early next week and look for long below 1900.
Last week I was doing very good but did a big mistake of holding long till almost end of day. would have been aswesome with partial sales at noon highs.
Bill
Bill, shorting intraday this week. May look to go fully long on extreme weakness on Wednesday which is Mercury I. Conjunction.
Often MIC acts as price trampoline for 5 trade days after.
MIC is Mercury conjunct Sun?
Yes, Mercury Inferior Conjunction, between sun and earth. Superior is other side of sun from earth.
I was wondering if this is a physcological issue..you start making money on an uptrend.. and you are waiting to see more uptrends because you have made money and your brain wants more money but then it starts going down and if you arent able to switch your brain to accept down is the new trend you either close or hold but dont short. Then you miss out.
Pulp
Thats what we all go through if you quickly identify downtrend you will be saved…But question is whats a downtrend …below 200 day ..lowere lows.. selling on fridays..
If the “real economy” doesn’t top out in November, but keeps on going, then May can not be the ATH as per the six month rule of the Smart Money distributing to the Dumb Money six months before the “real economy” tops and turns down:
http://news.morningstar.com/articlenet/article.aspx?id=716031&SR=COM807
Rather than rely on purchasing manager’s reports and guesses, check this out for actual business (not) being done in the US.
It’s a mature trend, why do you ignore it Richard?
http://www.alhambrapartners.com/2015/09/24/more-declines-in-durable-goods-economists-hardest-hit/
Ignore? Both articles are saying different things about Durable Goods. I don’t “ignore”. I have a “filter” that is telling me that the trend is up in American Stocks.
Can this market make new highs ? Perhaps.
The NYSE Comp chart looks like it has completed 3 EWT waves up from 2009 and the drop is wave 4 (down).
Wave 4’s are usually sharp and unexpected as fundamentals are still OK.
This leads to a wave 5 up to new highs that is built on wishful thinking as fundamentals sag. Maybe the wishful thinking is a GOP Pres victory and the early period thereafter.
The SPX has never been down in a year “5”.
If higher then cycles suggest up into year end from Oct/Nov and another peak into Apr 2016 then a low in May 2016 then higher into Oct 2017 perhaps.
John’s mid 2014 peak made a lot of sense as bulls are about 5 years or a touch more as a rule.
There is a lot of pessimism around and whether it generates a bounce or new highs soon, that seems more likely than deep new lows.
Of course like any old warrior (and I am) I don’t fight my key short term indicators. I load up when they point where I believe is right and I cut back or even exit when they point the other way.
Brave warriors die in battle. I prefer the Swamp Fox approach. He who fights and runs away, gets to fight another day 🙂
It would be highly unusual to see a bull into 2017, that would be 8 years in duration.
I tend to towards a brief 40-50% bear next year, then maybe a new high in 2018, then low in 2020.
I also see 5 clear waves in the NYSE, I’m unsure why anyone would ignore the c.20% decline in 2010.
http://www.seeitmarket.com/are-credit-markets-signaling-more-pain-for-stocks-14797/2/
Someone posted a cycle jockey’s view on the market who lives in Alabama. I forget his name but he is also a big believer in the Dow Theory. I had heard from another source this guy is really good on the long term forecasts. Can’t say enough about John’s latest missive–is a compelling view which would tend to also agree with GM.
What if most of the posters on this site “can’t see the forest because of the trees”?
“If” the Solar Cycle crashed the Energies (just like it did the Precious Metals in 1980) –then– it is not going to crash American Stocks which would go a long ways in explaining –why– stocks keep going up when indicator after indicator points to them going down.
“If” Delta’s Super Long Term “wave” point 6 DID NOT COME IN at its average due date of May, 2015, and comes in with its Long Term “wave” point 3 –then– it will be arguing most strongly that the Solar Cycle is not going to crash American Stocks but only crashed the Energies and, anD, AND, that American Stocks will not top out until 2025 (the full conclusion of all the different “wave” counts of the 19 year 5 hour Delta Cycle).
With Delta’s Super Long Term “wave” point 6 a high, the “Adam Theory of Markets” is pointing towards the next crash not happening until Delta’s Super Long Term Inversion Window which won’t start until 2025.
IF the Solar Cycle was going to crash American Stocks THEN Delta’s Super Long Term “wave” point 6 should have come in early and not on its average due date of May, 2015, OR latter –as I think it is going to do.
Delta’s Super Long Term “wave” Rotation having its evens as highs instead of its odd numbered points as highs combined with point 6 coming it on its due date (or latter) also combined with the “Adam Theory of Markets” strongly suggest that the Solar Cycle’s influence to the downside was only the Energies and not American Stocks.
John Hampson: As of this post I will no longer entertain the assumption that this Solar Cycle is going to crash American Stocks instead of only the Energies until price action proves otherwise.
Wow, this is a big shift in your position, It was a 1/2016 bubble peak call, and now you are adding 10 years?!
It’s possible it was centred in energy. But in the past we saw the mania into the max and the bursting afterwards. By a number of measures the mania was in equities rather than oil.
I put my money where my mouth is and went long DOW futures with the set back this Sunday evening.
Two points make a line and should Apple report strong Chinese sales after Nike just did this past Friday raises the spector that China IS going to successfully evolve into a Consumer Economy. Chinese growth is not negative it is just not the 7.5% or greater that it has been for several decades. Should China successfully evolve into a Consumer Economy its growth will be above the USA’s growth for years to come. India will become the new China in terms of growth and USA stocks are headed much, much, higher thereby.
If Apple reports strong Chinese sales of its new Iphone then the Human Herd will go from extreme Pessimism to extreme Optimism (basic Elliot Wave theory) and stocks will rally thereby as the “new reality” of the World’s Economy is understood.
For once Richard I agree with that hypothesis, in the medium to long term.
Put gold at $4,000 an ounce or higher, and both China and India become very wealthy indeed.
But you’re too early in my opinion, there’s a bear of some kind to come first.
One could see two years of mania into 2017 based upon Saturn in Sagitarrius (last three events peaked in 29, 59, 87). Jeff Hirsch of Stock Almanac sees decade long super bull coming soon. Long term price action of market historically has had market doubling every decade or so.
Yet, solar cycle effect on markets is clear. So, my guess is that we have a mild bear next six months. Then three year bull beginning next March.
If we see a brief but sharpish bear into late 2016, then I would expect any bull thereafter to be due to currency depreciation rather than to mania, and gains would likely be nominally positive, rather than positive in real terms.
10 years? Very hard to see, but I guess it could take that long for full dollar collapse. 16-17 year secular bear is due to end next year or 2017, so add 16-17 years to that.
Maybe I should try to become a day-trader instead, possibly easier to call!
Day trading the indexes using futures is what I am studying right now.
Take a look at Dec DOW futures back to at least the 17th with a 50 hour sma and notice how it declined and notice how it appears to be turning back up. I went long this Sunday evening beneath the 50 hour sma for what I believe will be the next big move above the 50 hour sma showing that the Intermediate turn higher is underway.
Richard, why do you say “stocks keep going up”? That statement is patently false which then calls into question, at least for me, your ability to critically analyze markets.
http://goldtadise.com/?p=351923
One observation on the goldtadise chart.
Note the long period of time (1837-1881) that elapsed between green 1 and 2 compared to the short period between green 3 and 4. (circa one year?)
Fast forward to the short period of time (1974-1976)–one year, eight months–
between black 1 and 2; and compare that to the long period between black 3 and 4. (19 years) Maybe the black 3 and 4 are more congruent with the green 3 and 4; meaning that the IV ended in 2011?
The bull case is that the time span has again inverted; or alternated to the pattern of IV being a much shorter time period compared with II?
Little point in such a long-term count, given that gold was literally money (that priced the dollar) for much of the period.
Similarly, the chart guy is mad if he thinks gold can go to $500 in 2019, $300+ below mining costs. Mad.
Billiards is a better game, at least there are some rules with common understanding
Said it before will say it again. Ignore the paper price set by a fraudulent COMEX.
Contrary to what one poster posted the other day about collapsing demand in India and China in a MS media article, the opposite is true.
Physical demand in both India and China has exploded this year for both gold and silver with Indian demand for silver risng by an estimated 68% YTD.
This whilst Aussie and Canadian production has declined by a staggering 28% YTD.
Kind of raises the issue as to why one certain banks paper PM positions have exploded this year allin conjunction with physical demand exploding, output declining as physical premiums rise amd COMEX deliverable is at all-time extreme ratios.
It is so bloody obvious now what is going on. This same banks has been found guilty of committing fraud and manipulation in other markets, but still people refuse to believe that metals markets have a hand involved.
This charade is going to end really soon and when it does lookout above 😉
I wasn’t knocking EW there Peter_, just the idea of plotting a price that was directly controlled by the state.
But I did once have a 50 break at snooker.
Indeed to be sure + many pseudo wave counters trying to con a buck out there. Glib globules of gunk etc.
STI also topped April, ending a 5 yr diagonal triangle, now in the breakdown but surely gonna test in sync with U.Sam. And thats not all
Valley,
Do you think we get an opportunity to short I think we should short at around 1950 but doesn’t look we go there.
For GM who see a clear 5 waves, this is how I see a CLEAR 3 ways up so far.
I note that on RSI wave 2 and 4 have similar low levels .
Few typos there. Writers are poor proof-readers ’cause they know what they meant 🙂
Check it here… http://stockcharts.com/public/1269446/chartbook/203707002;
where the counts are both traditional and the “objective” method that his site promotes.
We will see in due course.
I can envisage a panicky Fed/BoJ/BoE all unleashing QEs and a brief pop, maybe to marginal new highs.
Meanwhile, I added a small Dax short just now.
Yup Volt, I concur with your counting labours and recommend free download Photoscape for marking up chart images.
The Lunar Trade has been so profitable for over a year that JH occasionally refers to it. I am expecting this Lunar Trade to be very profitable. Why? Because instead of the DOW bottoming four days –after– the Full Moon I think that it is bottoming three to four days –before– the Full Moon. (Of course this “fits” with my new view that the Solar Cycle is not going to crash stocks but already crashed the Energies).
Russia is not the “basket case” that Brazil is. Given that China is still having growth; but not the wild headed growth of industrialization; but the solid, steady, growth of consumerism; Russian stocks have likely hit their lows and are on their way up from here.
Put it this way; “if” the Solar Cycle’s crash of the Energies is all over then the odds are very great that Russian stocks have bottomed and are going to rally from here.
And I thought Uncle Sam with Uncle Tom Obama was the basket case. And as he speeches to the UN from his fake moral high ground he strives to belittle the entire Universe. Nothing changes.
You need to have a discussion with this billionaire, Peter:
Calling Barack Obama “the greatest president of my lifetime,” venture capitalist John Doerr said he doesn’t believe the president will join Kleiner Perkins Caufield & Byers.
Whoever happens to be President does bring out the worst in people, and that goes for both Democrats and Republicans.
Seems that this is already proven wrong on both counts, in just a few hours.
Wow, impressive!
He still has 10 years left to prove his call.
John H, thanks very much for a continued series of Master Class essays.
I have a corollary question go GM’s earlier one about there being a stock market high in 2007 despite the Solar Cycle being very near the lows. You mentioned that this was due to European demographics. So it is possible for ‘other factors’ to override a Solar Cycle low in making the stock market go higher.
My question is: In your opinion could a concerted effort by all CBs (once they see a larger pull down) prove strong enough to override the negative effects ofthe Solar Cycle
Having thought about what I asked, I believe it’s the wrong question.
The ‘new’ question is : If a Solar Max creates a Stock Market high, does it follow that a Solar Min should produce a Stock Market low? I can understand how heightened Solar Activity would whip ’emotions’ into a frenzy. However does it necessarily follow that very low Solar Activity will ‘depress’ emotions?….or will there be no effect and therefore no concentration of action in any particular direction?
There seems to be something going on like that. But yes I’d say it’s possible CBs could collecitlvey override natural forces if they really tried, namely shamelessly changing the rules from a fair game.
Are the key *values* nominal or real? Dow 40k when the dollar has been deserted is still a terrible result.
I will do some 70s research when I have time.
purvez, think of it as defensive panic buying of stocks as a hedge against the bursting sovereign bond bubble.
The start of Armstrong’s ‘private cycle’.
Thx John H. It would seem that we are not in control of our destiny at all. 🙂 Collectively at least.
Potential “big move” this week:
http://finance.yahoo.com/news/goldman-options-market-says-p-102847225.html
Up or down, tricky. 🙂
Is Gold failing, for the second time, to sustain an upside breakout of a daily down trend line? Such failures usually result in major sell-offs.
Peter, I truly believe I stand a better chance with casino craps than trading the stock market. Billiards is much more of a physical skill. (:-)
In sport you can achieve competence in a season or 2. Trading takes several heart attacks and 9 lives.
FWIW, that chart originally appeared in the September/October 1981 issue of “Cycles” magazine. I think GMs comments add a sobering bit of reality about the chart; notwithstanding there are other more bullish interpretations such as we are currently seeing a cycle wave correction 2 in a current SC V. That at least has a better ‘look’ to make gold bugs feel more comfortable.
Nat Gas (UNG) – Return to base of bottom side of the trading range. Sold 1/4 of short trading volume from purchase of recent weakness. Next sell point $13.50 or above. I expect spikes between now and end of winter as we get expected bad winter weather in the south of the US. If we descend back to the $12.10, I will buy back in. However, that may depend on the general market action as I am looking for any panic selling to buy some value stocks.
To add a little more detail here. The jump to the strong base near $21.50 was not a surprise to me based on the belief that the recent drop was unsustainable, however, I am seeing some unusual forecasts that range from 18-95 Bcf’s on Thurs. injection report. I have been expecting the injections to reduce and they have not. So will this be the week? I am not sure both production and demand have risen and this has kept the injections strong. This does not change my view that Nat Gas is scraping the bottom and dips can be bought and spikes can be sold. But the forecast difference this week was worth mentioning. The low side injection should spike the price and the high injection should keep the scraping the bottom mode active. I would hesitate to make a call which way this week will go given the big forecast difference.
In the C wave of Primary 4 we now have the 1st ab (of 2) in a 535 corrective. Not sure how we see this because the popular take is that it never works.
Peter_ please would you tell me which are your ‘a’ & ‘b’ waves? Thx
markets melting in the middle of a puetz window
biowreck holders find out they can lose…..big
and very little posting here – wonder why
Not a good time to miss on Pending Homes or to make a hopelessly hopeful speech to the UN.
A giant sucking sound will be heard for many years to come due to oil state selling *financial assets*:
http://www.reuters.com/article/2014/09/24/imf-saudi-budget-idUSL6N0RP47K20140924
So much for Richard I’s cheap oil/US consumer recovery theory.
Thousands of job losses announce in UK steel industry today, cries for govt to step in.
I plan to move fully short early tomorrow morning.
SPX lower channel & 61.8% bounce zone lower 1880’s testing
Specie, For me I am just waiting for this cycle to play out and hoping for some panic. We should at least hit the recent lows, but I would like to see the market blast below. The Biowrecks are bringing down the good companies too and this could present an opportunity. My Favorite is CELG and I like it’s current price and hope for a good panic to drop it like a rock. They are making money and I do not see that changing. Watching closely as usual.
I’m reading and hearing about possible capitulation in the biowrecks all over.
A parabolic rise that like usually ends badly. usually down 80 to 90%. i’d be careful. we can talk about capitulation in the biowrecks some time next year when IBB is around 60
Still no message from Nickolas to his faithful. Sigh…. Biotechs down 20% from $360 which he hotly recommended as a steal. Almost 30% down from highs.
Nickolas, you must love it at these levels, comon, what do we do??? CBs are still buying, don’t they?
Nickolas, when things did not go John’s way, he was a man and stood his ground. Comon, show us what you made off!
Not far to the turn, but doubt higher high. Traders with conviction cover.
Peter_, what timescale are you alluding to please?
The current move down, or the big ole bull?
Current. The end of the 4th one more ab within C wave channel with Fib. Then long into P5.
The only concern for me as a bear is low volume behind today’s down move. This may change tomorrow though
I wouldn’t call the volume low, it was stiff, but not huge either. I think people are in the disbelief mode. Water fall events are increasingly probable IMHO. Once people get hit with another big down day like Aug, we may get a deluge. If we break the Aug Panic low, we could see the deleveraging start and if that starts, it is nothing but a negative feedback on all those margin debts. I don’t think that has started to unwind yet. Now through Oct. is a good time for this to happen.
specifically on the Aug low, I am talking about the intraday low of DOW 16370. If we blast through that we may get fear.
typo DOW 15370
I think it will Bunell. I can’t see how Asia overnight is going to be good which will feed on itself tomorrow’s Europe and US sessions. If Glencore’s debt status gets reduced to junk (which is highly likely) margin calls will commence and the results will become systemic across all financial markets.
Valley,
Going long or waiting till tomorrow.
Hi Bill, PALS shows next three trading days to be down. Avoided 2% off today by being in cash. Reluctant to short market at these levels.
I am long in overnite trade, moving to cash at open tomorrow.
Hey Valley.
You were often long up at the highs I recall, curious that with your system showing down, and the trend down, you are reluctant to short?
The trend is your friend!
Lack of courage. I am new to trading and even though PALS indicates to short I am reluctant to do so with SPX below 1900. I did short intraday today and made a whopping .4% on the account. Am long overnight. Will short intraday again tomorrow if price has risen.
I don’t like to short from hour before moon rise in NYC to six hours later. So that is why I am going long each day around full moon to cash in on the moon rise effect. And then sell two hours after moon set the next day. Would be much obliged if you would test this on your local market to see if similar effect is noticable.
http://www.timeanddate.com/moon/uk/london
I’ll try to help, but initially, the times in this table seem odd to me.
Off to bed now, check in tomorrow.
Bespoke:
The S&P 500 is now flat over the last 18 months, closing today within a few points of where it closed at the end of March 2014.
Possible little bounce tomorrow:

Then back down to new lows, even though most are expecting a successful re-test?
Sun spots way up, markets down?
http://time-price-research-astrofin.blogspot.co.uk/2015/09/highest-daily-sunspot-number-since.html
Funny, because this site shows peaks of 200, so 150 is not that high (relatively).
http://www.solen.info/solar/
Last one before bed:
http://time-price-research-astrofin.blogspot.co.uk/2015/09/martin-armstrong-on-djia.html
Armstrong’s ‘slingshot’ price on the Dow was avoided, with a close above 16,280 last week.
Let’s see if he somehow moves the goalposts.
What is a slingshot? He says both crash and new highs, but doesn’t say which comes first.
My understanding is a brief dip, followed by a big move up, much like when you throw something with a literal slingshot! 🙂
Anyway, his Dow level wasn’t reached, so that means a normal sort of bear is on the cards (assuming you give him ANY credibility at all of course).
Goldman cuts both 2015 and ’16 SPX mean estimates.
I am moving my stops up “nice and tight” and I am considering “reversing and doubling up”.
Nat Gas (UNG)- Went back in long with 1/4 trade volume from yesterday. Looking to see if I can the 1-2 day trades for 1-2%
I took my short profits around midday UK time, didn’t have the guts to hold on or add more.
GM, probably a good move.
good chance of a bounce here
not a lot of posting here, lots of people in other places are angry about the decline and don’t think it should have happened.
probably means the decline will be much worse than anybody thinks possible.
Specie, when the market has done ‘this’ since the Aug low then are you surprised that not many are posting.
It’s been one whip saw after another.
HOWEVER!! Even though I got the last ending diagonal wrong I’m now tracking an EXPANDING ending diagonal.
Personally I’m hoping that the current ‘waffle of a wave’ will go up to 16200 and then collapse down towards the lower trend line. Somewhere around 15720 before correcting violently upwards above the post Yellen ‘we are not raising interest rates’ high.
Here’s my current chart:
http://postimg.org/image/65wza3drz/
Ugh!! All of my posts refer to the DJIA UNLESS I say otherwise. I always forget to state that…..and that this is just a guess. The markets will do whatever they want.
Nice chart purvez
Ignoring any EW connotations this sort of back and forth usually erupts for one final time in the ‘OPPOSITE’ direction to the ‘back and forth’ wave. Any way I do have EW counts somewhere in there too but they are ‘convoluted’ to say the least.
Thx JaFree
purvez/JH,
On a weekly basis, we are seeing lower and lower closes, so the trend is clearer.
Also, I notice an RSI divergence (negative) in that weekly RSI is lower now than on the week of the plunge in Oct 2014. Weakness under the surface.
Also, I saw elsewhere that AAPL was falling hard today, a leader lagging!
I hope for a bounce, even a weak one, to re-enter short, maybe should have held on.
GM, I’m not suggesting that this is a trend change at all. Just that the upward correction from Aug 24th low, in my opinion, hasn’t completed.
What I’m seeing: some pos divergences on strength and breadth on the equities double bottom, capitulative breadth spike again. But no capitulation showing in the likes of trin, volume or vix. So I think we can reach lower yet, and then the chance the panic selling erupts – or – the bulls hope, we see a capitulative reversal in equities instead. Crunch time then. Gold is weak, adding to the balance. If we break down decisively sub Aug low in equities I;m thinking surely gold will then take off. But whilst it remains weak it doesn’t quite fit.
Yup, the time is now. Do we hold the recent low or fall through. Stay tuned. Anybody’s guess. I am mostly positioned for the fall.
specifically the Aug low.
John, pure guess but I think we double bottom by Wednesday/Thursday (Demark counts), rebound and THEN crack. Still need to draw in a few more bullish non-believers.
Looks like the FED is working real hard to try and get a green close based upon closing volume, VIX banging, etc.
If the Fed were involved at all they could bid the market back to new all-time highs (in secret) any day they wanted to.
However, they have made it clear as day, they’re not interested in supporting the markets, and haven’t been, and will not be.
This is just bulls buying the dips. Will Saudi selling overpower them?
Some follow up trivia; just for the record. I had commented in a previous post that the markets reached a peak on April 28, 1835; according to some custom charting I compiled from visits to the UT library; constructing an index from prices reported in the “Daily Albany Argus” newspaper. The monthly figures showed an exact high in BOTH May, 1835; and August, 1835 at precisely 23.48. (Data from the “Cycles” organization.) My concern was whether a higher high was recorded in either May or August? Well, I went back to verify by calculating prices for May through August. I found no higher highs recorded in either May through August. Bottom line is that it would appear that the actual daily high of the bull market from the late 1780’s was recorded on April 28, 1835. Very academic to say the least. I had previously thought this information might have a practical application.
Appropriate comment for Today’s time as well.
Will Rogers once said during the Great Depression – “I’m not so much concerned about the return on my money as the return of my money.”
What I found a bit surprising today was that the IBB could not even hold a gain today after getting oblitereated in the past week or so. More carnage on this sector is likely.
And what am I doing trying to sort out short-term moves? Should leave it to the experts like Valley…
And lastly, a really excellent column by Doug Kass. Even though he called the bottom in 2009, Doug has overall been too bearish in the face of Central Bank QE, and he’s the first to admit it. But as the Fed’s impact on markets lessens, Doug’s take on markets turns out to be increasingly spot on:
This has been my take as the final pin to pop this bubble. A false confidence in the Fed. We have an unprecedented experiment in the Fed balance sheet and we will most likely have an unprecedented wash out of that action. It could take decades. GM’s currency thoughts are a real concern. He and I differ in that I believe the Yuan has a better chance than the EU of becoming the primary currency. The patriotic wild card for me is the US has some serious Energy potential that will keep their currency #1. It is Oil, Nat Gas and Fusion technology. Combine that with US food production sciences and there is still alot of strength in commodities.
“We’re likely in an inflection point in the market fundamentally and technically speaking, and about to burst the greatest bubble of them all – the extreme and perhaps-undeserved confidence in our central bankers.”
Sometimes the education from THIS site transcends markets. I had only ever heard the ‘one’ quote by Mae West about a pistol or being pleased to see her. However when you Google Mae West quotes you get a sense of the ‘clever’ person behind the ‘blonde’ image.
Teaches you to always expect the unexpected.
Thanks, John.
Thanks Gary. Could you post long articles as a new post? Those with blackberry thumbs will appreciate less scrolling!
John Li, I screwed up. I didn’t intend to insert the whole article – just the link, for gosh sake.
Apologies to everyone.
No problem! Thanks for sharing an interesting article.
Daily sunspot counts 100+ since the 25th
145 138 154 120 125
Sc 16 vs 24 still looking good.
Cheers.
Never underestimate power of end-of-quarter window dressing.
As simple as that
Agreed, that was my thought when I saw a jump this morning. But of course we are due for a relief rally too.
Aaah! So yet another day starts it’s last closing hour with the ‘waffle’ still going on. (Waffle = anything between 15800 and 16950 (ish on both). DJIA of course.
Right this moment (Wed Sept 30th 20:09 BST) my ‘logical EW side’ says a quick drop to the lows followed by a manic ramp beyond the 17th Sept intraday highs.
However I’m willing to accept that we don’t get another low and just ramp higher.
I’m getting to the point of ‘not caring’ about the direction as long as it breaks through the blasted range…..and that’s what the market really wants…to frustrate both bears and bulls…so be careful what you wish for out there.
Mae West was also a writer – “too much of a good thing
can be wonderful” is my favourite, often used by Mr Buffett
and Liberace for that matter )
PALS Celebrity Special Update:
Phase: neutral/negative until Fridays close
Distance: – Thursday, + Friday
Declination: + until Friday
Planets: day after MIC (Th) could be way down. Friday plus two weeks unusually strong as post MIC usually adds energy to markets.
Seasonals: + until next week.
Summary: once we get past tomorrows MIC shadow (Merc Inf. Conjun), PALS indicates clear sailing for at least 5 trading days. Technicals / Shemitah / Year of the Goat / Puetz / Fourth Moon etc. could and probably will have effect. So caveat emptor. I will be fully invested in DOW/SPX from Thursday’s close. Last few days have been harvesting under moon light (buy close sell two hours after open) benefiting from tendency of market to rise when moon is in the sky, and fall after it sets.
Hi Valley,
I have been reading you PALS updates with increasing admiration. I ignored your talk of VIC (which was foolish on my part) but was watching MIC very carefully. I had two low dates 28/29 Sept and 17th Oct, so MIC added to my conviction for the first dates. I went long on Tuesday and am so far reaping the benefit.
FWIW – I use FM +/- 2 days, NM +/- 2days, pe/ap and declination and like you I use price to confirm a top/bottom rather that expecting a top at NM or bottom at FM (too many inversions costing me money).
Adding other planets into the mix is new to me but something I am looking at (Venus, Mercury, Mars, Jupiter). I use fixed cycles as a proxy (17.6 weeks and 17.6 years) until I figure out how the variable planetary cycles truly work 9which I probably never will).
ATB,
Kerry
Kerry, glad to hear it. I have observed the following:
1. Market follows best FM + 3 to NM + 3 as overall guide. But having said that the exact middle of FM to NM tends to be weak zone, and 3 td’s before FM tend to be reliable up days.
2. Inner planets are offer more than outer planets because of their lensing effect of direct solar energy. I track VIC, MIC, VSC (superior), MSC, VM heliocentric opp, VM heliocentric conj, etc. Each one has set ups one of the most interesting is the VIC and since this VIC has seemed to fizzle may be sign of market being in corrective mode.
3. Having said that, if you only focus on moon (distance, declination, and phase) you will have such an advantage that everything else is uninteresting. Seasonals are equally as powerful. That is why PALS is basically the three lunars plus seasonals.
I also admire your work and have watched your videos on CNBC.
The Full Moon market bottomed days latter than what I positioned for but let’s see how far the rally to the New Moon has in it. For “fun and giggles” (and my protection) I will move my stops again if the market keeps going –just in case.
I have taken profits on my long Soybeans. Today’s report and price action in Corn points to new lows for Corn and that could drag down Wheat and Soybeans too. Delta wise, instead of their Medium 1s bring in their low Long Term 5s I am now looking for their Medium 2s to do so.
Why a rally?
1: Up to a New Moon;
2: Up in an Elliot “C of 2” (before the 3rd wave crash);
3: Up to a Delta 18 point long term rotation point 6 (due in mid-October right along with the New Moon).
Cocoa *15
Sugar *15
Rough Rice *15
Items Martin Armstrong has claimed are tied to his ECM turn date, which is today:
The discovery of water on Mars
Stocks crashing (maybe later today)?
The Greek elections……zzzzz
Boehner resigning
An IMF growth downgrade (no. 6 I think)
Russia bombing Isis.
Catalonia secession vote
US budget ceiling issues reaching a crunch
Wales beating England at Twickenham in the World Cup
The Pope addressing Congress re Climate change and other socialist matters
I may have forgotten one or two, and one may be a frivolous fiction I added.
And people pay thousands to go to his seminars.
Have to hand it to him, genius.
GM, you are right. There are a zillion things happening each day that can be co-opted towards any ‘predictions’….BUT the Russians giving an hour’s notice to the US before bombing ISIS on 2015.75 made me sit up!! I’m sceptical of most of what MA says but his ECM has got an impressive enough record, in my view, to not write him off completely.
This is another site, that I believe GM introduced us to, which is superb. This particular article is well worth a read and the bloke has a very easy ‘writing style’.
http://www.salientpartners.com/epsilontheory/post/2015/09/30/rounders
It was me.
Apologies Gary, it is a very good site indeed. Thx.
I am laughing as I type, because yesterday I did think it was me, as I have subscribed to Ben’s email for a long while.
But now Gary mentions it, I recall it was him that shared it here.
I do need the upcoming holiday.
No worries, Purvez. I’ve known Ben Hunt personally for a while now, back to his days as a hedge fund manager. Brilliant guy.
On the credit front from Marketfield AM a few days ago:
The last time IG OAS spreads were at this level (July 2012) the SPX traded at a
P/E ratio of 14 compared to its current level just below 17. It would take a
further decline of ‐17.6% (down to 1583)by the SPX to take the P/E ratio back to
14 and although this is not a prediction of the endpoint to this correction it is a
fair summary of the relative disturbance between these asset classes and the
reason why we believe the performance of credit markets remains the key.
Gary, what’s the URL for Marketfield AM? I’m guessing it’s another one to ‘follow’.
The Marketfield letter isn’t publicly available to the best of my knowledge, unfortunately. The firm’s URL is http://www.marketfield.com
The firm’s CIO is Michael Aronstein, a gentleman I’ve tracked since the 1980s when he was with Stan Salvigsen and Charlie Mintz at Comstock Partners. All of them very, very smart guys.
Yes, which is why I mentioned casino craps; in the context of risk management versus reward in a rigged game. (:-)
short ES from the start of WW I
World war one?
Yes Specie, do explain! 🙂
1911
Specie that surpasses even Peter_ in it’s ‘cryptic…ness’
Very good Specie.
Hope you ride it down all the way to a rendezvous with Tchaikovsky.
Value in CELG shining through. It finally is diverting from IBB. That is not what I was hoping for just yet. I am still waiting for a panic day for entry to CELG. I think the general market is due for a relief rally, but come earnings season (ie Oct.), I find it hard to beleive we do not see more downside and hopefully some panic.
This morning in Europe felt like really crushing experience for the bears with overnight stops run in futures. You have to be commited bear to not capitulate here
I am however under some impression of this rally and I lowered my stops in ES from Fed high of 2011 to today’s highs at 1930. SPX did not even entered yesterday’s gap territory.
What is also really amazing is that VIX is down 1% as I am writing. No fear here.
If this is for real we need to waterfall from here and I want to see some fear.
Even Caldaro wrong footed. His count is incorrect at the outset because his wave 4 cannot enter his wave 1. The whole count is an example of trying too hard to prove something instead of just counting it correctly. Bears got an impulsive kick down into the C wave of Primary IV. Its a 38.2% retrace on the first leg, not a rout. The retrace is corrective in form. But no, ignore it all and gaze at the sun with naked eyes.
Peter_ as usual I’ve read your missive a ‘few’ times and I’m going to have to end up requesting a picture please. Thx.
Hardly a missive compared to so many discursives about. OK Perv first you need to understand the basic rules of EWT. Not a hybrid take on it by someone else. We need to be on same page about this. Then you should look at Caldaro SPX daily count which is what I grumble about. Same with his Dow transports etc. daily. His wave 1 is supposed to be impulsive in order to now point at all major US indices turned bullish and now entering impulsive wave 3. By now this essay should have sent you to sleep.
Peter_ I’ve looked at Caldaro’s SPX Daily. It doesn’t even mention a 1. His SPX-50Min does mention a 1 but that is clearly nonsense because its a 3 waver.
Perhaps I’m looking at the wrong thing but this is the link I’m looking at:
http://stockcharts.com/public/1269446/tenpp
Ignoring Caldaro, you mention that this first phase of C of IV, is a 38.2% retrace on the first leg. I’m struggling to comprehend that too.
Hence my request, again, for a chart showing where you think we are at.
Jeez Perv you blinker yourself. Its clear on the hourly. First you prod and when I make a simple memory quirk now you want take a bath in it. Don’t ask anymore just go figure or bug someone else. And do some blog service – go tell that Isaacson this is not speakers corner whilst you at it. Missive indeed.
Hi Peter_ firstly many thanks for posting your chart about the 535 Wave IV showing your interpretation of the count.
Secondly, I’m sure you know that you have a certain eclectic (cryptic for me) style of writing which makes comprehending your messages difficult to me. HENCE my need to ask detailed questions in the hope that answers to those will help me understand your original message. I have no wish to annoy anyone and apologise that you felt annoyed by my questions. Equally I never want to wallow in anyone’s ‘error’. God knows I make enough of those myself to even consider that.
Despite your rather cryptic crust I had got the impression that you were interested in a discourse on things EW. However it would appear not.
I did have some questions regarding your 535 Wave IV count but in the interests of world peace and blog harmony I’ll refrain from asking them.
Regarding Speakers’ Corner, I have always held the alternative view that blogs are like virtual Speakers’ Corners…open to all and sundry to say their piece in peace. Like Speakers’ Corner you learn early enough which characters interest you and so on subsequent visits you can quietly pass by those that don’t. So it is with blogs. Easy Peasy really.
Big recovery today. I’m fairly neutral on markets now. Waiting to see which direction they break before committing to bigger positions. Would still like to see a retest of August lows but seems like a lot of buying going on recently.
I look at today’s Spy candle, it looks bearish to me, just like similar instances recently. A little pop tomorrow then a plunge would follow the same pattern.
A weekly candle looks more bullish, but at this level would still close lower than last week.
Tomorrow will tell us much about short-term trend methinks.
PS… come on Peter_ draw us a nice chart, I’m curious as to whether this is your wave 5 already underway? Poor effort so far.
If you have to ask… http://barestbodkins.blogspot.co.za/
More questions I fear. As for just how Caldaro got it wrong – early tomorrow
Yes. Its what I see.
Did I mention I’m colour blind? True.
But thanks, I can decipher that.
BlueStar, hello, you’re expecting much lower lows I know, Peter_ is expecting a wave 5 up after this bottoming.
GM,
I am open to other possibilities when we get there. But this is what I see before me.
To be fair Blue, having read all of your posts at IBankC, you were calling for crashes/the top way back. and on an ongoing basis, so what you *see* now might be wrong yet again.
It’s a coin flip as far as I can see.
GM,
I have a large swing short on since may. So far as I can tell the market is correcting so I am not sure what you are referring to. The trend appears to be lower.
Krish, I agree with you. ES contract tried to return to its falling channel but was rejected and looks quite bullish now. SPX gap was not even touched and index finished higher. Textbook third wave launch ?
And VIX was not afraid for all the day. No – it does not look like the bear market in crash phase should look like. If tomorrow gets like today then I’ll close my shorts and stay neutral. It may be 2007 again, I still remember that bear trap into beginning of October of that year.
Another big move up today. This is great for day traders! But in terms of the bear market there is little recent evidence we are going to waterfall again. We might just trade in a wide range for a while waiting for more confirmation of economic slowdown or potential recovery.
We are in the N-D period as per 2007?

pulp please may I ask what’s the N-D period as per 2007? Thx
N D period is on the x axis and is november to december. Is history repeating 2007 or not.
Aah ok I now understand what you mean.
Can’t tell from current action if that’s where we are though.
For over two months every trade I have made in Commodities has been profitable. I have already taken profits on my Soybean longs and I just shorted Corn and Wheat. I know, it goes against the El Nino. The past three year’s world production has seen steady build ups in “carry overs” of the major grains and the El Nino has yet to really threaten them. In fact, the El Nino tends to send moisture to the Americas and South America is getting rains with the beginning of its crop season.
“Strong” El Ninos usually give rise to “strong” La Ninas and La Ninas produce drought in the Americas so the strong rally in the Grains may not happen until the strong La Nina immediately after the El Nino. The last strong La Nina caused a 30% reduction in Brazilian Soybeans.
The Hurricane was threatened to hit the North American crop areas disrupting the harvest but now is not expected to do so. Wheat is the strongest but today’s USA new sales was dismal which fits with this summer’s worst USA sales in over 30 years. The world is flooded with Wheat. Both December Corn and Wheat are finding resistance at their 100 day ma’s.
From a Delta “wave” counting perspective I now think that the Grains are making a high Medium Inbetween point so that their 2s won’t be a high but a new low that brings in their low long term 5s.
I just went long Corn and Wheat. Very bullish on large break outs for both of these over the next several months.
I am sorry that many are upset that I have been successfully trading what I think is the more powerful “cycle” of two different Celestial Bodies: the Moon and its 18.6 year Declination cycle; that is, its strong El Nino and strong La Nina.
Clearly, the Solar Cycle is the weakest in over one hundred years while the Lunar assisted El Nino is expected to be one of the strongest –ever. Immediately after the El Nino the La Nina will probably also be a strong one too. Do you want to trade on weakness or strength? I am trading on strength.
Hurricane Joaquin –was– threatening USA crops in the eastern areas but now it isn’t threatening; but, will most likely save the Russian and Ukraine winter wheat. But it doesn’t end there.
This El Nino will produce a warm winter in the Northern Hemisphere and that means no threat to Winter Wheat. Food deflation will persist in the USA as Winter energy demand will be light, thus, causing lower prices and more money in the American Consumer’s pockets.
I expect this American Winter economy to be strong and the opposite of the past two years. Yea, I know, it goes against the Solar Cycle. But remember, the Solar Cycle is the weakest in over one hundred years and the El Nino (assisted by the 18.6 year Lunar Declination Cycle) may be the strongest on record.
Can you post some evidence that the lunar cycle affects El Nino?
The threat of Hurricane Joaquin hitting the USA was producing some serious “pessimism” (Elliot Wave concept). It was causing pessimism of the harvest of the Eastern Corn Belt along with pessimism of the New Jersey energy centers. But as that pessimism dies, along with the odds of Joaquin hitting the USA, that pessimism will turn to optimism and that optimism will add to the usual rally from Full Moon lows to New Moon highs.
But it won’t end there. As Joaquin arcs off to Europe the “narrative” will become how beneficial the El Nino will be to the USA winter economy…and it will.
Optimism will be running wild this USA Fall and early Winter as Weak Father Sun will be limping along assisted by Strong Mother Moon.
Gold on all important trendline connecting July (1077) and September (1099) low.
That must hold, otherwise we get to new lows quite soon.
OMG!! Has the ‘good ship’ just righted itself? Bad news is now ‘really’ bad news?
I.E. a poor jobs number means the stock market has to fall? This is all a bit too much for my 2 brain cells. I’m going to lie down and contemplate on my navel.
Things should right themselves by the time the market opens. In the mean time a ‘bunch’ of ‘long stops’ just got hit. You have to ‘LURRVE’ the MMs.
Do I mean ‘right themselves’ or is it ‘capsize’?
For those with ‘VERY STRONG CONSTITUTIONS’ this (DJIA 16125) would be a great time to go long with a stop just below 16080.
Count me out though on account of a very dodgy ‘curry’. Lol.
Apologies to those with ‘VERY STRONG CONSTITUTIONS’.
I closed all index short positions and initiated few longs here. It is all about Fed again.
Again, VIX shows almost no fear today
Ho hum, it’s Friday and for a moment there I thought we’d drop out of the ‘waffle range’ but it doesn’t look like it now.
For the record I’m still favouring the ‘up’ side unless we drop below 15800.
G’Weekend to all. I’ll watch occasionally from the ‘corner of my eye’.
DJIA 350 down….350 up. What’s not to like about this market?
Its a dogshit market in many ways, lots of manipulation in VIX and I see Citadel are doing the Fed’s bidding in the equity markets amongst other things.
I am still trying to find out who is buying big whenever WTI hits 44.50 or so for the past period….wonder if our old mate Hall is involved?
J
This may be an Inverted Head & Shoulders that I see before me: (DJIA of course)
http://postimg.org/image/x579oj3f1/
The bit that I DON’T like about the above Inverted H&S is that it’s TOO bloody perfect.
Wow what a rally! A big reversal needed on Monday or I think we start a bullish leg up. Maybe we won’t test the August lows this year. Personally I think we just need to wait for more data showing a global slowdown and the bear will resume barring any crazy central bank action which will short term pump markets higher.
PALS trading yielded a couple of percent this week.
Next week:
Phase: positive
Distance: neutral to positive
Declination: negative
Seasonals: positive M Tu, negative We to Fr
Planets: mixed with We possible high, and down from there (Uranus opp on 10/9)
which is not positive.
Summary: long into Monday may move to cash mid week.
Congrats Valley, a couple of percent per week doubles your money each year. At that rate 100 turns into over 1M in 14 years. Now THATs a rate of return to beat ol’ Buffet!!
How’s the Lunar trading going? If that starts to yield 2% per trade you’ll have a 1.6M in 14 days!!
Hmmmm!! 🙂 🙂
Thanks, Purvez. Past performance…yet when combined with technicals should work in future. Hope your intraday trades are making you money.
Will have to back check but I think the surge in silvertiday was the biggest one percentage gain in over 4 years?
I have been saying it for months. Aussie Ag/Ag miners have been outperforming.
This is going to be a bull move to rival 1976-80!
Too early in the morning….
“Will have to back check but I think the surge in silver today was the biggest one day percentage gain in over 4 years”
Not far for the totally undeserved 61.8% retrace on the first downleg of the C, but who would know or care about it amongst such erudite parsonage. La La
New post