

I’m back. Here’s an updated look at the main pillars of my work.
First, demographics. The key overarching macro issue going forward, in my view, is whether the combined price-deflationary and asset-deflationary demographic trends now in place between US, Europe and China will tip the world into recession and deflation despite the best efforts of central banks. Someone else has picked up on the theme and produced this:
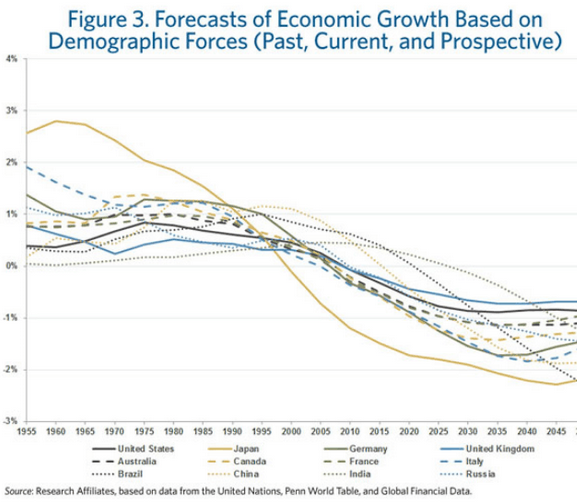 Source: Nakedcapitalism
I continue to look at leading indicators for evidence. There is no doubt central banks have some impact on behaviour in the economy and financial markets by deploying policies to discourage savings, cash and fixed income, and to encourage lending, risk-assets investment and spending. But is it enough to offset the demographics?
The latest data shows Europe strengthening (PMIs, economic surprises), USA possibly having peaked (ECRI, economic surprises), and the overall global economy potentially weakening towards late 2013 but not until then (narrow real money). This week’s US GDP release surprised to the upside for last quarter, however the upside surprise matched the retrospective reduction in the previous quarter’s data. Nonetheless, the overall global picture is still fairly ‘safe’. Europe’s relative strength ahead should bode well for the Euro v USD, and a relatively weakening USD should bode well for commodities, and if we are to see the normal late cyclical outperformance in commodities (once stocks peak) then we need leading indicators to at least hold up a little longer.
If the unprecedented coming together of demographic downtrends in US, China and Europe mean the global economy is heading for recession no matter what (given China has now peaked demographically), then I believe this will mean a severe nominal decline in equities, as central banks will be revealed as impotent, and panic will ensue. If we slip into global recession without the ‘agent’ of commodity price acceleration then I would expect the SP500 to complete an overall megaphone formation since 2000 with a potentially lower low than 2009.
Next, solar cycles. Experts still don’t know if a solar peak is ahead or behind. Here’s the latest sunspot chart:
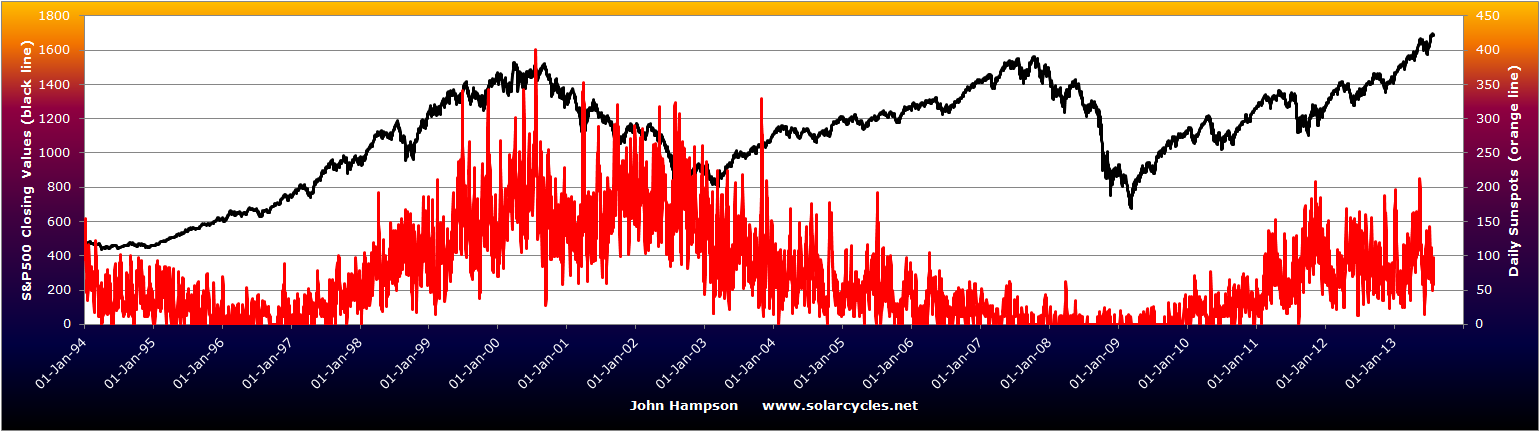
It’s clearly a weak sunspot cycle, and fairly messy. Some scientists believe there is a second peak ahead this year, which may exceed the existing smoothed max (Feb 2012). On the other hand, an overlay of SC5 suggests that existing peak may have been it:
 Source: WattsUpWithThat
If the peak was Feb 2012, then I would point to 2011’s commodities speculation including a silver parabolic together with extensive Arab revolutions as normal behaviour patterns associated with solar maxima. It should mean that we have passed the speculative peak in commodities, that global temperature may have already peaked, and that we should expect the geomagnetic disturbance peak that follows a solar max normally 1-3 years later and is associated with recession. In this scenario I would expect commodities to continue overall weakness and deflationary recession to occur.
If the peak is still ahead later this year then we may see global temperature hitting extremes and more geopolitical trouble, together with a speculative peak. All three could push up commodities in a late cyclical outperformance into 2014 with bonds already having topped and stocks topping this mid-year. In this scenario I would expect an inflationary spike to help tip the global economy into subsequent recession.
Next, geomagnetism. All models have been updated for this week, and drawing in the next 3 weeks geomagnetism forecast, we see this (mapped against the commodities index):
 A flattening out in cumulative geomagnetism in August following a downtrend May-July. By normal seasonality, geomagnetism should be troubling again by September and October. August-September would therefore be a suitable time for US equities to make a final peak in a topping process, if one began in May. Did one?
Well, so far the process is developing like a typical top. A marginally higher high is currently being played out with some weakening in breadth versus the May peak (% stocks above 50MA, Mclellan summation index). Margin debt still looks like it peaked in April, and in 2000 and 2007 this peaked 3-6 months before the stock market finally rolled over. However, this would all be invalidated if stocks push on again here and away from the topping range, with breadth strengthening again. US earnings may play a role in this and so far have made an impressive earnings beat, but a poor revenue beat rate. This means companies are making profits by cutting costs. This could be a warning if the economy shows signs of weakening, which brings us back to the importance of leading indicator readings as they come out. If central banks have been able to juice the economy just enough to offset demographics, through rate cuts, QE and verbal support (do what ever it takes) then it is feasible that this already long cyclical bull (by historical comparisons) continues. But I side with the multi-month topping process currently playing out until counter-evidence increases.
Next, lunar phasing. I have updated The Lunar Edge page and this is how the two of the most ‘sensitive’ indices to lunar phasing have performed so far this year:

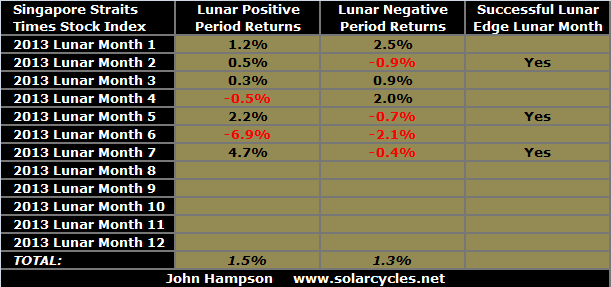
The German Dax has delivered all of its annual gains so far within the lunar positive fortnights (4 days after full moon through to 4 days after new moon), whereas the Singapore Straits has really delivered no lunar edge of any note so far this year. Nonetheless, a strategy playing the lunar edge equally across both would still have returned well overall. I continue to look to the start of lunar negative periods for adding short and to the start of lunar positive periods for adding long, in order to time my longer term trades. On that note, the current lunar positive period ends by Friday next week. If equities have been able to rise further by then, I will look at taking profits where in profit, and adding short at that point if evidence continues to support a topping process.
Because we are in a lunar positive period currently, and Japanese equities fulfilled what I last suggested look liked occurring (the arching-over turning into falls) I have entered long Nikkei again, but just a starter position. My main exposure currently remains long commodities, with greatest weighting precious metals. I have various significant loss-making positions in commodities. I continue to believe that because of demographic trends precious metals will come again as the anti-demographic. I suggest central banks in US, China and Europe will continue to have to support the economy for some time to come and that renewed dovish talk will benefit gold. For other commodities, I return to the solar maximum unknown. If the solar maximum is ahead still, then I believe temperature and geopolitical disturbance and speculative mania can inspire a historically normal commodities peak following a peak in equities. Crude oil’s breakout in June gave this more credibility. Crude has now pulled back a little, and it will be important to see if this is consolidation before further gains.
If commodities as a whole have peaked and deflation continues to press them downwards, then I will be holding increasing loss-making positions. What to do? I will be looking to average down and time mean reversion. Nothing goes down in a straight line and I will be looking to convert them into winning trades in a ‘trade your way out’ style by leveraging up. Not easy, and no doubt some would view that as too risky, but that’s what I will be doing. Don’t follow me, etc, I’m just sharing with you what I’m doing, as the money management is as important as the analysis, right? But first, let’s see if commodities can outperform in the rest of 2013, as the previously detailed evidence suggests is possible. I want to give them a little more time to gather momentum, before using aggression.
Some key assets. Gold reached important resistance around 1344. Can it break through? If not then the basing process in precious metals will need some time longer. It is confidence restoration versus short squeeze, but if the latter is to occur then we will need triggers in the news. The US dollar has been in decline since the Fed backtracked on QE-tapering-hastiness, turned away at key long term resistance. However, it could yet be consolidation before another charge. I believe it will weaken as the Eurozone relatively improves, but the Fed’s actions will play a key role. Since I sold out of short-treasuries they tracked overall sideways. This could be consolidation before further rises in yields, but as there has been no pullback I don’t wish to yet rejoin.
I am writing this post US GDP release and pre FOMC output. Both market movers, and it will take until tomorrow for the dust to settle and we see where different assets want to go. But I wanted to get the post out as my trip gave me no opportunity. Thanks for your comments and emails whilst I have been away.

Just worth sharing “The world escaped an EMP catastrophe,”
“We narrowly escape from a Carrington-class disaster.”
http://washingtonexaminer.com/massive-solar-flare-narrowly-misses-earth-emp-disaster-barely-avoided/article/2533727
havent looked so much at the Sun last weeks (my holiday), but there has NOT been any Carrington-class CME lately.
Actually I dont think we will “ever” get another one. That was a very unusual and rare incident, with two X-flare CMEs so close together, head-on… the first clearing the way for the next 🙂
Hi John
I had some signals for ~3 weeks sideways and a breakdown around Aug 1.
However my 6month cycle is bullish to Sept ~1.
So could see a 1-2 week pullback from about here, and then another squeeze that will project the next top around Sept 10. Next FOMC is Sept 18?
If this “is 2011” then we should go pretty deep next couple weeks, and then go up near the top of range ~1700 in September… and then crash.
FOMC and jobs are typical reversals… and I am looking for a top or more downside the next 5-10 days (or more).
JAn 🙂
What do you mean by DEEP ?
hi Deke
If we are making a range/sideways top, then we could go down to the lower range SPX ~1560. But more realistic (if we only have a pullback and not correction) could be to the lower bollinger, now at ~1620
Thanks guys
Found a BBC article speaking about a researcher on the correlation between war and climate change. This article reinforces the solar cycle theory…
http://www.bbc.co.uk/news/science-environment-23538771
Thanks
Mankind was created a warrior child. First it was man against creator, man against woman, man against man, family against family, tribe against tribe, city against city, region against region, nation against nation, until in a culminating crescendo of two wars encompassing the entire world happened within 30 years of each other during the first half of the 20th century. Although small wars and some very deadly civil wars and genocides occurred, they all paled to the top in wars of the 20th century. In fact, by the second decade of the 21st century, some rather severe civil wars in Africa were the only thing left (and a very small war in Afghanistan). Why did war start such a dramatic decline vs the ever increasing nature up until 1950. Some say it was the incredible destructive potential of new weaponry. Others say it was the warming climate that made food much more plentiful. No one knows for sure, but hopefully it was the maturity mankind was achieving. As an example, slavery which was a legal institution in all cultures and civilizations had long been eliminated.
I am confused by the solar cycle concept. It now seems that its a bit hit and miss as to when these occur – which means its not a reliable indicator if it can happen a year sooner than expected.
It’s been a problem that the experts can’t pin down when the max is going to happen – I assumed they would have reliable unchanging forecasts.
Weak solar cycles, like the current one, are notorious for producing a +/- 4 year plateau, rather than a clear cut solar peak. Where such a cycle is going to peak may not be predictable because there are chaotic processes involved.
The next solar cycle is now expected to be even weaker than the current one. According to some research the current cycle could become more than 15 years long (which implies next minimum ~ 2025), with cycle 25 set to peak around 2030. See: http://wattsupwiththat.com/2013/07/28/solar-cycle-24-update-2/
tricky thing that sunspot cycle 🙂
Also when doing the planetary approach, because the sunspotcycle is regulated by so many planetary cycles, and we never have the exact same sitation.
here is an attempt to compare cycles and DOW, by simplifying and picking the two main planetary cycles, and comparing with those sunspot cycles that are most similar to SC24
First the synodic Jupiter-Saturn cycle

Then the Jupiter cycle (Jupiter alone)

I am looking at both the sunspot cycle and DOW.
We see that the sunspot cycle could have a couple months more power from JuSa, and a whole year from Jupiter. I regard JuSa as the dominant one.
And when looking at DOW, all cases indicate that we should see weakness, except 1802 that behaved different
Hi Jan. The other day I came across this chart, which claims to be derived purely from planetary cycles. Maybe you are acquainted with it: http://thetempestspark.files.wordpress.com/2013/08/planet-solar-match-2.jpg
Would be interesting to know how it was calculated, as it seems to match the solar cycles well.
yes I saw it. I am currently in contact with Sparks, to learn more about the chart
one thing that is different from similar sunspot cycles, is that we are at a 80-year cycle low in DOW. So far I have had difficulties to explain this 80-year cycle from solar activity, but I think it is related to the Uranus-Neptun cycle, which again is important for the sunspot cycle
Anyway, this is the comparison I get from UrNe on DOW:

I see three weak periods, and we seem to be ahead of No 2
Looks like the FED avoided the immediate depression we got in 1830-1840 by printing/pumping the market up after 2008.
However that makes the situation similar to the 1920-30s
And the blow-off top may still has some to go…
I think trying to “trade your way out” of losing long term positions is rarely a good idea. It will work sometimes, but just as often it becomes a case of “throwing good money after bad”. Before you know it a significant portion of capital can get tied up in it for much longer than it should..
The thing is, if somebody is so good at “trading” that they can trade out of losses with more than average success, then why are they not focusing on their shorter term trading only?
The problem with considering very long term cycles is clear: they can also keep you on the wrong foot for a long time. If the cycle doesn’t pan out as expected you can be on the wrong side of the market for months if not years, waiting for a rally (or decline) that “should” come according to the given cycle.
I don’t believe there is a well performing market strategy that could go on with no cutting the loss at all. No trader is right all the time. As, (mainly) 5m DJIA trader, I was there before. Giving the trade a time, wheather it turns bad or good, is a kind of edge over the market – market must do something or go somewhere, while we don’t have to. Unfortunately it can go a long distance with no significant correrction, with pullbacks up to 30% of prior move only, it’s not enough to break even. A loss is a part of the game and ideally should not involve any bad emotional reaction. A string of losses should result in scaling out of the market and of this particular type of trades. Linda Raschke said that the 3 big sins in trading are : overtrading, adding to losses and counertrend trading. In my 5m trading, I enter from 3 to 6 trades a day, sometimes I have 4 small losses in a given day. My maximum loss is 9 ‘pips’ with current VIX, wins can go into hundreds of points. The best strategy I know is to go with the fow, adding to winning positions. A market can be in a directional trend for many years.