This is a complex time to trade the financial markets. We are trying to forecast against a backdrop of prolonged ultra low rates, collective quantitative easing programmes, united demographic downtrends and extreme debt levels amongst all the major nations. It would be generally inaccurate to say those factors are unprecedented, but they are rare historically.
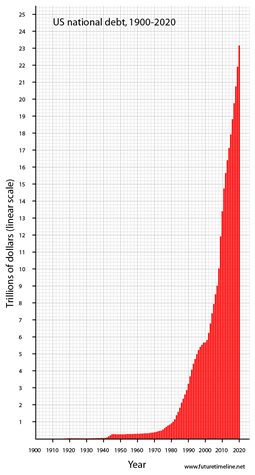
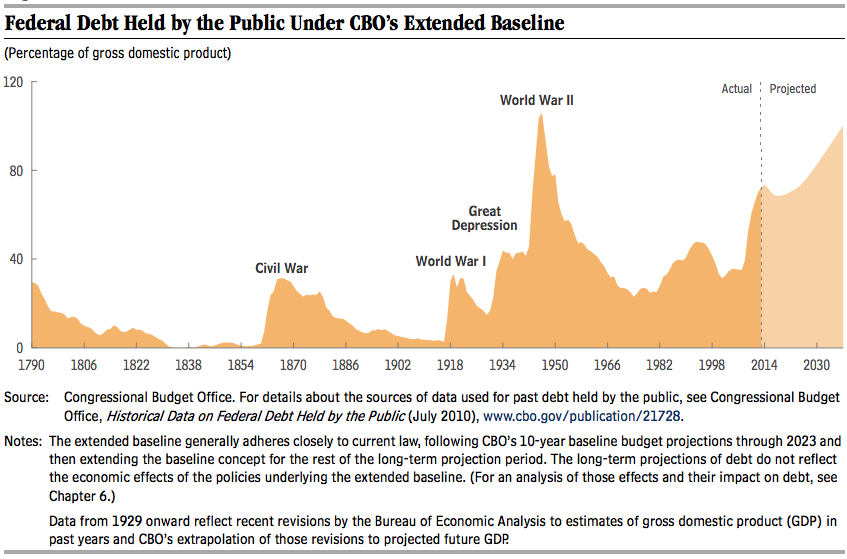
Debt to GDP levels, only like the Great Depression.
 Source: Peter Peterson
Prolonged ultra low interest rates not seen for 50 years.
 Source: Lance Roberts
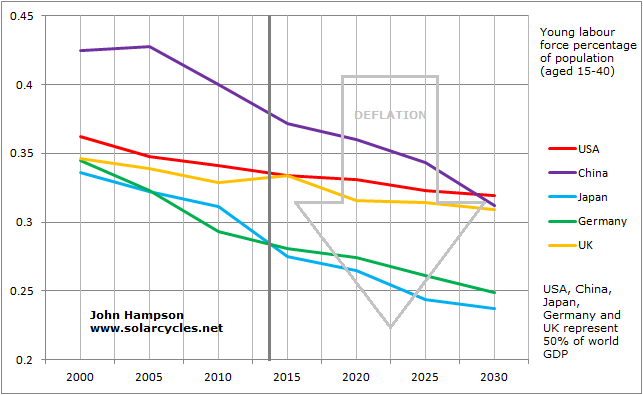
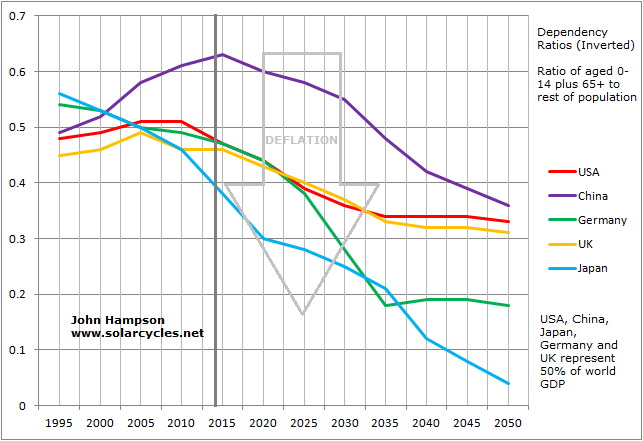
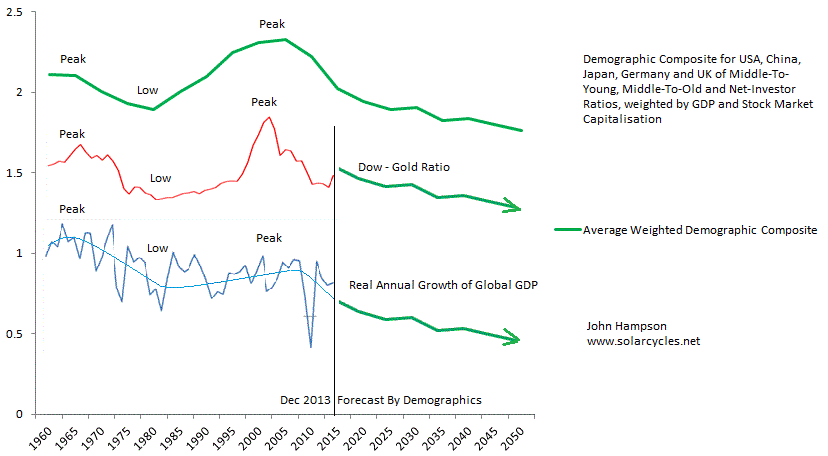
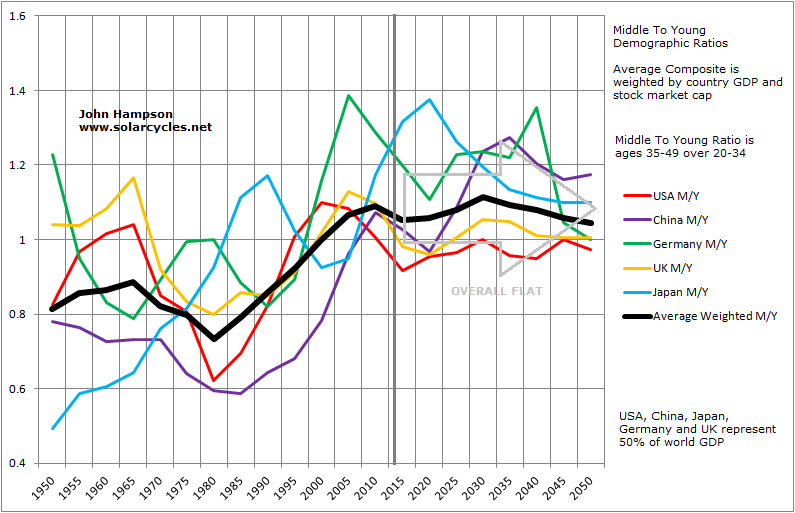
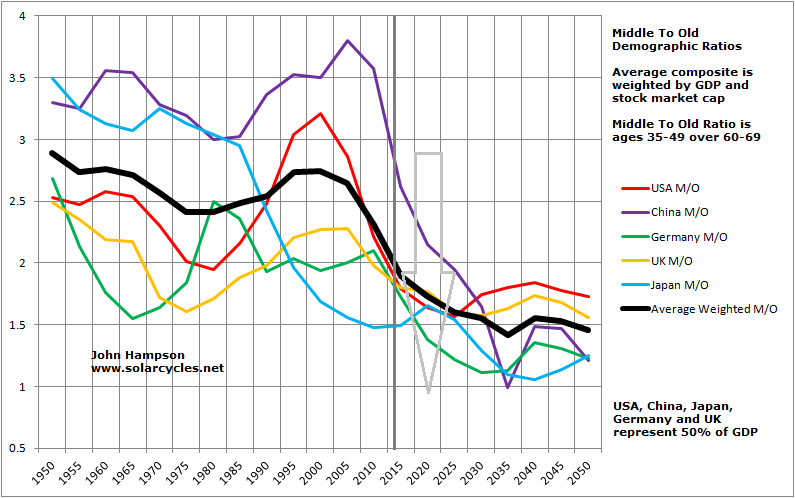
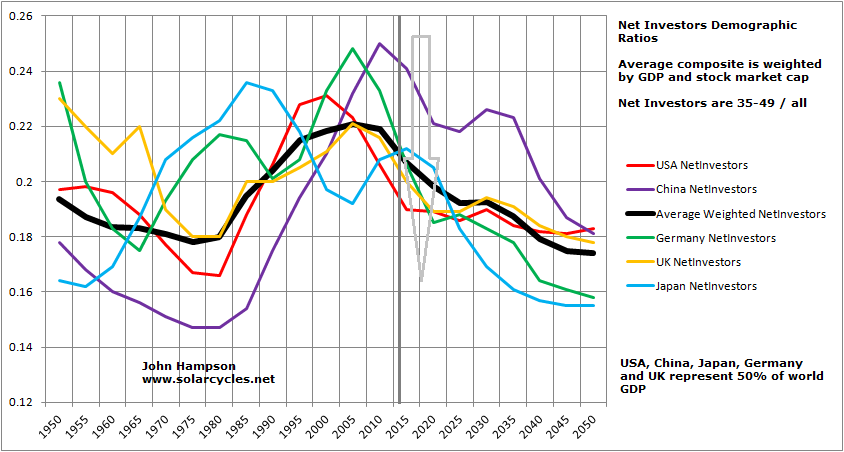
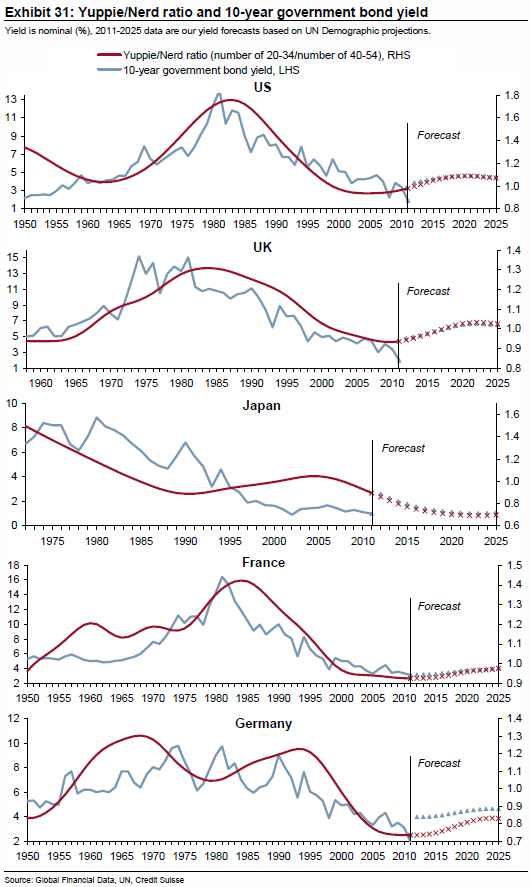
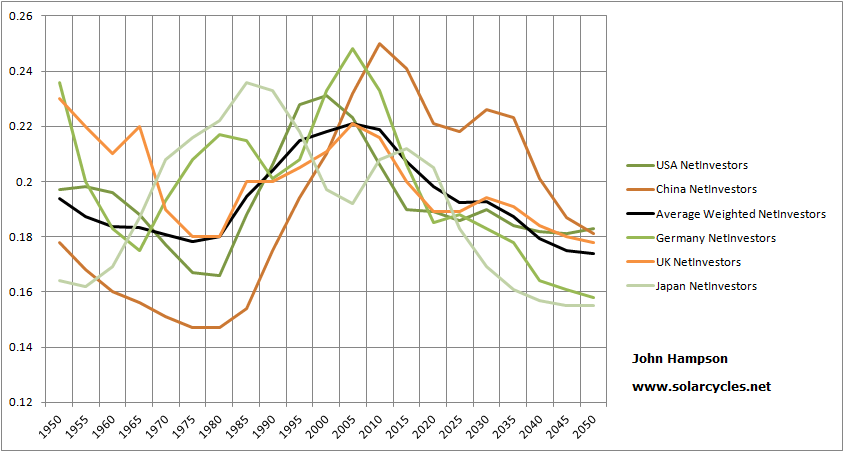
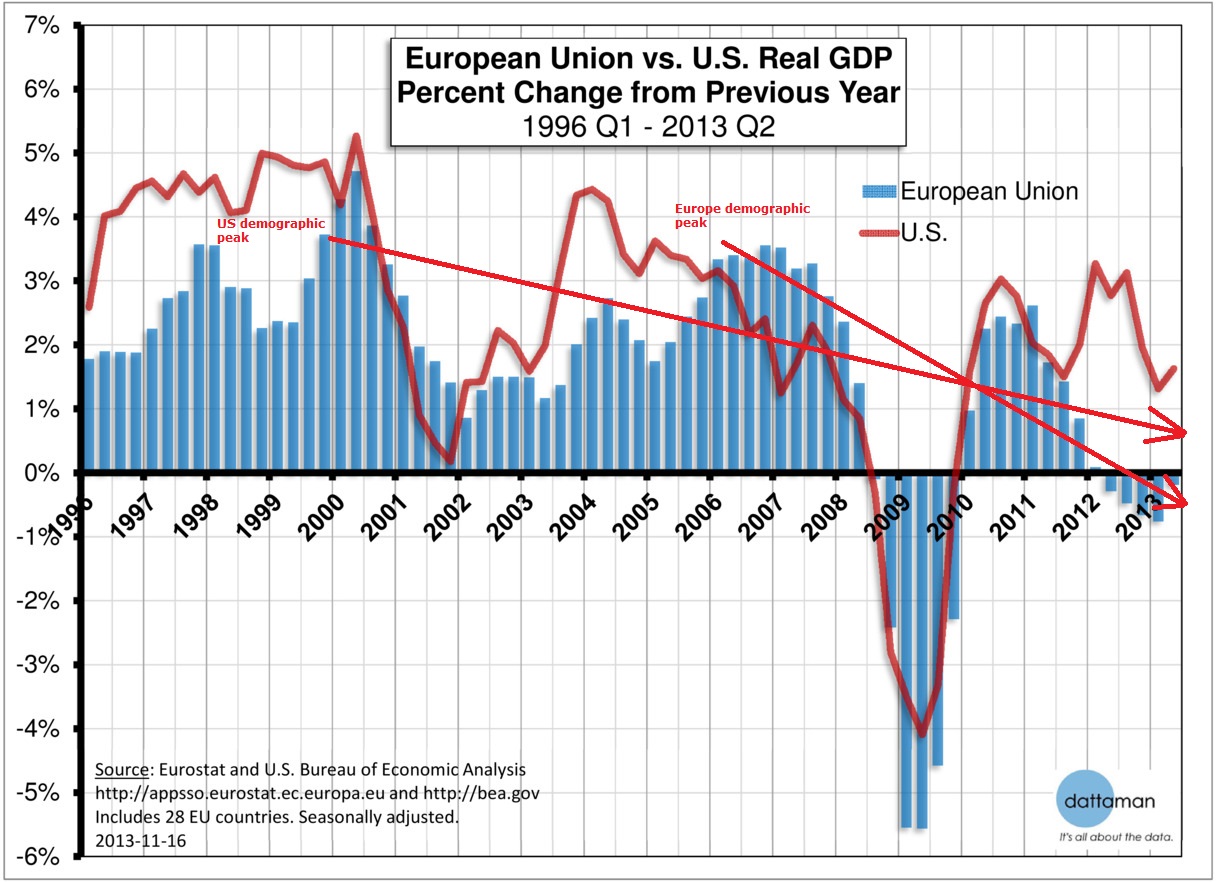
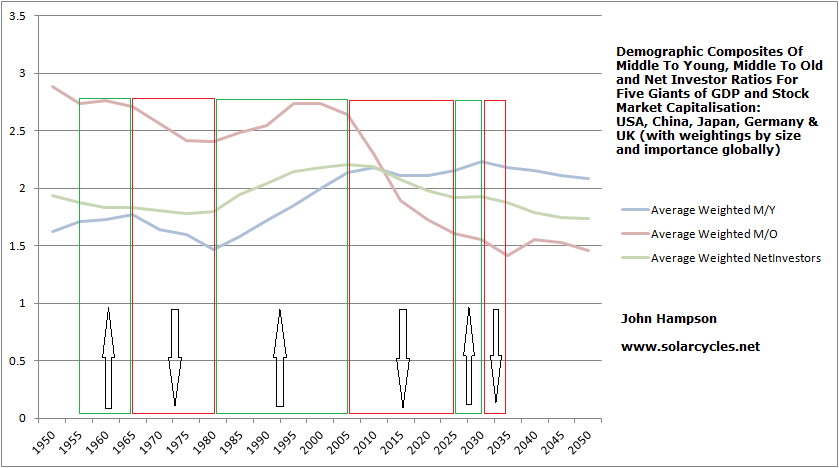
Demographics – here we are in fact making history with middle-to-old ratios, as never before has the world had such an old cohort influencing developments.

Quantitative easing: only seen in Japan the decade prior and in some form in 1930s US.
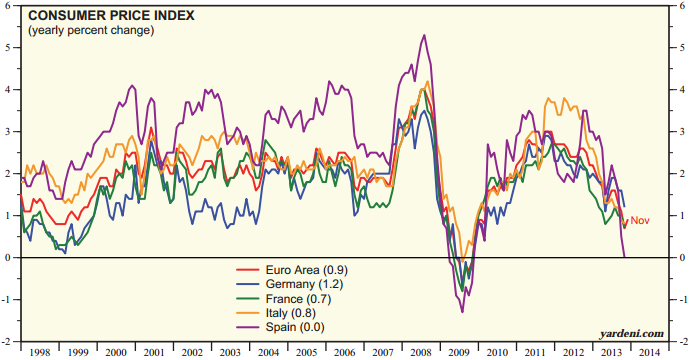
Plus, we can add that we haven’t seen such low levels of inflation for 30 years. Looking longer back in time we saw a greater spectrum of ‘flation.

Source: DShort
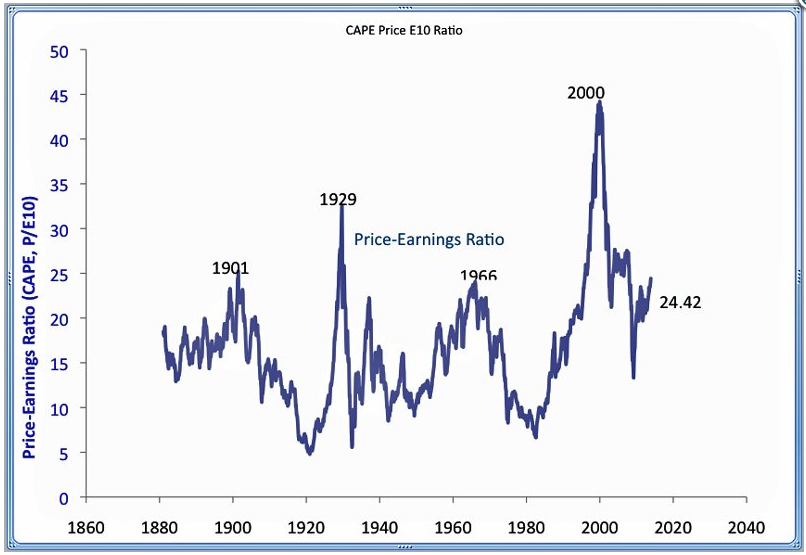
We are seeing other historic extremes too. Aggregate stock market valuations only have the run into 2000 now for company.
Source: DShort
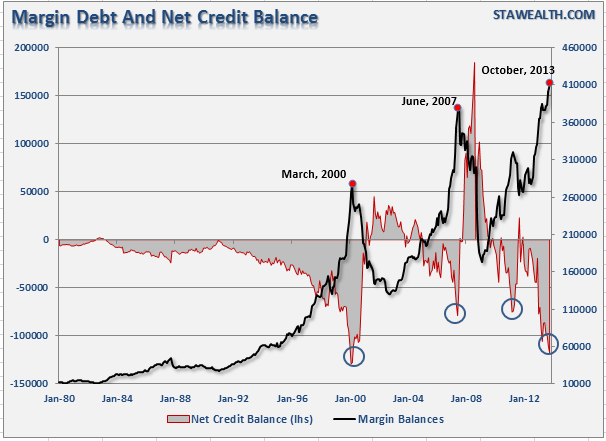
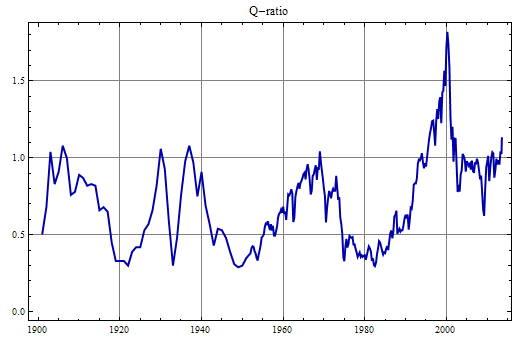
Leverage to GDP is at the same record extreme of the 2000 and 2007 peaks.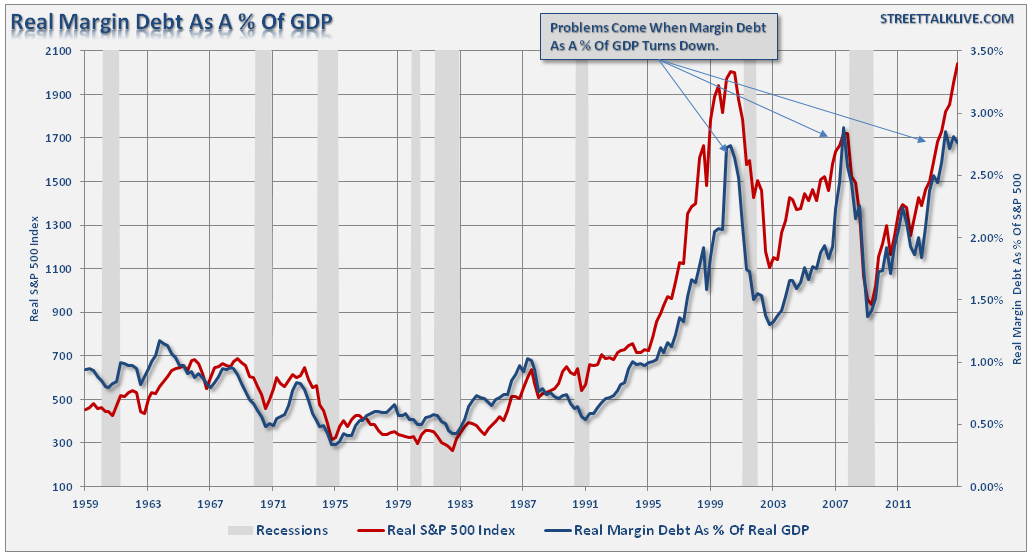
Source: Lance Roberts
US household exposure to equities was only beaten by the run into 2000 in the last 50 years.

Source: ShortSideOfLong
Fund manager allocations to global equities have been bumping up against equal record extremes.
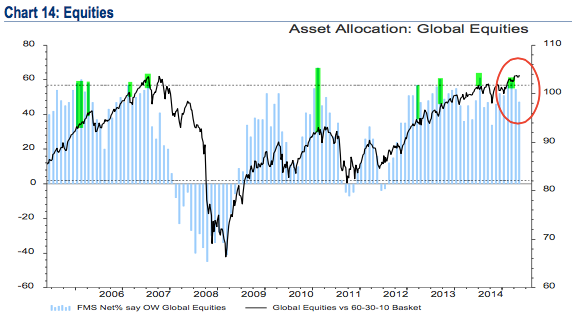
Source: Fat-Pitch
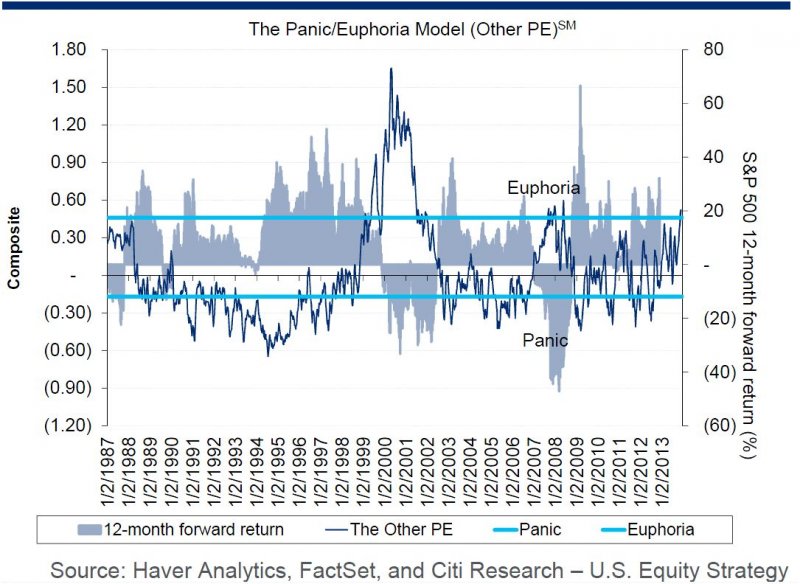
Sentiment towards equities has been record prolonged one-sided.

Source: Yardeni
Add these equity market indicators together and you get this kind of alert:
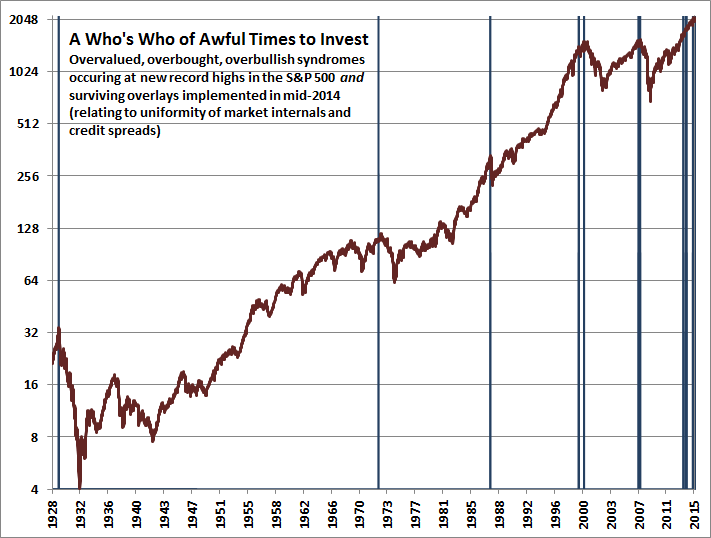 Source: Hussman
But now we need to add back in the environment, which is closest to the 1930s-40s. Or the last 20 years in Japan, which was the first to initiate ultra low rates and QE in the recent era, as it was the first major to go over the demographic cliff. How does this change things? Well, for example, we might look at valuations in the context of low inflation and argue they ought to go higher yet:
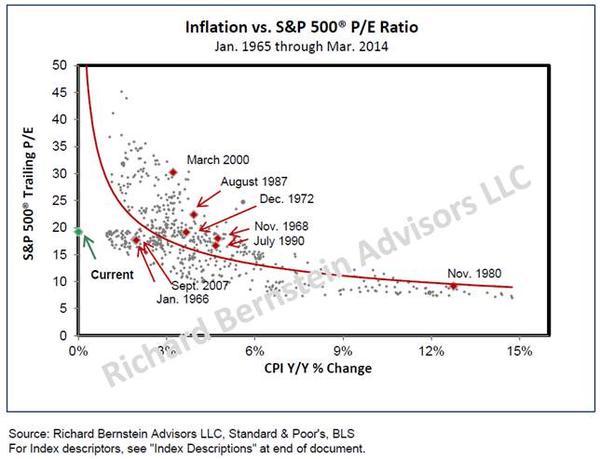
Source: Richard Bernstein
Essentially, when we combine the economic/demographic environment with the financial market indicator extremes, we start to struggle for historical reference points, and therefore some kind of reliable probability calculation of where things are headed.
But there is more to add in to the mix. High frequency alto trading has become much more dominant than it ever was. Markets are globalised – and instant – like never before. Some central banks are buying equities. Plus there are two complex areas where there is a lack of full understanding: dark pools and derivatives. Dark pools are notorious for their lack of transparency, whilst the nominal amount of world derivatives now stands at over $700 trillion (around 10 times nominal world GDP) which is clearly a major threat, but to what degree isn’t truly understood.
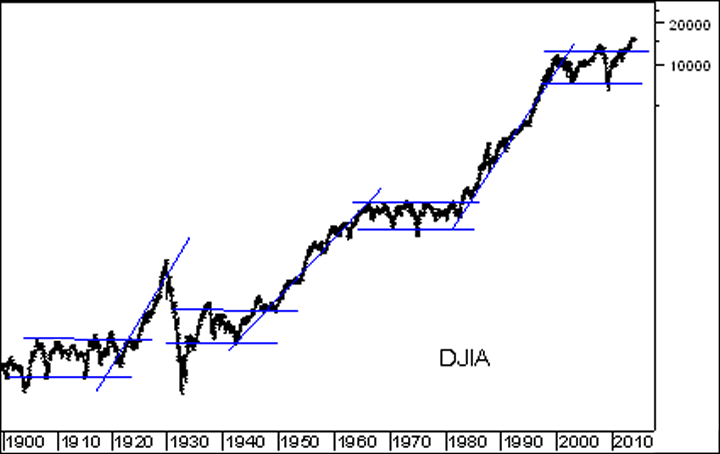
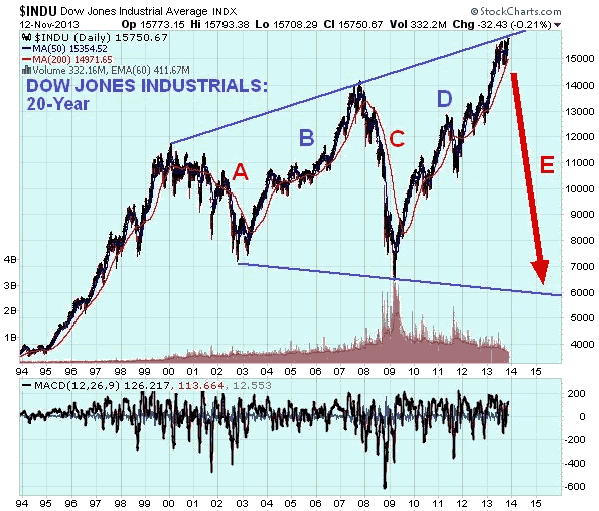
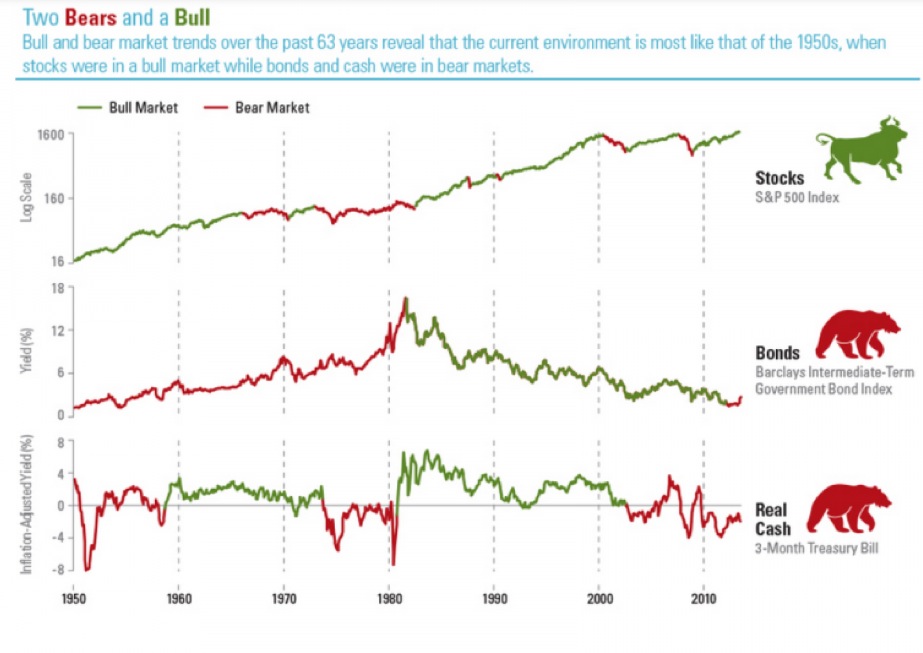
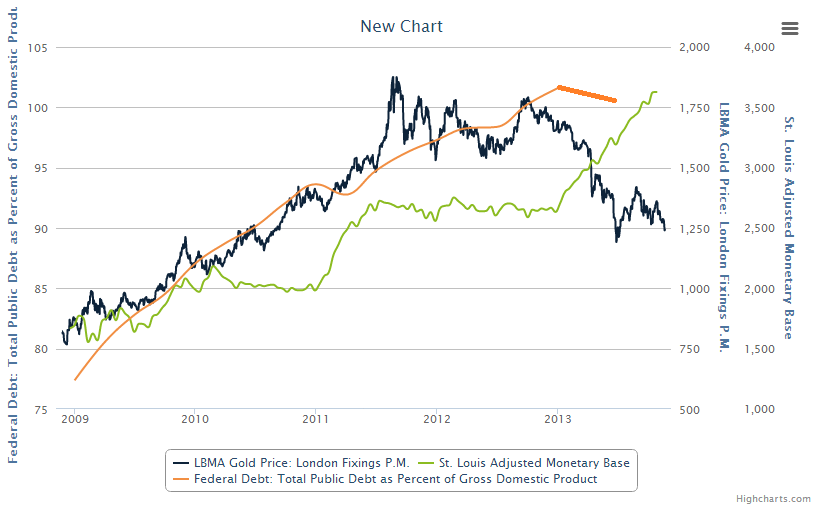
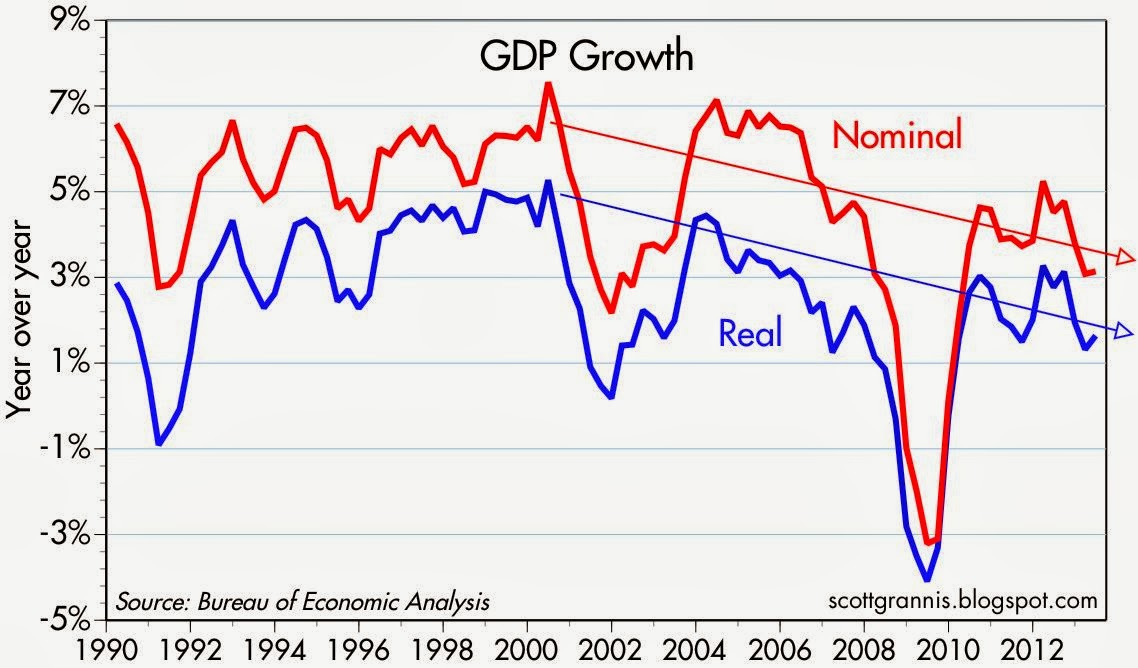
Now what does market price action tell us? Bonds are in a 30 year bull market. Commodities are in a bear market since 2011. Equities are in a bull market since 2011 (or we might argue 2009). If we look at US equities adjusted for inflation we get this picture:

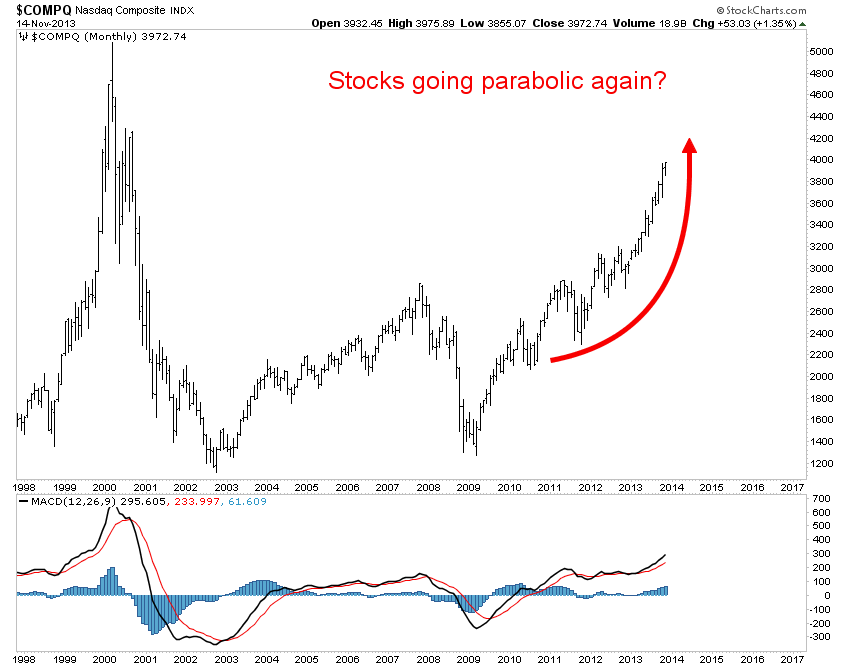
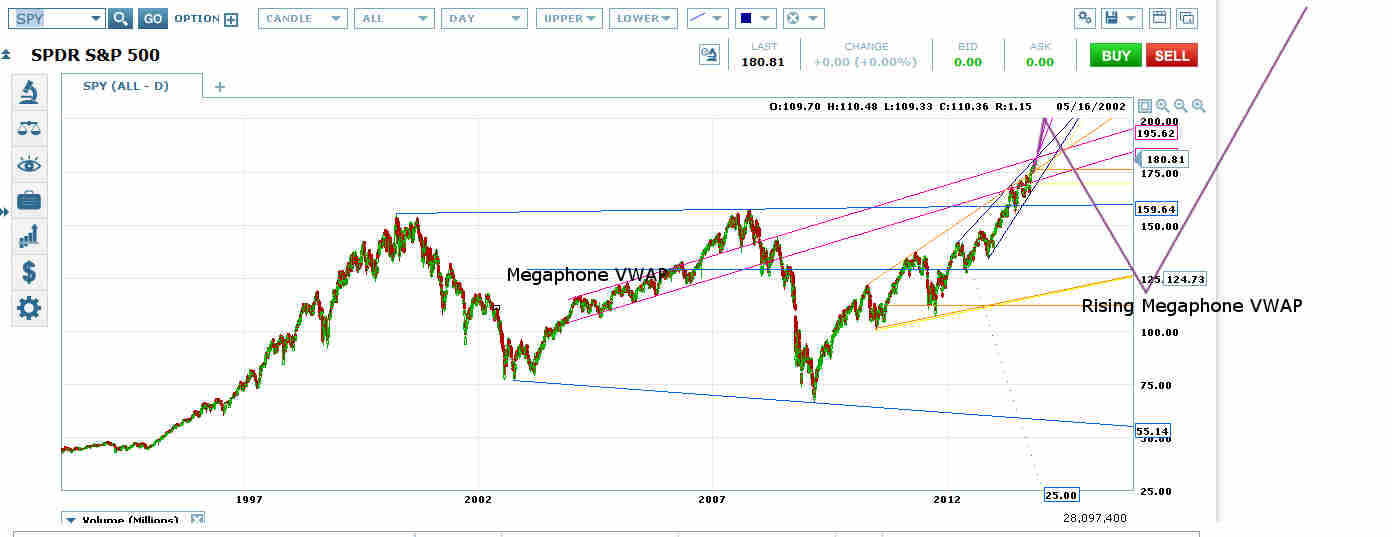
So is the equity bull a new secular bull, as per the apparent breakout?
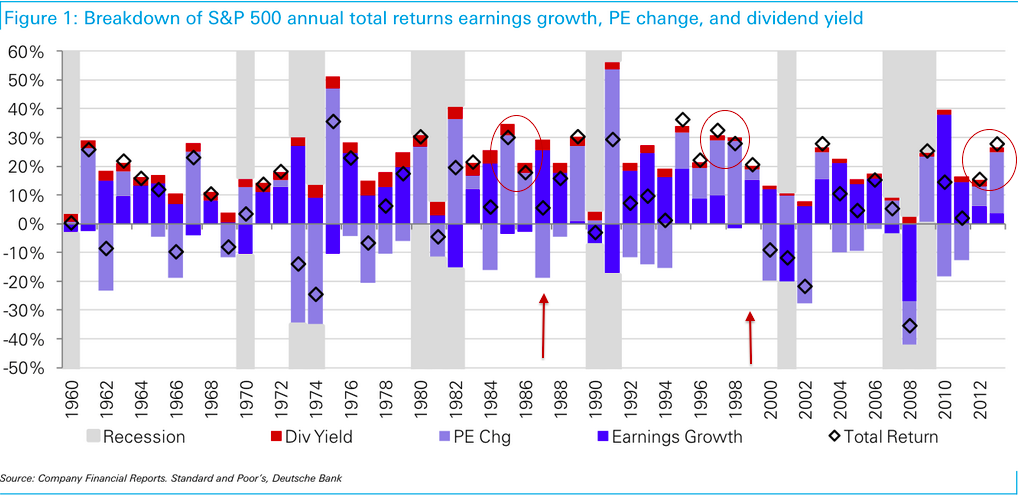
The problem is that various measures put that start of 2013 date as the beginning of the mania in stocks, such as money flow and divorce from fundamentals, and since then we have seen 2.5 years of multiple expansion (price not earnings). Another look at the valuations chart shows the contrast now to where previous secular bull markets in stocks began:
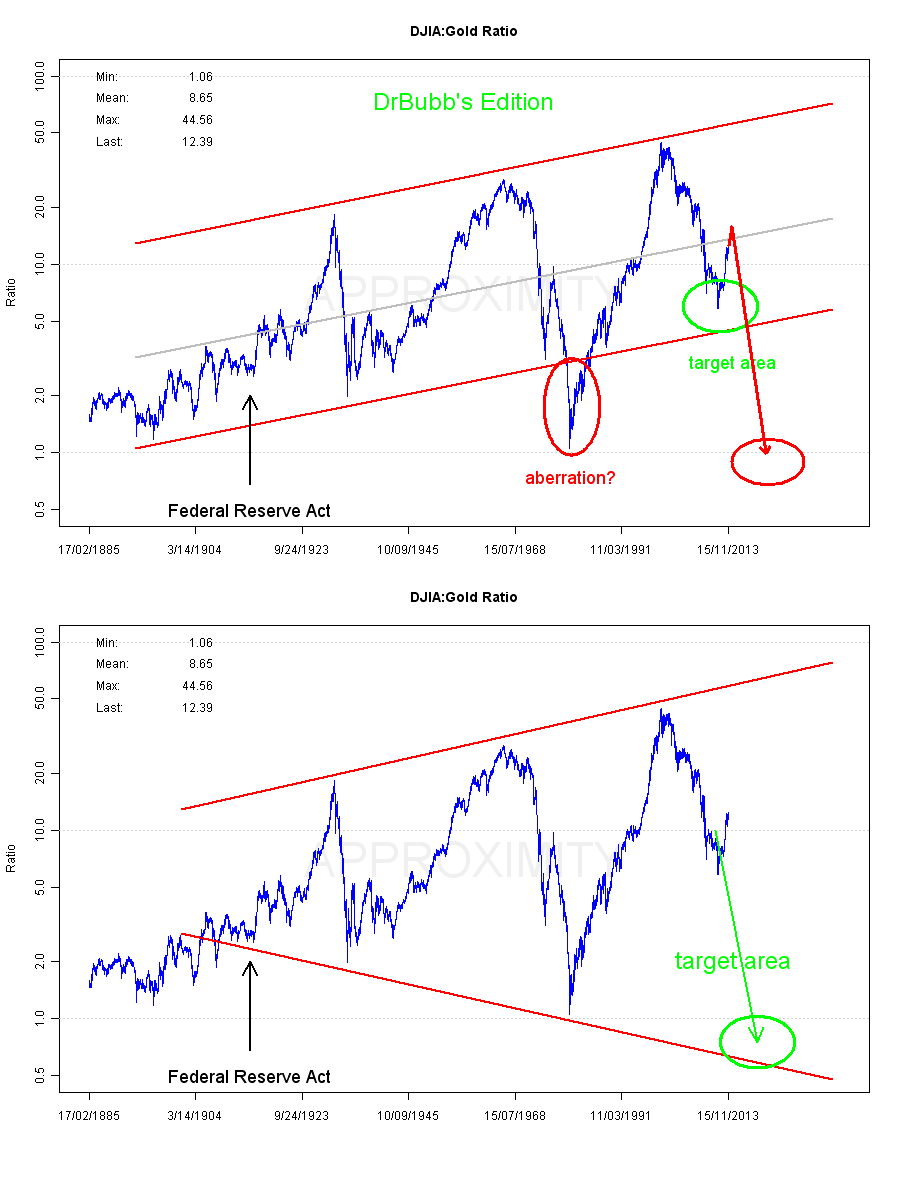
 The path designated by the arrow is the better fit with demographics and would also be historically normal from these extremes of valuation, leverage, allocations and sentiment.
However, given conditions are relatively unprecedented and we are already seeing various indicators move out of historical ranges, we have to allow for something overall unprecedented. Perhaps we could argue that valuations will be disregarded as central banks expand their purchases and in so doing overcome the demographic headwind. However, if we assume they have stepped in as a new class of buyer, then why are leverage levels so high and going higher yet? The record leverage rather fits with the demographic trends and the shrinking volumes in the stock market, namely less buyers but on more credit. However, in turn, we could argue we might see leverage taken to a whole new level (as occurred in the 1990s), much higher than currently, under continued easy money conditions, before we see a collapse. Or we could see something that hasn’t happened before from these valuations, namely that the ‘earnings’ part of the p/e catches up with price and we see all round economic improvement whist stocks tread water instead of being resolved by a bear market.
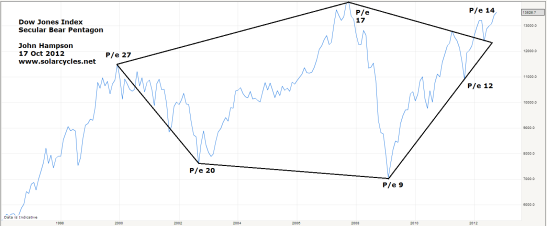
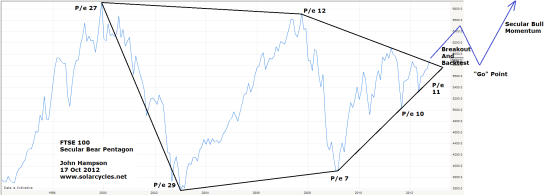
Let me sum up. 1. Stock market price argues we are in a new secular bull. 2. Stock market indicators argue we are at a major peak, specifically a cyclical bull peak within an ongoing secular stocks bear. These two are incompatible. 3. The economic environment is closest to 1930s-40s US or the last 2 decades Japan, but when all factors are considered has no reliable historic precedent. This is unchartered territory.
If the equities bull is to continue then history will be made, either by central bank purchase expansion, leverage ratcheted much higher under low rates, valuations/sentiment/allocations being reduced from these levels without a bear market, or some other unprecedented development. If a bear market is at hand, then this would fit with demographics and stock market indicator history, but would have limited historical precedent in occurring whilst rates and inflation are low, such as the 1937 stock market peak.
Part 2 ahead.