

Demographics may be a long term theme but I believe it very much has relevance in trying to work out what’s next for the markets.
US demographics turned around 2000. Here we see US GDP changed trend around the same time, and with US demographics negative for this decade, that trend should continue. To be clear there are large oscillations within that but the overall pressure is down.
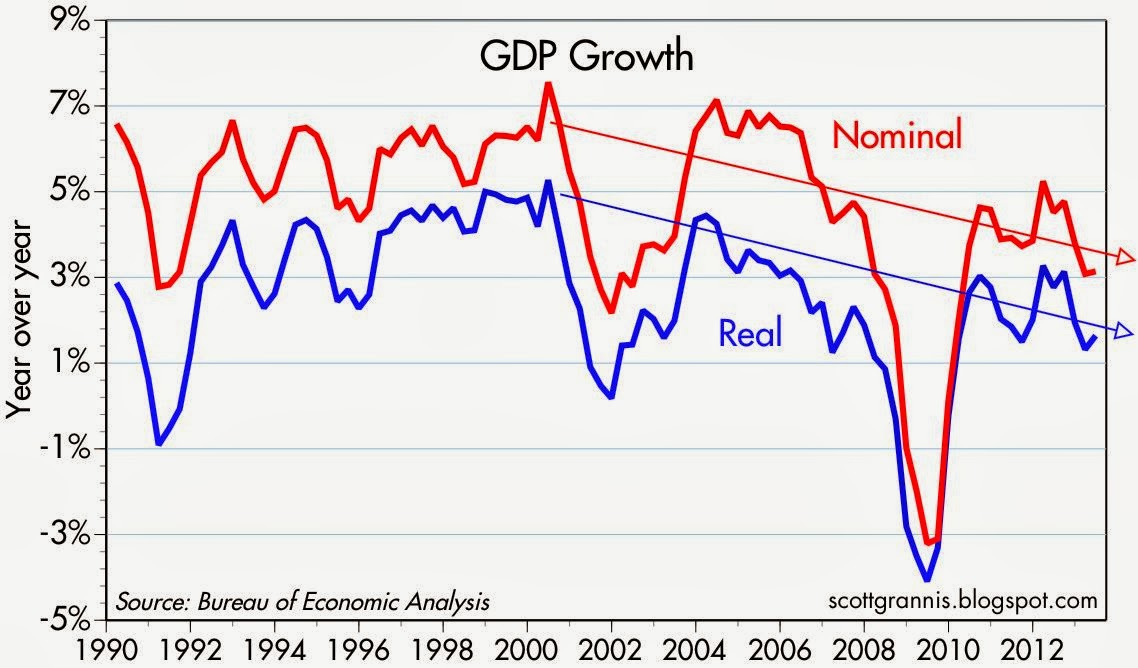 Source: Scott Grannis
Here is my demographic (weighted) composite again for the main 5 economies of the world.
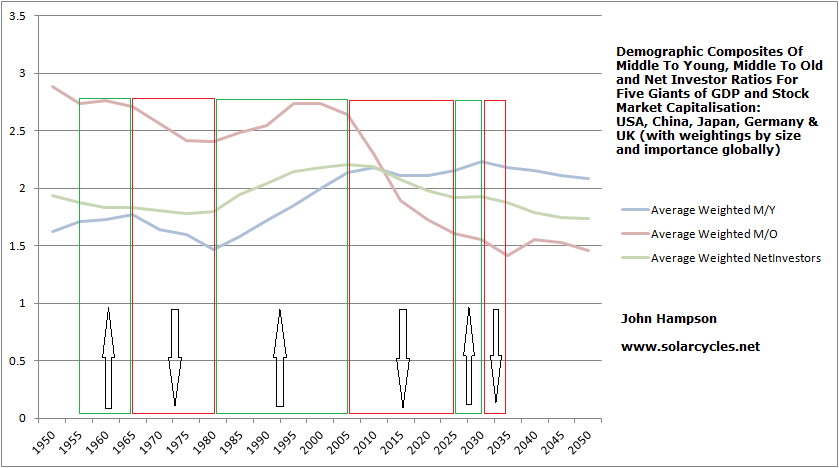
And here is real global GDP, which again matches the trends in global demographics (represented by the line overlaid):
 Source: TheNextRecession
In short, the demographic trend is recessionary, and I believe the global economy will at some point get the trigger or catalyst to tip into negative growth again, either through excessive bond yield rising tightening or through excessive commodity price rises, which would be a temporary inflationary shock. I say temporary as I previously also showed the relation between demographics and inflation/deflation which show the trend in place now is price deflationary:
https://solarcycles.net/2013/06/23/demographics-disinflation-and-deflation/
“A swell of people aged 15-20 entering the workforce works up price inflation through spending, whereas more people entering old age relative to the work force is disinflationary through saving and disinvestment.”
The Fed is targeting 2.5% inflation, but the demographics say this is unlikely to be achieved. Also, GDP is going to remain weak and central banks are going to need to maintain intervention.
The latest US inflation rate came in at 1.5% annually. This is lower than most current treasury yields. The Fed wants inflation to be higher than yields in order to reduce its ballooning debt (by inflating away). Bond yields may still be historically low, but the demographic trends in place mean that inflation is low and growth is low. It wants to stop yields rising to 3% for fear that this level would be enough to tip a weak economy and to prevent it entering a deflationary trap where bond yields exceed inflation. Indeed the Fed’s Bullard has said that if inflation dropped to 1% annual he would want QE to be increased.
Which brings us to commodities. Can they rally? The demographics are largely against, as demand should erode and hard assets perform best in inflationary trends. On the flip side, the easy money conditions mean a loss of appetite for stocks could see money flows into commodities in a speculative momentum rally. History would suggest they probably can as late cyclicals, but history has not seen this collective demographic downtrend before between most of the major economies.
If I was to advise on a buy-and-hold portfolio for the next few years (I am not an advisor, don’t follow me etc) it would look something like this: long japan equities (positive demographics for stock market), short usa/europe/china equities (negative demographics), long gold (go-to asset as anti-demographic), short energy, short real estate, long cash with bias to asia currencies (all deflationary).
Russell Napier believes that there is trend-following in place in equities currently, but that eventually perception will turn to how QE and ZIRP have failed over 4 years to return the US to normal growth and stocks will turn bearish. I agree that this will happen and see developments ahead that can force it. If the US pulls back on government spending (debt ceiling 30 Sept) or stimulus then earnings should decrease (as per recent post) and yields should rise further, respectively. If commodities make a speculative rally they are likely to tip the weak economy over, and if they continue to decline in a deflationary trend then US inflation is likely to fall yet further beneath bond yields. In short, the Fed is in a trap, and it is a demographic trap, and a particularly potent trap because of the collective demographic downtrends amongst most developed countries, making for a downward global pressure. I don’t believe it can create sustained inflation or normal growth UNTIL demographic trends change. Collective demographics do start to improve once we get to the end of this decade, but over the next couple of years I believe there is really no way to avoid a global recession and harsh nominal stocks bear. Either yields, commodities, reduced goverment intervention or increased government intervention should tip a fragile economy over.
What does that mean for trading? Well, for me personally, I like to play an asset one way, siding with the longer term trend. If it goes against me nearer term, then I can use money management and averaging, with the conviction the longer term trend will ultimately drive it. So my anchoring would look something like that imaginary buy-and-hold portfolio I posted just above. Right now I am long energy (oil and gas commodities) which is a concern if deflationary trends dominate. However, solar cycles / historic topping order / easy money speculative conditions may yet deliver the decisive rally that I seek, so I’m going to carry on holding for now. With equities I am looking to build on the short side from the current position but am looking for more evidence of stocks topping. The technical action of the last few days has added weight to this, but we still don’t have ‘enough’ all round evidence. But this is trying to be as accurate as possible with timing, for the yearly trading P&L. I have sold my other longer term equity-related investments over the last couple of months and moved them to cash.

John, you have ou donet yourself, which is saying a lot. Demographics are so impt and virtually ignored. I also recently came across Georgian economics. It takes into account real estate in economics which is largely ignored by economists. It should be land, labor, and capital not just the latter 2. The 18 year real estate cycle predicted the 2008 Great Recession/crash.
Would be interesting to see more work on real estate prices =). Herengerech index is good to start… But from my own testing and long work in the sector I do not believe in any of the funnymentals or cycles there either just price. =) The stories are just stories that you just can not prove. Just embrace trend. We have a Real Estate Bubble in Sweden yes but the trend continues and it is meticulously difficult to time the cycle because even if it is connected to the sun and planets – I think God created the universe without a key – so timing the sun is not better than just looking at the chart unfortunately is MY conclusion – right or wrong. What are you supposed to do? It should crash but it does not – yet. One can only define ones risk. Even though demographics are interesting I do not believe it matters for you to be a successful investor or trader.
The same goes for “value investing”. What counts is price, everything else are just theories to screw with our mind and look for some explanation and more explanations and more explanations to trigger some k-not. Prem Watsa himself preaching value investing (the guru) and still he managed to fuck up for the share holders and luckily for me that was originally educated in value investing this case has made me just drop the paradigm completely (I had a problem (k-not) that I did not want to let it go entirely – thought it mattered (after all I spend so many years at university learning it all (getting those top grades) and working with it a those fine bulge bracket firms that fleece retail investors with their analysis) – now I am disgusted – but Seykota psychology has finally got me on the right path and Watsa away from the wrong). I knew Seykota was right but I still could not let go. Now the bond is broken. I feel lighter and stronger psychologically. Watsa proved that value investing does not work or rather is irrelevant. For example buying low p/b and 6 month momentum outperforms the market but it is the 6 month momentum that is most important factor not p/b or whatever funnymental story or paradigm our brains have been washed with. I sort of feel the same way about demographics. It is difficult to unlearn but essential for successful trading… Every time I argue this way with a person that is a fundamentalist working a day job a some bank or financial institution they get infuriated. And I now understand why through my own process. It is sad to after have invested a lot of time and effort in learning something realize that it was the wrong path and just a scam. We hence cling on and attack people that attack our thoughts and paradigm. Most people will never let it go and keep on the wrong path as it hurts their feelings. But the thing is that our Fred wants us to experience that feeling and will keep us doing the wrong thing until we are willing to experience it. It is what keeps traders in Yale.
One can be so right on the fundamental theories/cycles but still get stopped out like shareholders now get in Blackberry. The company could like buy-back half of their market cap with cash but no… The trend is causing a reflexive process that deteriorates funnymentals and management is colluding with the largest shareholder to push price down and go private. The lower price gets the more bearish analysts are getting on the “true value” of assets. They are not worth anything now they are saying even though it is not logic. Soon they will be saying that cash is not even worth anything either and stock will be trading with a discount to cash because Blackberry is to blame for all the evils of the world and triggering some k-not with people (maybe they think of it as their boss or something). Analysts will spin stories that cash is going to burn etc. Eventually cash may start burning due to the self-fulfilling prophesy. Investors will be scared to hold on to their stocks and sell. It is obvious. It is the same with all assets. It is price that determine fundamentals and even cycles I believe. Do not fit the theory to price but embrace price as it is and let go of the theories. The theories are not necessary.
I do not think there are any theories that explain price. I think the theory that explains it is that humans get very negative or very positive driven by greed and fear. And they act like animals and forget logic and reason. They sort of get into a feedback loop going round and round. It is hard to time their change so focus on risk i.e. stop loss and profit target. The entries can be random. Test the stories and theories but trade on price. The trend and cycle is fed by stories and theories that keeps the paradigm going (and the cycles extremely hard to predict). Read the book – The Crowd by Gustave le Bon. Follow the chart and statistical valid approaches. Do not gamble on unproven theories – do not try to be right or prove a theory – try to disprove your theories. Most trading theories do not work but they are fed to people to keep them on the wrong path.
Embrace the trend as Ed Seykota says. Watsa is a billionaire etc but he runs other people’s money. Seykota made his own money trading with the trend. There is a difference. The stories of value and economic theories etc are just to attract clients and “look” smart, write a book etc i.e. tell a story but it is irrelevant =) (saying that you are only going with the trend and buying higher highs will not attract clients). It is too simple. But that is what is good. It is called Ocham’s razor and more powerful. The simpler theory – the better.
What I appreciate most from your work here is posting long price series. That is interesting so if you find stuff on real estate please keep on posting =). The cycles are difficult to use to earn cash too and more interesting from an academic perspective. What works is trend and not fitting a theory about the cycle to price. It is no different from a fundamentalist work on value.
Even if you are trading a reversal you are trying to catch a smaller trend. Trend is the only thing that makes money but then there is nothing such as trend only price making higher highs or lower lows on some time frame. Do not go against it. The reason we go against it is based on our own psychological inherent flaws and k-nots. Find your k-nots and desolve them. I do not think there is a unifying theory – just our own psychological flaws.
There are only two trades. Either you go for a break out or you go for the a reversal on some lookback period. Both are based on the price making higher highs or lower lows from a short perspective on some look back period. What causes it is impossible to know consistently and irrelevant. Be stupid go with the trend – do not try to be smart – by being stupid one becomes profitable. But yes it is hard to let go and embrace the trend. It scares me shirtless.
I should probably put up a blog too and not write rambling stuff here all the time. It would just be about not believing in any theories and anti causality =), but then only I would read it and that would be even more lonely than trading =).
Win or lose, everyone gets what he wants from the markets.
Fundamentals are impt, however, greatly misunderstood. When the stock market was flat from 1966 to 1982, what did earnings do? They went up a lot, pe’s went down a lot. All fundamentalist simply assume earnings, pe’s, and prices are directly related, but they are not. Most fundamentalist assume higher earnings, expanding pe’s, and higher prices. That was true from 1982 to 2000. We are now in a contracting period. Hey, prices are easier though. But basically there are periods of expanding pe, and periods of contracting ones, 15 to 20 years each. The sun, moon, stars, solar cycles, sunspots, cycles, and demographics help us determine which phase we are in.
No. I have let go of all theories finally and for me to be profitable nothing of it all is important. It is such a relief. I am not an marketholic anymore. I do not want to understand or know more. It is unnecessary and does actually not help but hurt.
Kent – I am with you on the contracting/expanding periods of p/es and I believe we are still in a contracting cycle, although recently we have expanded a lot. Somehwere in the middle of 15 – 20 years though, just a touch to the right 😉
Robert – interesting read, try momentum with a high p/b ratio, I’m guessing it won’t turn out well.
John – I also can’t see how demographics fit in with short term trading but enjoy reading your work and also the community here. I guess demographics are one part of the overall jigsaw for you.
Regards,
Kerry
Actually high p/b and momentum works better often I found out… p/b is irrelevant. The only reason the performance is touted as better with low p/b is that in relative terms the stocks has a low number and the potential price increase may be higher but you get a lot of losers in that sample that perform a Blackberry. I do not trade without stops so it does not matter. I prefer the parabola stocks for trading fast in and out. There is always some asset making higher highs. Yes they eventually crash but doubling down on investments is good when you are a billionaire otherwise you need to pick the bottom which is good if you have a lot of money you need to deploy. For individual traders. Just stupid. Go for Michael Marcus approach instead. http://en.wikipedia.org/wiki/Michael_Marcus_(trader). You wanna take a small account to alot. Wanna be a large scale investor then do not trade but focus on raising a large fund.
Look at Facebook p/b and p/e = 3,300 normalized. And BBRY now even trading under the bid price and it will continue go lower =) while Facebook will continue. The valuation is crazy and the fundamentals too but the difference is that in Facebook people believe and love in Blackberry the crowd hates =). And yes you can double down and stuff but just realized that the trend or Tudor Jones of not doubling losers is a superior approach. Especially when you are small and can get fast in and out of the market. Until you are huge then do not worry about buying cheap stocks. =). Took me a while to accept it and it was due to a k-not of me trying to be smart and looking smart etc. =). Keep it simple and Stupid.
Only way to change my ideas on this is if there is a bidding war for BBRY and pushes the stock to fair value then I will have a lot to think about =).
I agree with you robert that some high P/b stocks may well still be travelling on their upward trajectory. Anyway I don’t like p/b as a valuation metric as many business don’t need lots of property, plant and machinery these days now we have “t’internet” 🙂
Thanks Kent
Nice writing again. Demographics is very important.
I think Bond Yield has topped for now and it’s time to go long in Bonds again.
http://stockcharts.com/h-sc/ui?s=TMF&p=D&b=5&g=0&id=p72189214364&a=272633796&r=1380134689231&cmd=print
30 Year Treasure Monthly chart.
http://stockcharts.com/h-sc/ui?s=$USB&p=M&yr=20&mn=11&dy=30&id=p53263513541&a=235025241&r=1380134818036&cmd=print
http://blogs.stockcharts.com/canada/2013/09/the-30-year-bond-momentum-is-at-record-levels.html
We still need the commodities to decide where to go.
CCI (reuters CRB).
http://stockcharts.com/h-sc/ui?s=$CCI&p=M&b=5&g=0&id=p88275313805&a=270378628&r=1380134979798&cmd=print
CRX-commodity related Equity Index.
http://stockcharts.com/h-sc/ui?s=$CRX&p=W&b=5&g=0&id=p71703720422&a=216863365&r=1380135305851&cmd=print
Thanks Niels
Nice charts Niels. I am long gold and ready for commodities to move north.
Gold found support at a Fibonacci level, but I could imagine that after this bounce to the upside we could see a retrace to 50 % Fibonacci before we see a new multi month advance to the upside.
http://stockcharts.com/h-sc/ui?s=$GOLD&p=M&b=5&g=0&id=p82301380295&a=299289064&r=1380307935211&cmd=print
Hi Robert
If we were all members of your Trading Tribe, and just watching price action,then we might wait forever.Someone must see value to move the price.There must be fundamental analysis for there to be a market for short term traders.
Chop wood, carry water, hope John and Bob see some value, place order.
Hey Bob: You are more than welcome to join =). I do not think that the time frame matters necessarily and the only thing someone needs is to BELIEVE for price to move =). Or in essence GREED and FEAR. The fundamental stories are only there to give logic and reason to you acting on your feelings. Humans act on feelings and the use logic and reason to justify their decisions. It is BELIEF that drives markets and yes it may be driven by fundamental stories but I do not think it is the path to success for the individual trader. In fact, I have many friends that are equity research analysts (I used to work as it myself) or work in LBO companies or various investment companies. All of them work with fundamentals but none of them make any good personal investments and would not be able to quit their job and trade for a living. Their companies make the occasional boom investment and then bust out. Key is to be around to get the bonus and move on =). Even the so called Warren Buffet of Canada did it with BBRY. He will make good money but not sure if his IRR is worth it. But then it may turn out he bought the Apple of the next 10 year. Hard to know that now.
Systematic short term trading is the way to go if you want to trade for a living. In fact I am 95% confident that there is no other way to trade for a living consistently as the psychological stress will wear you out. It should be boring to trade. Excitement should be in developing your strategy.
I noticed that Renaissance Technologies added stock in the summer and for example bought C. I know they have made studies on sunspots for sure and have people like Feynman working there so interesting to keep in mind… Not that I understand their strategy but it seems to be adding into trends.
Robert, your posts are very educational. Thanks.
Johh, Thanks for your analysis.
Could you please clarify “long japan equities (positive demographics for stock market)”? I though Japan was the best example of demographics not helping the whole economy, only 1.3 birth per couple, aging population, etc.
Rafael
Hi Rafael, that’s the 1990s story for Japan, and it’s the same story further out, but right now Japan has demographic tailwinds:

Hi Robert,
I ask this respectfully. Why are you such a regular around here when all you are interested in is price. Don:t you find the content just messes with your trading?
Was thinking similar and suspect Robert may soon be cutting me out as ‘noise’ – would seem the logical conclusion.
It’s interesting to read your thought process Robert, and I have no doubt you can find a successful system mechanically trading price. But it comes across as you believe you are finding the ‘one best way’, whereas my view is rather that you are finding the one best way that suits you. There are many different ways to trade the markets profitably, and every successful trader would tell you a compelling logical case for their system (e.g. I know someone who has traded just one single currency pair successfully for 10 years). I tell you mine, through my posts and pages. I guess my approach might be called working out the global macro picture and playing the main global assets, and that has been my approach for maybe 6-7 years now (once I’d got through the initial ‘trying everything’ period). I like it, it suits me. It’s successful so you won’t shift me. And I have complete conviction in it, because, in my personal view, I am well down a path of gradual enlightenment as to what really moves the markets and what are common misperceptions. I then crunch those main influences together and believe I can calculate the higher probability future. And there’s my edge. But, not forgetting money management is just as important as that, and I would suggest skill in that really boils down to the trader’s personality rather than something you learn.
You are now inverting, saying price rules fundmentals, cycles etc. For me, that’s crazy. But it matters not, because ultimately your current personal journey of enlightenment is leading you to price trading, and I hope you can make that work for yourself long term, if that turns out to be your style.
Not sure if it is that crazy it is sort of based on Soros thought process of reflexivity (he talks about it the same way) but it may be crazy. That is fine.
They are just thoughts that could be helpful too someone. Nothing critical because it really does not matter – it is your pocket but I sort of came to the conclusion that if someone – and it does not matter who – it could be John – or Warren Buffet or whoever says something i.e. gives a market lore as I call it – I will not believe it unless it has scientific backing in terms of statistical significance otherwise it may just be a statistical fluke that we use to fool ourselves.
If you have not tested enough then it could just be a statistical fluke that works sometimes and as trading and investing is more of a psychological thing that works with our egos and you want to be right i.e. your are using induction instead of falsification to prove your case instead of disprove it.
Stick to what you have tested and not the things you are feeling. I am not saying that a complete mechanical system is the way to go and there are some discretionary traders BUT of all the traders I have met and worked with over the years – if your approach is not sort of mechanical i.e. your thought process and you are searching new indicators and trying to fit it together i.e. paint a picture that is a bit dangerous and you become paralyzed and fooled by randomness. It is just my opinion. That is all. I am interested in the cycles and the work you are doing but I am also questioning some of the process and the results. I do not think John is putting it up to get traffic for his site but he wants to trade so questioning the edge, i think is valid.
The lunar edge I accept – the macro stuff I do not think has any edge even if you feel like it has and it may just be that you are spending time on it but it does not add any value.
However, if you can show statistical significance as you did with the lunar phasing then it is something else I think.
For sunspots, I would need to see statistical significance too in order to actually trade on it. Otherwise it is not and edge but a false belief. I think there is something to it but it is meticulously difficult to apply it.
Cycles could be driven by price in the sense that if you believe that the planets and the sun affects us which I find very plausible and natural at the same time if you study philosophy and physics one could argue very eloquently that we on the planet earth also affect our surroundings i.e. through consciousnesses. I mean – we do not really know if the moon is there or not. It sort of is but it only exists in your mind too do not forget that. So sticking to price I think is very important.
Then you can use chart patterns or whatever but you should stick to the same parameters all the time in my opinion because then you do not act randomly and if the market is random – it could be – there is no real proof that it is not – one can argue very eloquently for both cases – then by stopping being random yourself and just focusing on on thing you because successful. That is sort of my thought process.
Let say you wanna trade head and shoulders patterns then you only trade that day in and day out and you disregard everything else. Or you go for the moon and disregard everything else. But when you mix the edge does not necessarily get better.
Why do people get angry when one questions their ideas?
——————————————————————————————–
“Look, for example, at this elegant little experiment. A rat was put in a T-shaped maze with a few morsels of food placed on either the far right or left side of the enclosure. The placement of the food is randomly determined, but the dice is rigged: over the long run, the food was placed on the left side sixty per cent of the time. How did the rat respond? It quickly realized that the left side was more rewarding. As a result, it always went to the left, which resulted in a sixty percent success rate. The rat didn’t strive for perfection. It didn’t search for a Unified Theory of the T-shaped maze, or try to decipher the disorder. Instead, it accepted the inherent uncertainty of the reward and learned to settle for the best possible alternative.
The experiment was then repeated with Yale undergraduates. Unlike the rat, their swollen brains stubbornly searched for the elusive pattern that determined the placement of the reward. They made predictions and then tried to learn from their prediction errors.
The problem was that there was nothing to predict: the randomness was real. Because the students refused to settle for a 60 percent success rate, they ended up with a 52 percent success rate. Although most of the students were convinced they were making progress towards identifying the underlying algorithm, they were actually being outsmarted by a rat.”
No, I find it educational and hopefully you find some of it helpful too. It is just thoughts so that we can all learn. If everyone just says oh yes this is great wow then you do not have science and knowledge but dogma.
I am not going to question or comment any more. I am not out to make anyone angry etc. Was just ideas I had. Good luck to you all and God Bless!
Robert,
I find your posts intriguing and useful, even if a little repetitive. You really ought to start a blog, not only to share your thoughts about trading like you do here, but also to share your systems approach, how you go about it, what systems you’re trading, etc. I, for one, would like to maintain contact with you, but if you quit posting on this site, there will be no way to do that. So start that blog! And then come back here and give us the link. 🙂
John has very clearly and thoroughly explained his approach and why he prefers that approach. And as he said, different traders can approach the markets, and those different approaches can make money. I get John’s point about your comments: That it sounds like you believe you’ve found the Holy Grail of trading and you’re out to convince the rest of us that that’s it. John’s point, though, is that while you may have found the Holy Grail, it’s just the Holy Grail for Robert. John uses a different grail, and they both work.
Regarding the sunspot cycles, John has posted a lot of research data here on this site that backs up his theory. It’s here for all of us to study and discuss.
Good weekend to you, and to all the other good folks who comment here.
pimaCanyon: Thanks. English is not my native languague so the context I write it may cause misunderstanding both due to languague barriers and different culture. I am Scandianvian and also a trader so I do not like bullshit and can be very direct. That is just how we are and how I am – but there is no illwill etc. I know from working with Englishment and Americans sometimes you are different in your approach i.e. problems are not raised because it is not considered tactful or whatever. This is not a job but a free forum so I write what I think. And I like to talk to other traders for social contact.
Note sure if I would have time to have a blog. I run a trading business that is enough. I like to post from time to time as it is lonely and boring to run a trading business i.e. put on trades and follow a system. That is why I like to post but yeah maybe I will set up a blog. I have a bussiness webpage where I discuss some stuff like this but it is far from ready to be promoted. No there is no holy grail as you say (the holy grail is in your own head) and I am not trying to convince anyone. I have only an opinion of what I think would raise the quality of the macro posts and that is the following:
When John for example says that well this… candle pattern or this macro economic indicator should be bearish and it means that the market goes down. Ok well, it may be so but in order for me to believe it I would like to see John say or put in parenthesis that the last 100 times this happend then 70 times this indicator was actually a leading indicator for a fall or rise of X% (the standard devation is x, standart error and it is statistical significant with some test or whatever). Not just referencing some blog where someone claims something. Then also if you put several such indicator together I think one needs to test them together i.e. do they actually add a strength of signal or do they cancel the signal. But just saying that well I feel this or that since this interest rate is something or whatever I have a very hard time with that. I need to see the numbers if the indicator or input actually works or is just something market commentators through out to sound smart and have readers that like entertainement. Most people in finance are there to sell stuff not help you make money trading.
Does inflation affect stock prices? Well I do know. There are some studies but they are not very conclusive in my opinion. The sweetspot is some form of inflation but it is based on very few observarions so one can perhaps not argue like a doctor would about that drug working for a patient. Maybe inflation is entirely random for stocks? I do not know. I know that one can take may things in life and model them into stock prices even very irrelevant and crazy things that will show significance or at least appear to. Question everything.
What I do know however is that if you trade Head & Shoulder patterns in the right way well studies show that 70-85% of the time price falls 20% or something from the right shoulder. Ok then I know that if I keep going short on the right shoulder and put a stop loss at say 5% above my expectancy will be postive if I trail my stops. I keep on doing this. With the macro indicators there is no way of saying if the approach is working or not. I can take John’s word for it but that is not good enough for me. If you look at people that predict their accuracy is actally worse than 40%.
You did this with the moon i.e. put a whole trading system i.e. buy the moon and sell it (you have the signal and stop loss and profit target). So then there should be no second guessing unless you have tested for the times were you should not take the trade and found that it actually improves the results. It may be that sometimes it helps you from not having a losers but it also may lead to you having to miss winners which will render the edge useless in the end. You need to take losers in order to be a winning trader.
In the end the only thing that matters for me and it is not the holy grail but maybe yes it is were you put your stop loss and profit target and how you money manage not how you predict your entry for success. That is sort of holy grail for me. I do not focus that much on entires really anymore (I am only right 60% of the time often only 40%). I can enter randomly and end up with a wining trade in the end and postive expectancy.
When I talk about systematically, I mean that I strongly believe a trader should focus on one thing and be systematic in his approach on statistically tested indicators that define entries (the signal) and stop loss and profit target and how you move your stop loss during the trade to lock in profits. One indicator or a set of indicators that give one strength of signal and then model his profit targets and stops from that. If you run around too much and put to much belief into it you end up in situations such as the gold trade etc. You seek confirmation on various info sources for being in a postion that is a losing position as you want to be right instead of just changing your view with your signal and going the other direction.
You are looking for some magic entry signal when what matters is your risk i..e when you cut losses and take profits. You make money by taking the right profits.
I think this goes for any trading service that has some indicators or whatever. They need to give you their profit targets and stop loss targets and how these are moved during the process. The entry signal is not that important in my opinion. It is your cash – do how you like we are all competitiors in the market so not trying to convice anyone.
And yes I keep on looking to improve my systematic approach all the time but before I change it I need to have tested it and been sure that what I added or subtraced really added any value. Another thing that happens is that all approches go through draw downs and if you have not tested your approach you want to swithch to something else and it is not the right path in my opinion. Sometimes they self destruct too after a while. One need to go through the losers to have it work in the end but second guessing messess with the edge.
Ed Seykote left his job and started his own business when he got tired of the people that were doing this at the financial firm were he worked and had systematic systems (like your lunar edge). But people would second guess and wanted to predcit – they could not stick to the strategy. Ask yourself if what you are adding is helping. If it is not helping it is probably hurting.
Hi Robert, I get your point about having deep stats to back everything up – that’s an ultimate goal I can share. I try to be scientific, and I try to be transparent. But I don’t have a research team, this is a one man trading blog, and I share what I have, which grows with time. I don’t have deep stats for everything I reference, but through experience I have a feel for what works enough to include.
Robert, Like others here, I have found your comments and perspective useful. I acknowledge that they fit my own cognitive bias and the path I have chosen to travel. I would be interested to know if you have any alternative sites where these topics are discussed that you would point us toward? I’m not looking for more market analysis but analyzing and discussing the psychology of the trading process. Ed Seykota’s ideas are very interesting but his site isn’t particularly active. Thanks for sharing all that you have.
john
Norway weekly

trend, cycle and oscillations
for trading there are sverel questions, like trading setups versus conformation. Or cycles/oscillations versus trend.
In a strong trendning bullmarket everything is easy. Everyone gets rich.
And it favors trend trading in a low volatility envirnoment.
But no market goes forever.
And that is where cycles and oscillations gives us a clue. And my work says we are headed for more volatility and less trend.
After 4 years of bull, bulls are very confident, and still go long every dip. And jump on parabolics. They love it. Nothing matters, no fundamentals. Everything will last. No end 🙂
I was superbull in 2002-2008, and 2009-2011. But I am not getting bullish again before we have made a solar max bearmarket…
quick typing…
sverel=several 🙂
the norwegian index is dividend adjusted, unlike SPX
This is the unadjusted Norwegian index, still below its 2011-highs
So in a sense I have been right in being bearish since 2011… but looks like we are in for a double top
http://norma.netfonds.no/plothistory.php?paper=OBXP&exchange=OSE&from=20130311&to=20130927&period=5000&scale=linear&linewidth=1&height=350&width=700&p_ARITHMETIC-MEAN.PERIOD1-ON=on&p_ARITHMETIC-MEAN.PERIOD1=10&p_ARITHMETIC-MEAN.PERIOD2-ON=&p_ARITHMETIC-MEAN.PERIOD2=30&p_ARITHMETIC-MEAN.PERIOD3-ON=&p_ARITHMETIC-MEAN.PERIOD3=100&p_ARITHMETIC-MEAN.CENTERED=&p_FORMAT.FORMAT=candlestick&tas=ARITHMETIC-MEAN,FORMAT,
Last question. Jan – what was the average, median, min and max draw down during the solar max bear markets?
Here are some fundamentals for you: http://stocktwits.com/message/16112345 =)
Price will go where it will go. Do not try to stop it or fit your beliefs on it. It does not care about you =).
Robert
It depends somewhat on definitions… but I can give you the numbers, and also the duration of such bear markets. Maybe tomorrow 🙂
some quick obervations:
drawing the average curve in monthly data after a sunspot max bullmarket top, shows a 15 month bear market of -20%
Looking at each case, shows a large variation.
In 1806 and 1819 there were hardly any bearmarket. Only down 8-12 months, and down abou 14-19%
And the 1990 bearmarket in DOW was very very modest (while Norway was crushed over 2 years…)
The other extremes are like 1806, 1835 and 1929, down over 50%.
But mostly in the range 20-40% down, over 12-24 months, but can be 48 months and more
I´ll get back to you with the statistics 🙂
I had a Norwegian friend, very direct. I say, if it works, I like it. You say, prove that it works and you will accept it. Your directness in these posts comes across to me as a reaction formation. Meaning that this touchy feely esoteric stuff makes you feel uncomfortable (even though you actually like it) so you put out a no nonsense tough scientific accepatnce, but only reluctantly. It’s similar to “me thinks he doth protest too much.”
My psychoanalytic reply below was to Robert, not Jan
Kent: No, I am saying try to disprove your theory by falsification: http://en.wikipedia.org/wiki/Falsifiability
And show the numbers. And NOT prove it by induction which many people do when they have a theory then they go from website to website and look for evidence that support their view. I say, instead ok I have a theory now lets try to kill it. If we can not kill the theory then we have to accept it until we find something that kills or improves it.
Claiming that some pattern or idea may be bullish or bearish based on experience I will never buy into that unless the person saying that states exactly how much equity he has risked on that trade and he really had a verifiable track record of doing similar trades that I know of. Say Carl Ican buys some stock well if you buy his stocks – statistically you make money if you buy a portfolio of his stocks.
I just want to see evidence that for example inflation is a leading indicator for stock prices. If it is well then it is worth looking at. But I have seen studies that shows it is ambiguous so then I think traders should not pay attention to it. If you are trading on the Bradley Model – then keep on following the Bradley Model as it has statistical significance but why mix inflation into it? None of us really understand or can measure inflation anyways. It is not CPI.
Kent: I think Astrology, Metaphysics, religion and many different fields have merit but what practitioners are doing wrong is that they refuse to put the scientific aspect into it and that is why it keeps on being ridiculed in society as a large. However, one can approach it more scientifically and test the hypothesis and then it becomes more useful. Especially in trading – there is no room for hope and feelings and stuff if you want to be profitable. Just show the numbers =).
For example. I know that John Templeton did a study on that New Born Christians were less prown to become alcoholics. Ok then one can say that there is something in religion that makes it good for people etc. But when someone says it is just like this because I say so or whatever. I don’t know. I think that is the right way for humans to develop. We need to test and try to falsify so that science and our knowledge can actually grow. Just show the numbers and the cases it works and did not work and move from that but do not use induction and try to prove that it works.
I think your are right Jan – the problem is to predict if there is going to be a trending market or not a trending market. Buy just by accepting one strategy you will catch the trends and yes you will suffer drawdowns and chop in non trending markets. It is hard to know if the market will be trending or choppy in advance. And it is difficult to predict and since you are trading long time frames here you will lose time if you are wrong which is worse than equity in my view. I am willing to accept some drawdowns to take the trend when it starts to trend and be profitable – Not perfect but profitable and keep on trading. That is all.
Wow some essays on here! Good post John. You happen to have that page where I posted that link to the multi year Bradley? Also, FBI here in US seems to show overall crime decrease in 2012 from 2011. Crime has been shown to correlate with solar cycles.
Can’t locate it either on the site or in my mails
Robert
Here are some statistics for DOW since year 1800, analysing bearmarkets at/after solar maximum.
The numbers depends on what definitions one make, like:
-in a double top, is the first or second top the one?
-how to treat a running correction (ABC)? What if B is higher than the first top? What if C is higher than the A-low?
The bearmarkets from ~1818 and 1990 were almost absent.
The 1853 bearmarket began at solar minimum and made a low at solar maximum – inverted cycle!
The definitions can be tweaked and optimalised… but here is my general result.
I have obmitted the 1853 bear, and in brackets I have also obmitted 1990.
Average decline 36% (37%)
Median decline 31% (32%)
Max decline (1929) 87%
Min decline (1818) 13%
Average duration 33mth (35mth)
Median duration 32mth (34mth)
Max duration (1835) 82 mth
Min duration (1806 and 1818) 13mth
But one important thing to consider here, is whether one has a secular bear or not.
And now we do… until it is confirmed to be over.
So in a secular bear market, one must expect a long and deep bear market. But if we dont get it, we are probably out of the secular bear.
But not necessarily… in the period 1835 to 1860 we had three solar maximums. The first gave us a deep bear market, the second a very mild one, while the third gave us an inversion and deep bear again…
so for this coming bear market that is expected after solar maximum, that likely was in 2012, we should expect a deep long duration bear market (given that we are in a secular bear)
Could be a 40-60% decline over a period of 30-50 months.
But if we only get a mild bear of 20-30%, it could mean that the secular bear is over… OR that we are setting up some kind of inversion like the 1850s, where we stay in a range ~1300-1800 into solar minimum around year 2020, and then get the depression down to solar maximum ~2025
ooops, mixing with SPX here 🙂
when it comes to timing, the bull market top typically comes in two interval either before of after solar maximum.
Now we are at 18 months after the solar maximum – given that my analysis is correct, and that we dont get a higher max in 2014.
If we stay within the historical normal interval, the bullmarket top should not be later than December 2013.
The norm would be earlier July-September 2013
Thanks Jan
Thanks Jan and John. Will be interesting to see how it pans out. Until Bernanke says enough is enough….. JUST KEEP BUYING THE DIPS AND SELLING THE RIPS with the moon. =)
John,
Alexander Tchijevsky was put on moth balls after an extended stay at the “Hilton in Siberia”. Wikipedia says he was being reformed. So glad that our modern era allows you to express your view without any such threat. And I would like to be one of the voices to encourage and support this work. I think there are profound correspondences between attitudes of personality with various Sun-Moon combinations in a birth chart. Although we may make inferences to geographical traits, and to some degree these stereotypes have significance, they are less meaningful than the variations within a population. We can anticipate that some of us are more argumentative and opinionated than others without ever meeting simply based on a date of birth. Over the past couple of months you’ve handled yourself with poise and aplomb against a few of these more ardent Sun-Moon combination. Hat tip! And although geographically marking personality seems somehow incomplete to me identifying a generational “identity” within the context of time may have much more merit and use. Especially in the context of demographics and the economy (markets). The sense I have of your work is that “vision reigns over ambition” and potentially fuels discovery for the expressed purpose of teaching (yourself and) others. Keep at it sir…
http://www.nap.edu/openbook.php?record_id=13465&page=61
The National Academy Press published an interesting study on demographics. In many ways it affirms your own writing, research, and ruminations. Checking back on the document that started it all I find the correspondences with astrology astounding. We don’t expect the ‘next big inflation’ until Neptune arrives in a fire sign. The would be Aries, and allowing for a transition of say 10 degrees instead of at the exact ingress, brings us to May 2029. This is fascinating because the diagram on page 19 of Trading the Sun bottoms at this same point.
I would be careful at this point of over weighting this demographic element. We may experience a tame solar cycle and a correspondingly tame commodity run based on the graph you present. This suggests to me a tame fertility rate and somehow describes the gains in longevity and perhaps the avoidance of the expected “War Cycle” which would reduce population (as in previous peaks). Delay and deferred it would seem until 2034, which might suggest a more sustainable projection of our current system(s) than many “Doom and Gloom” ers presently project.
Fabulous presentation. Incredible foresight. Very very smart rationale.
Thanks for being here John…
HVA
My sun and moon are 180 degrees. My Myers Brigg is ENTP, less than 1% of the population. I’m a science and math instructor with a strong proclivity for the esoteric/spiritual.
I think you could guess that I am Sun and Mars in Aries and a lunar Virgo =). Cheers
Thanks HVA
HVA: Very interesting comment. Never thought of the Astrological element of various cultures which makes sense as place of birth is in the natal chart.
There are some repeating patterns in DOW relative to the quality/type of sunspot cycle.
Long weak sunspot cycles, with a prolonged minimum produce a weak DOW.
And current SC24 will make a long and weak minimum.
So the bias is for a solar maximum bearmarket short term, with a low around 2015. Then a bullmarket top around year 2017… but the lack of sunspots will then produce another bearmarket with a low around solar minimium in year ~2020.
So DOW should stay in the current range another 10 years at least.
Jan, this your prediction correspond almost perfectly with this: (see graph)
http://www.mcoscillator.com/learning_center/weekly_chart/40-year_cycle_in_djia/
I have updated all models this morning. Positive lunar geomagnetic pressure into this coming weekend, followed by the lunar negative fortnight. But the geomagnetic trend is more pronounced upward this next 3 weeks. Sunspots remain messy/low.
Thanks John!
Demographics implies that the number of agents and their collective buying power in the market would drive asset prices however then why is it so that some stocks/assets take virtual piggy (a pump and dump penny stock) or Ship Finance (pretty legit co) have very few shareholders and still those stocks/assets keep on pumping high and low time after time? Is not that a bit the same reason why Soros was able to break the Bank of England? I mean theoretically, they had more money than him? I am just skeptical to the volume approach in finance. Do not think it matters more than the belief of the crowd.
Message for Robert
It’s the first time I see someone that thinks pretty much like me. What you said “why do people get angry when one questions their ideas” describes me entirely. I think it would be a big mistake to quit your comments without opening a blog. I would like to learn more from you. I believe in price action just like you.
You can have the most beautiful theory but what if price action tells you something different? It also looks like we read the same books and I am passionate about how human mind works and how we fool ourselves into believing what we want to believe. Always question yourself and ask “What if” is my motto. Thank you for sharing your thoughts. They are really important to me and one of the main reason why I keep coming back to John’s website. Please stay!
P.S. Last week I started to worry that you may quit just like Antonio Alga Perez for pretty much the same reason. I still terribly miss Antonio and his comments about markets. Antonio, this message is for you too. Please come come. I miss your comments.
Message for John
John, I think that your blog is quite an interesting reading otherwise i wouldn’t be here. I also believe that is the quality of your work that attracted a high quality crowd. I think you have good reasons to be proud regarding your work. I also find your blog about demographics worth reading. However, here are the two main reasons that make me come here every day:
1. The content of your blog( excepting the solar cycles, which I don’t use for trading).
2. People like Robert and Antonio Alga Perez.
I think you are both right in some way but using different tools. I also believe in demographics just like you. The only problem with them is their timing. It doesn’t work they way people expect. But eventually, they will.
I think it would be a pity and a great loss the make people like Robert and Antonio go away forever. We all have so much to learn from them just like from you. Their comments are not mean or intended to make you feel bad. And why should you feel this way? You are definitely someone really smart and also a great writer. It’s a pleasure to read your blog. But I would love to see Antonio coming back with comments. Have you thought of maybe opening a different section on your blog about market comments only? Where people like Robert and Antonio could post what they think. It could be a win-win situation for everybody. Thank you in advance of thinking about my suggestions. I really appreciate it.
P.S. The reason why Antonio and Robert communicate the way they do is simply cultural. It has nothing to do with you personally. Not at all. I have the same problem. It’s incredibly hard for us to use the North American style because it requires a great effort. That only one issues. The other is that we don’t know how to use it in order to send our message. Believe me: we just simply don’t know. We are used to be very direct and we also use criticism in a constructive way.We don’t quite know how to avoid conflict because in our country of origin this is how everyone talks. If our comments result in a conflict or negative feeling than we talk about it and move on without negative feelings left.
And now I expect Robert to come and criticizes me for talking in his name. And you know what: I will not even be upset at all:-) I even expect him to give me a lesson about demographics. I don’t mind that either because over the years I realized that this is the best way to learn, improve and be successful.
Have a great day!
Hi Gabi. I didn’t know Antonio had gone. I don’t recall any disagreement with him. It’s hard to tell through internet how someone is feeling, but I can assure you that Robert has neither upset me nor made me angry. Perhaps I better put it like this: if someone starts to repeatedly question my approach and make regular criticism on my site then because of my conviction in what I do I am generally going to defend my approach. That may be stubborn, but I am a self-taught trader who has made his own way (and OK a bit stubborn in real life too). If someone truly bothered me on the site then I have the power to stop their posts.
Thank you gabistv. I am also not upset with John or anyone else for that matter =). We are just reflecting ideas. I will continue to be here but I also recognize that my tone is a bit too much Sun and Mars in Aries sometimes and I need to work on that. Just keep up the work John. At the moment, I more than anyone need to focus on one thing so hard to open my own blog. Sun and Mars in Aries = love many projects that go unfinished =). Key is to focus.
This is a true story but a bit off topic, so i accept if John removes it.
Market researchers wanted to determine which people were the most honest.
They prepared wallets containing some cash, a family photo, and a home address.
They “dropped” 12 wallets in each of the major cities of the world.
London returned 5 wallets …. crooks
New York returned 4 wallets…. bigger crooks.
The worst city was Lisbon. Only one wallet returned and that was by a Dutch tourist.
And the most honest city….Helsinki.
11 out of 12 wallets returned.
Here in sunny Johannesburg the researchers were hijacked enroute and the wallets were stolen before they could be lost.
So my conclusion is , the less sun you get , the more honest you are.
bob
PS Hi Robert ,you did’nt hapen to find a wallet.?
bob: LOL: Maybe… if the natal chart theory has merit then that would explain how various cultures have changed through history i.e. honesty changes. Anyone knows what astrological combination gives honesty?
Finish people in general are very honest and handshake people (in general). My new girl friend is Finish so lets hope that is true =).
Hi John,
You are right! It’s not always easy to tell how someone is feeling. But this is what I observed: after an argument with you he simply stopped posting his comments and it’s very rare when he returns. When he does post something is to ask you a question. He simply completely stopped saying what he thinks. But I am pretty sure he keeps reading your blog.
I really admire you and your work and if your method of using solar cycles really works then….all I can say my hats off! I also agree that if someone really bothers you(you must first feel bothered in order to decide that someone is bothering you) you have the power to stop their posting. That a great power. Please use it carefully. I also believe that we have the power to control how we feel.
I think the word “stubborn” truly describes you:-) Maybe one day I will learn more about how solar cycles work but for now my focus is on technical analysis. That’s the only think that works for me. I noticed that you also use technical indicators, charts and graphs in your approach and I’m interested to know what you think.
About demographics: have you heard about Henry Dent? He’s an expert in this field. If I would just use my common sense and nothing else all I can say is that there is no way the demographics will not work eventually. Here is a little funny story that I would like to share: some while ago Henry Dent was claiming that the baby boomers will soon stop traveling by airplane. That they have no desire to stay in airports and travel around the world like they used to. However, Dent said the boomers will reorient: they will starts going more and more on cruise trips. To make my story short: during a personal finance workshop I was sitting next to a typical baby boomer lady. At one point she started to talk about spending money in retirement. Being curious I ask her what is she spending her money on. Well, she said “we like to travel”. Really? I said no believing to my ears. What kind of traveling? Cruise trips of course, she answered. I almost fell of my chair!:-)
I’m glad to hear that you are neither upset nor angry. That means Robert is welcome to stay:-).
I have a question: do you think we are going to see something similar to 2011 when we had a significant correction in the markets? Can the solar cycles give warning signals about such events in advance?
One last question: In October 2008 were the solar cycles able to tell you to get out before it was too late? I’m curious.
Many thanks.
Robert,
Why do you think the demographics don’t work? What’s the problem with them?
P.S. I wish to have met someone like you when I started trading. I paid a high tuition fee to learn what I know today all by myself. Sometimes I can’t believe the stupid decisions and mistakes that I made. It’s like science fiction. I would never make those ones again. Trading should be really boring. Just as you said.
Thanks gabistv: I am not saying that it does not work but I think there is not enough data to support any evidence for either side really for the theory to be scientific so it is interesting to follow from an academic perspective (as a theory) but would be afraid to trade on it as it looks today.
From trading stocks and stuff I feel more that belief is more important. Many stocks rise without much volume as a few are buying higher. I do not think that there were that many people involved in the Tulip bubble. Don’t know but things like that make me a bit weary about those ideas. But really, I do not have clue – what I do know is that there is no statistical significance so I chose to ignore it and focus on parameters that I know have statistical significance to avoid alchemy as much as possible.
Trading is professional speculation i.e. professional gambling so you need to have a system (in my opinion) and a theory like the demographic theory we will never be able to test during our lifetime i.e. it may work a few times but there will not be enough observations to have it go through a falsification process.
That is more what I am trying to stir. The same goes for various market lores like inflation. They work sometimes, sometimes not and are used by economists and politicians to control the masses that believe without testing/falsification. Often there is not enough observation so a bit useless for trading. People start out in universities learning this and it took myself long time to unlearn all that as I just found it useless for trading.
But most investors and traders are afraid so they search for things to confirm their position when they are already into the position as logic and reason disappears when we have 1 USD at risk and our emotions start working instead. That’s why there are analysts etc that give various reasons for this and that.
The demographic theory becomes a bit like faith instead of a drug that cures people (most of the time) – which is not bad but faith has other purposes.
Even though trading is an art and a science I think it is in the trader’s best interest to try to keep it as falsifiable as possible and test and refute and attack his own logic. Especially when you are holding a position and did not enter with a strategy…
Politicians and Economists love to feed you theories that you can not test and then spin it and make people believe to control especially with induced fear.
Don’t forget that humans are pre programmed to believe. We want to believe, find patterns and fill in the blank.
Robert, stop writing to yourself. Lol
eric: LOL. Thanks.
Eric,
Robert is not writing to himself:-) He’s writing to me. I have been searching for someone like him for quite some time. Maybe this time the solar cycles are aligned in my favor. So please be kind and don’t bug him:-) Thanks.
Robert,
Thank you very much for sharing all this fascinating information. I would never trade on demographics. That would be just foolish. Have you ever read Karl Popper books? There is one called “The Logic of Scientific Discovery”. George Soros is a big fan of Karl Popper.
Hi, all of you, in special to gabistv and John
The reason I do not post frecuently in John´s blog is because, first, I do not understand about demographics and this is the way I perceive John is currently focused
Second, I notice that my Cycle´s studies are not welcome by John and I don´t want to disturb in his meritorious blog.
I´ve been saying for months, this cycle was altered and distorted by the FED.
The rhitms of a 17-year cycle from 1906 is very clear, and repeat similar pattern.
Us economy should be in a recession, the 3rd in the end of 2011, and particularly in 2nd half 2012, but easing policy is making new structure in the Dow Jones.
Without it, The Dow Jones never w surpased 13.000 points, as the pattern tells, but I´m afraid we are in a 1909-16-19 upward wedge pattern, or in the case of 1980-81 pattern but in the S&P pattern.
My first scenario is at least a 30% plunge in Us Indices to reach the monthly MM200, like 1981-82 s&p pattern, 11.000 Dow, 1200 s&p and the second, if the things become worst, to 8000 dow, retracement about 0,76 near to the prior bottom, like 1906-23 pattern.
In 1976-78-80 was 0,618.
Is the normal retracement, about 0,618 or 0,76, after the 9th year (50% plunge) from the 1st peak in a 17-year-cycle (huge sideways, up-down).
Till 9th year> 2 recession.
After, at least 1 or two.
The 1st distorted structure was in 2011, with a small retracement, 0,382 , 10.400/ 1074.
Next new hihgs, like 1916-19 pattern or s&p 1978-83.
Is possible to see new highs, to the upwards wedge of the Dow Jones, but likley not any more.
In my opinion, the top is on the way from may´13 and can make to the end of the year new highs or the begin´14, but not relevant.
I trade in med-long terms based on my cyles studies for a long time, Indices and commodities.
I feel my analysis are not in the way of John´s thus I prefered to be silent.
I have a count on Twitter: @apanalis
Dear Antonio,
Thanks for your input. I’ll follow you on Twitter. I have a question for you.
If the cycle has been manipulated, what do you think it will happen? Will the cycle will keep at 17 years in the future? Or will it change from now on?
Rafael
The 17 years cycle is intact, from 2000 through 2017, but from 2011, they have altered the normal rithm of it, 2-3 years up-down, 100% up, retracement +-, 0,618 fib, or 0,76.
In 2011 the retracement was only a tiny 0,382fib, after a 99% in Dow Jones, as the pattern plays, more likly S&P 1976-78 than Dow Jones.
A point here, is that since 2009 to 2012 teh structure was the same in Dow, I was trading with the Bovespa model was doing 1 year and a hlaf before very well, but in summer they defenitely altered it.
As I wrote, we have 2 options, now.
1- The path of S&P 1980-82 reaching the monthly MM200- first we don´t know if higher highs in upward wedge like 1909-16-19 ( 2000-2007-2013 Dow) and after touch the MM200, monthly, from now -30%, at least.
2- 1909-16-19 model (1906-23), a real plunge about 0,76, or more, DOW +- 8.000, near the bottom.
As explained I trade in med-long time frame periods, so I trade by levels, with ETfs, Indices and commodities, in EUR and USD.
Antonio Pérez Algás: Interesting thoughts.
I find chart patterns in the indices extremely untrustworthy for some reason. Many times they fail and bearish patterns become bullish like the HS in the S&P500 just when the markets started to rally after the last crash. What is good about them is that they provide good places to set your risk rewards – I sort of find the rest a bit random.
I think you all have a point with the cycle and probably bear market but on thing is dangerous about being stuck with a say 17 year cycle and that is that there are other planets affecting it and the perpetuation can create a cycle in a cycle – which means that the past could have been a 17 year cycle put the future will give another time frame cycle. Just an observation. Find it a bit hard to blame Bernanke on the cycle because if you are a pure cyclist then actually it is not Bernanke changing the markets but that we are entering cycle that is changing the rhythm of the cycles we have been in. Someone with better knowledge of Astrology may have a clue =). In the end Bernanke should just be a puppet of the cycle like the rest of us =).
Just some crazy thoughts that I am writing to myself =).
17 years-cycles are playing before 1900, it is not a fancy of mine,a commodities are playing 30 years cycles.
When I talk about the Fed I mean they have altered the cycle, the structure of the Dow Jones, but the main structure is similar.
I have to take some risk in my decisions, I trade in long time frame and cash is my friend.
I have open mind but always I ´m referring my cycles for the Dow and for the commodities.
I can be wrong, but I have in mind the big picture and i add short/ long positions in the way the cycle is expected to go up/down.
The next big movemente I expect is down, so isn´t mind the dow Jones touch 16.000 or even 17.000 if I expect a -30%.
If I am short since 13.000, in any case, if aI add by levels, short positions with some covered positions, finally can gain the position and money.
Is the only way to trade in medium-long terms.
In 2007, I was short in some assets since beg. ´07, you must ssume looses for a while.
In october´08 and nov´08 I was long in some indices and I add long positions in march´09 in spanish, Us Indices and commodities.
Nothing is perfect.
Patient, modesty and study are some clues.
This cycle, specially since las year is arrognatly and altered but I founded the new structure and i can adapt/ adjust to my model, is not so far from the 1909-16-19 pattern (upwards)
Good stuff.
Sounds like money management is the key to your success =).
Attention CRB Index breaking down support (Eur)
Hi Antonio,
Glad to see you back. Take a look at the Dow Jones Industrial (the monthly chart only) then draw the upper line and the lower line by connecting the lower lows and the higher highs. The result is a giant, massive expending triangle. Right now we are at the top of the line. This is nothing but a topping process. How long it will take for the markets to start crashing….I don’t know. All I need to know is this pattern that tells me we are at the end of a bullish cycle. Here is another interesting theory: the Eliot Waves. This theory claims that markets move in wave because of human psychology. To make things simple this is the essence of the Eliot Waves: five waves up and three waves down. The Dow Jones Industrial has a beautiful wave structure easy to count. We are now at the end of wave 5. So yes, I believe in cycles just like you but maybe in a bit different way.
YES, I updated my charts in Twitter @apanalis the wedge, in logarithimic from 2000-2007-13?, simiar to 1906-16-19, in theory we have made the bottom in 2009, but the retracement in these cases is about 0,6 0r 0,76 next to the bottom.
When I said altered is because the rising process is about 2-3 years and this happened until 2011, after 99%, the PATTERN again, but the drop was 20%, 0,382 the little one, after that the model was the same than Bovespa 1 year and a half later, but in summer Dow Jones handle with the Fed change definetly the structure, it was similar to S&P500 1978-81 and here we are.
At least -30% to touch the Monthly MM200, before we could reach higher highs?
And in worst case, a liitle crash like 06-23, retracement 0,76 or near to the bottom, please read the prior uuoer input.
When many traders believe there is room for the opposite to happen…
Potential flares hitting earth warning from NASA… geomagnetic storm may come. Sort of can feel it… It works checking with your girl friend if she wants chocolate more than general… Damn it is getting cold ;).
Squeeze setting up? Jan?
That´s interesnting, geomagnetic strom on the way.
Jonh, you know that?
a filament burst some days ago. Impact around Oct 2
My T-projection for top is in range Oct 7 (conservative) to Oct 14 (max).
In a bearish T that may be a shoulder.
Question is whether that bounce now has begun or not
SHLD has been squeezing like a pig today. Squeeze baby squeeze
Hi Antonio,
You from Lisbon?
kind regards
bob
I´m from St. Sebastian, North Spain, Vasq Country. The photo on Twitter is the bay, the most beatiful city in the world.
When I was teen I lived for a while in London and in Oxford.
Where are you from?
Kind regards
On Twitter: @apanalis
Hi John,
I know that you do not believe in a 17.6 year cycle as Antonio and I do but I thought that I’d bring this article to your attention as I’d value your opinion.
This Halloween market timing strategy is both objective and simple and it works. It goes back to 1897 and beats the Dow buy and hold return by 121 times since then:
http://intel.harriman-house.com/trading/halloween-indicator-timing-market-significantly-beats-time-market/
Regards,
Kerry
Kerry, I am perhaps being totally thick, but if one invests on October 31, 2013, then we are investing in what is portrayed in the circle as red zones(and bear) for the next few years.
Please enlighten – i find any work like this fascinating.
Thanks John for the work you do.
A good question FionaMargaret.
Although the later red segments are “bearish” with overall sideways performance, I say in the book that the 2013 low is historically a good place to start buying cheap stocks over the next 5 years before the next secular bull market starts. I expect volatility and overall sideways movement from 2013 – 2018 but I think it’s a good period in which to accumulate stocks before the next leg up.
Regards,
Kerry
Fannie Mae up 50% since entry. Fannie always gives cash… The cycle is powerless against Fannie. =)
Thank you Kerry for your reply – I purchased your book today, so shall find out all about your ideas!
I am glad to see you back Antonio.
Thanks John.
Be careful bears so that we do not break up upwards from that wedge – price can break either way when people wanna short… Initiated a short today in a shitty stock. October is a good month statistically. 60% chance for positive. Keep to the system. OTM puts is on my agenda as you may be right =).
Someone posted this in linkedin, a guy from Personal Capital:
Maybe a cue to be careful but think they need to get all those people in cash jumping into stocks and then it crashes =)
“We all have some cash in our bank accounts plus, hopefully, an emergency cash cushion of up to six months’ salary. But what about cash as an investment?
Especially since the 2008 financial crisis, many people have moved a substantial portion of their long-term investment portfolio into cash, for safety. At Personal Capital, where I study investment patterns, 31% of the investors who use our free wealth-management tools report that more than 10% of their portfolio is in cash — excluding the cash in their savings and checking accounts. Many affluent households have 20% or more of their portfolio in cash.
And more than one in four Americans say holding cash is the best way to invest money for the long haul, according to a recent survey by the website Bankrate.com.
Their logic is that holding cash in insured, liquid, short-term accounts will protect them against the type of knuckle-biting, double-digit percentage drops in the stock market that we saw in 2008 and 2009. Looking forward, some investors see cash as a way to protect themselves from risks in the bond market, where the prospect of rising rates could mean declining prices.
In fact, government-insured cash deposits are sometimes described as “risk-free” — free of default risk, free of interest-rate risk and free of price volatility.
It’s true that by avoiding the markets entirely, you can eliminate most volatility. But you still face two significant risks when keeping your long-term money in cash.
One big risk is loss of purchasing power. In the chart above, I’ve used 3-month Treasury bills as a proxy for cash. You can see that $100 invested in cash for the past twenty years would be worth $185 today. But that’s before inflation, which has consumed most of the “nominal” interest rate on cash, leaving the “real” interest rate — the increase in your true purchasing power — pretty close to zero. And don’t forget you’ll pay taxes – at higher ordinary income rates rather than lower capital gain rates – on the interest.
Another risk is opportunity cost. Virtually every asset class — stocks, bonds and alternatives — has historically provided superior returns to cash over the long haul. And thanks to the magic of compounding, a small difference in annual returns makes a huge difference in long-term value. During that same twenty-year period, after inflation, $100 invested in cash would have earned just $9. But $100 invested in stocks would have earned $205. And that’s including the big bear markets of 2001 and 2008.
Is cash “safe”? In the chart above I’ve flipped the typical comparison on its head. After adjusting for both inflation AND the opportunity cost of not owning stocks, it turns out that $100 of cash would have lost $200 over the twenty years. It’s just a different way of looking at things, but it helps to highlight that cash is not without risk.
So what can an individual investor do?
1. Reframe Your Idea of Risk. It’s easy to understand why investors gravitate toward cash investments: We all have a well-established aversion to risk. In experiments, people will pay more to avoid a loss than they will to make a gain — we fear losing a dollar far more than we desire winning a dollar. When we say that investing in cash is risk-free, we are thinking that it “can’t go down” — what a relief in a volatile marketplace. But if we turn that notion around and say that by investing in cash you can lose a very large portion of your long-term retirement savings, that feels very different. The challenge for risk-averse investors is to think about risk in a way that’s appropriate for the ultimate goal.
2. Identify Your Short- and Long-Term Goals. If your goal is short-term — purchasing a house, say — then a good proportion of cash and short-duration bonds makes sense. In this case, the protection from short-term market volatility can outweigh the risk of lower expected returns over a limited time period. However, if your investment is for a long-term goal such as retirement, the risk of market volatility is markedly diminished by the smoothing effect of averaging over many years. But the risk of lower returns (as offered by cash-like investments) is greatly increased by the impact of compounding over many years.
3. Create an Individual Strategy to Meet Your Goals. Over the long term, the key to reducing risks while still capturing higher returns is diversification — putting your eggs in many baskets. A global, multi-asset-class allocation spreads your money across many different markets and geographies. You’ll end up with the average upside from all the asset classes, but some will go up as others go down, thus dampening your portfolio’s volatility. It’s a free way to reduce risk in your investment portfolio.
They say you can’t be too rich or too thin. But you can have too much invested in cash.”
Finally that article I was waiting for… =)
Wedge pattern where prices are breaking upwards….
Swedish residential: http://www.valueguard.se/sverigebr
Been trying to divest but there is no way to rent unless I buy myself a trailer home which I have been contemplating but my girl friend did not acquiesce.
Robert, I was looking at Bulkowski’s http://www.thepatternsite.com. everything is back tested and % are given. For instance, the number one candle pattern is the bearish 3 line strike. It is a bullish reversal 84% of the time. So it is suppose to be a bearish continuation, testing based on hundreds of trades shows otherwise. Thought you would love that.
I think his work is very good but you need to keep collecting those data points and more importantly test it yourself so that YOU BELIEVE. The probability of success is not important but your expectancy. Most trend following models have a 30-40% success ration but your winners are larger than the losses.
I love what he wrote: 09/30/2013 I think the country will survive being shut down for a few days and that will teach congress not to mess with the debt limit. The world won’t end and the indices will move higher going into mid October. But what do I know?
The incredible response to this post has got me thinking about a Will Rogers saying, “some people learn from imitating others, others from books, but most of us learn from pissing on the electric fence”. I have been in this game for about 10 years and most of it has been pain – but I won’t give up. My view is that both Robert and you John are probably right. All human behaviour from the cellular level to the mind is about probabilities or patterns. Without these repetitions, from milliseconds to decades in time the body and human society would crumble. So short term reflexive behaviour causes us to add value to what is working already – to follow a trend. Trading this way should work. In the long term, again from experience, it can be seen that trends lead to reversals when they have been imitated too often leading us to contrarian investing. The devil is in timing because there are always too many variables in play. I require understanding before action. This gives me the confidence to make a move in the first place – balancing the fear and greed. What is likely to happen can be predicted to a degree short or long term but is no guarantee that it will actually happen. I do like Robert’s idea of publishing your success rate – that is if you don’t have an issue with it – my view is that Its all additional knowledge.
John,
I did not read the post including “Robert’s idea” that you publish your success rate but noticed it in John Burman’s post. I find the idea absolutely insulting.
You share an incredible amount of insight and knowledge and provide a forum where others do the same, including Mr. Burman above and Robert’s numerous posts.
Were you to charge a fee for access to your website then relevant disclosure of your personal investments would be appropriate. As a no charge website it is none of our (expletive) business.
geopark
I’ve done that. Published my success rate. Bad news!!
My win/ loss ratio swing trading is about 60:40.
But when I showed the world each trade and its outcome, I did some strange things. I backed off..I did not want to show all the losses, so i actually stopped trading all my signals. And if you dont take ALL the signals, you will lose.
bob
Thanks bob for your response to the “absolutely insulting” issue of success rate. Your honesty is refreshing. Mine has not been too good – I don’t have figures. I suppose it is a very sensitive thing which shows just how hit and miss this business can be so I will back off on that one. I am always fascinated by the idea that there are some who do very well in this field – as opposed to all the experts online who charge for their ideas and make you wonder if they were making so much money trading why would they need the fees.
Win/Loss ratio is not important. But your expected value. One of my trend models have a 30% win loss ration but still gives dough… Cut your losses and let your winners run.
A good quote from Colm O’Shea (famous macrotrader) – a guy that worked with George Soros said:
“George Soros has the least regret of anyone I ever met. Even though he will sometimes play up to his public image as a guru who knows what is going on, it is in no sense that he does as a money manager. He has NO emotional attachment to an idea. When a trade is wrong, he will cut it, move on, and do something else. I remember one time he had this huge FX position. He made something like USD 250 million on it in one day. He was quoted in the financial press talking about the position. It sounded like a major strategic view he had. Then the market went the other way, and the position just disappeared. It was gone. He didn’t like the price action, so he got out. He doesn’t let his structural views on how he believes the market will play out get in the way of his trading. That is what strikes me about rally good money manager – they don’t get attached to their ideas. The danger in the narrative I have been giving you is that it may lead to the false impression that you need to do makes lots of money is be really smart in economics and understand fundamentally what is going on. I don’t really believe that is true”.
a potential “crashy” setup in SPX coming days, maybe some days into next week
Watch DOW and BKX
SPX will try to bounce here around 50MA/55EMA… but it will fail and be a shoulder.
Or it will squeeze the other way. =)
This is the situation in my indicators and signals:
The ~6 month cycle had a low this summer, and the next is around November (Dec).
From the T-theory by Terry Laundry we had a T-projection (top) around Aug 10 (maximum), and SPX topped right there (a bit before which is common).
SPX got oversold and rallied again, triggering an new T-projection with date Oct 7 (conservative) to Oct 14 (maximum).
So some kind of top is expected in the coming week, before the next correction in SPX. And that one should make a low sometime where my 6month cycle says (some preferred intervals around Nov-Dec)
In this T we are seeing “sabotage” (weakness) in SPX, DOW and some others, while Russel, Tech and more still are strong.
So the strong indexes will probably top in the interval Oct 7-14, while SPX probably makes a shoulder.
The ending of the T will probably be confirmed by breaking below 55EMA (DOW is allready below).
My hourly data in DOW fits the pattern of an ABC-correction, and signals that we are in bounce-B, expected to top around coming Tuesday.
By this T-theory, combined with the 6 month cycle, I can see one possible bullish scenario (short term), and that would be a completion of the ABC-correction suggested by DOW around Oct 15-18, and a new rally/squeeze. And that happens to be around the debt-limit date.
Such a new rally will trigger another T-projection with top around Nov 20, which is another very short T, and will have bearish consequences. So short term a bigger squeeze/rally, but longer term it means the big topping-formation is just maturing.
So market should start to weaken from a top/shoulder in the coming week, and fall down towards the debt-limit. There we may break down further, signalling a deeper correction. Or squeeze up, signalling a bigger topping formation stretching to Nov ~20
My favorable scenario is a deeper correction some percent below 200MA in SPX, making a low in November. Then a new rally with the 6 month cycle and Xmas, making some kind of a double top in January, and then the solar maximum bear market begins
JAn 🙂
Great analysis; thanks
this week started a bit weaker than expected.
But US hasnt broken down deeper, so the T is still alive giving us support maybe a couple more days, to finish the bounce-B in SPX/DOW… but if we break down lower… there is perhaps no more bounce, and the T is dead.
Here is a great resource for the T-projection work by Terry Laundry
http://stock-market-observations.com/category/terrys-t-theory/index/
I have found this to be probably the best tool for projecting medium term tops in SPX
HS forming in GLD… and in a downtrend.
Thinking about shorting GLD
Thank you all for the comments and input. Some interesting discussion.