
Last week, stock indices largely printed bearish shooting star candles (on a weekly view, up into and on FOMC output then reversal of gains Thu and Fri), which also looks like a potential lunar inversion, and a potential important Equinox reversal too. The Equinox was 22 September to be precise, and Gann found this date/event often marked major tops in history (on or very close). Chris Kimble has also produced this (hat tip Gary) below, and notes last week produced an all-time record for inflows into equity funds worldwide:

Source: Chris Kimble
As various stock indices were at important breakout levels, and ended Friday retesting those levels (having jumped above then fallen around the FOMC), then a breakdown in the first part of this week would make things look more bearish, because we would have a shooting star fake-out and more of a trend supporting lunar / equinox reversal.
Chris Puplava pointed out overbought signals as other reasons for a pullback (although he still sees no threat to the ongoing bull market). I have added vertical lines to his summary picture to view more clearly what happened to the SP500 on previous occurences, namely sharp uptrends gave way to more sideways ranges:
 Underlying Source: Chris Puplava
Leading indicators remain overall positive. For example, US CB and ECRI leading indicators were both good readings last week. This is supportive for stocks. On the flip side, we have seen some breadth divergences, which would be one topping process sign, and we know margin debt is at lofty levels.
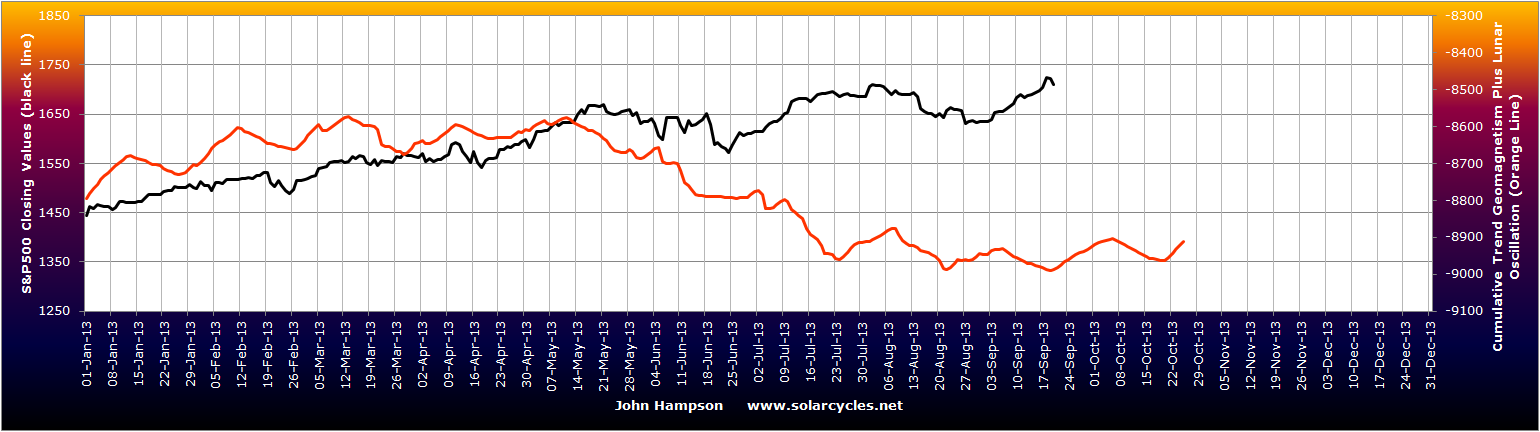
Here is the latest geomagnetism forecast (with lunar oscillation). Overall flattish, but with a slight upward bias. I noted previously that the lunar positive fortnight from today plus the relatively benign geomagnetism could make me long-biased. However, if we have seen a lunar inversion then we could see down rather than up this week, which would negate that edge.
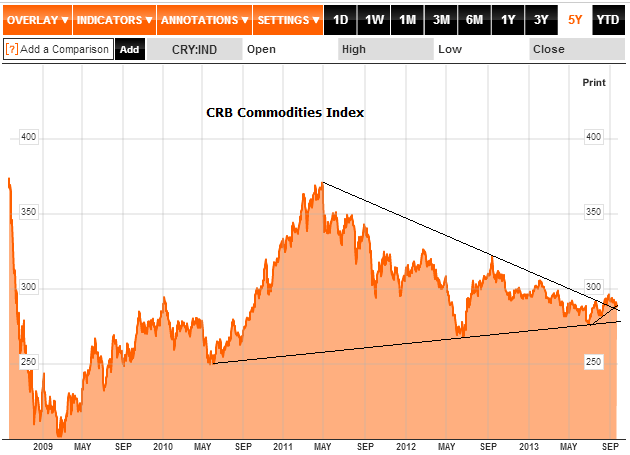
 Let me bring in commodities. When stocks retreated in July/August we saw commodities gain interest, which was also a potential sign of a topping process in stocks, as historically we have seen commodities rally last as (and after) stocks top out. Since then we have seen money flow back the other way. This is how we stand on the CCI and CRB commodity indices:

 Underlying Source: Bloomberg
Hopefully it is evident from the two charts combined that commodities have the potential to break into a bull rally here. However, it is just potential, and time is of the essence. If the CRB is to break upwards then it has to make the current backtest of the breakout stick, and pull upwards from here.
Here is the US dollar index. See how it has arched over and is now threatening breakdown. A bearish break would benefit commodities and provide one ingredient for that potential rally.
 Underlying Source: INO
Also, here is a chart from Chris Carolan showing how the Euro has the potential to escalate against the USD based on relative central bank money printing:
http://spiralcalendar.com/wp-content/uploads/2013/09/092213eurbal.gif
As the Euro is the biggest component of the US Dollar index, that then is a possible breakdown catalyst.
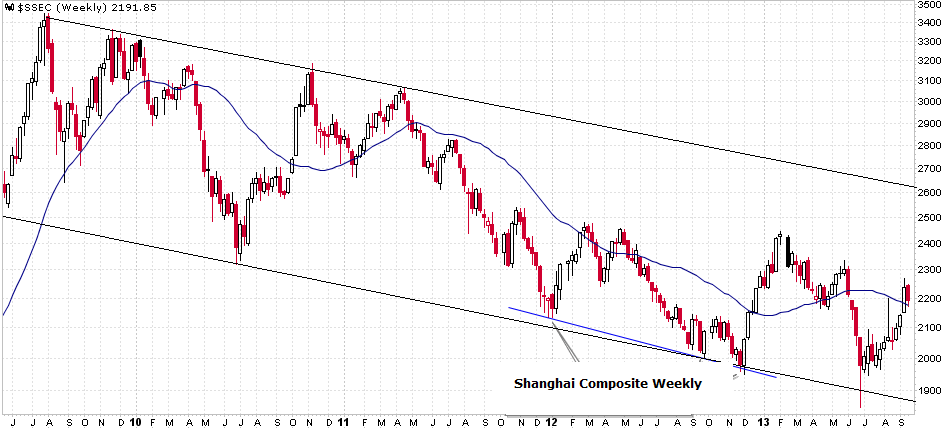
Another factor for commodities is China, as their biggest consumer. Today’s Markit manufacturing PMI came in at 51.2, a 6-month high for China. The stock market has also picked up the last two months and has the potential to run up to the top of this channel:
 Underlying Source: Cobra / Stockcharts
The most bearish assets (in terms of public opinion) of the current period are corn, wheat, oats, soybean oil and coffee – all agricultural commodities. The volatiility index for stocks (Vix), and treasury bonds, are down with them at bearish extremes. So, if we are to see a mean reversion – which is likely, but the timing is the difficult part – then it would be into commodities and out of stocks (Vix rises).
Lastly on commodities, my solar maximum correlations remain potentially in play, if the smoothed solar maximum is ahead of us. Sunspots are back up to the 100-mark currently so the sun is showing some life again, and certain analysts predict another sunspot peak ahead around the turn of the year. I have established that experts typically agree on the solar maximum once the solar magnetic flip is complete on both poles. The sun’s north pole switched polarity in May 2012, but the south pole flip is still ahead and likely within the next few months. So we should know for sure by Q1 2014. Either an end of year sunspots rally will produce a new smoothed maximum for SC24, before the final polar flip, or the pole will flip and Feb 2012 will be cemented as the solar max. By my research, a commodities rally over the next 6 months to a new index peak would fit with the former, not the latter.
In summary, the research for this post has produced a bias against stocks and pro commodities. As you know I am long commodities so disclaimer as always. However, I was also net long equities and have taken some profits on the long side. If stocks rally to new highs this week, and on good breadth, then much of the bearish case would be negated. If commodities sag further into the end of September, the rally potential in the commodity indices would fade.

the $ chart looks exactly like the S+P…one of them is wrong regarding likely future direction…
Great post, John. I knew spring and fall were impt but not aware of what the chart shows. Again, the 60 year cycle per Flannagan of GannGlobal, Oct 9th is the final low prior to the final high next year, Apr 2014 for commodities. I’m guessing a fake out break down below the triangle and then the rally. Flannagan has been pounding the table on a big move coming.
The credit cycle: when the central banks are flooding a weak economy with liquidity. Except for possibly the early 1930’s, it has always trumped (inverted if necessary) cycles, sunspots, etc. The charts you show are incredibly bearish for stocks. Can something finally defeat the FED. Because monetary conditions are bullish. After the big bust in Japan, 1990, there were downturns just when credit conditions were still bullish but not improving. Interesting times!
China. Chanos had amazing facts about China. Debt is already at 200% of GDP and they are growing it at 25% per year to keep their now 7% growth rate. That will more than double debt in 3 years. The things they are investing in are 50 international airports; they need five, and of course condos which are already incredibly over built. Rows of empty unaffordable ones rampant.
A few questions:
Probability i.e. significance of the following:
– bearish shooting star candles ? Have you tested it? As far as I am aware of there is no significance of this pattern but if you have the data let me know.
– “The Equinox was 22 September to be precise, and Gann found this date/event often marked major tops in history (on or very close).” Have you tested it yourself? Do you have the data and significance. Pls share it. Would appreciate it.
– Inflows from my own testing do not have much significance statistically but if you have the data pls share, I might be mistaken.
Thinking of going long Alcoa and JCP both have good patterns that have statistical significance. Any ideas on alum prices.
– https://www.tradingview.com/x/Mh0Xv9GJ/
– https://www.tradingview.com/x/PUZU16YN/
Robert, I have not tested it but based on my experience and passion through
50 years of market watching and studying; I dare say you sir are correct. May work sometimes; but not consistently. A friend of mine lost a lot of money studying and trading candlesticks. Anecdotal but still….
Buying BBRY again. That bid is just too low but like the capped downside… =)
No sorry. I am wrong. Blackberry is a pump and dump: http://stocktwits.com/TimZ/message/15974948
Again a good example of why funny-mentals are bad. BBRY is the anti-thesis of fundamental investing and buy and hold investing. Just embrace the trend. Is the asset making higher highs??? The buyers know it is worth 40 but they are only paying 9 =). That is the stock market. Chop wood. Carry wood. Place order.