
Let’s distinguish between prospects for a stock market correction and prospects for a bear market, and start with the former.
There are multiple signals for an imminent stock market correction, such as sentiment and euphoria readings, put/call ratio, skew, distance from 200MA, divergence in stocks above MA. I’ve covered these, and more, in detail in recent posts. The history of each individual flag gives us a guide as to the timing and nature of a correction, but it’s just a guide. The risk, and the bull case, is that things go crazier yet: steeper parabolic under the excitement influence of the solar maximum. We see no decisive break in the markets yet and certain measures of breadth and sector participation are still supportive. Barring an external shock it can take time for perceptions to shift. If we try to anticipate buyer exhaustion, then current leverage, sentiment and investor credit are suggestive of ‘all in’, but we could still eek a little more out of each and propel higher yet.
My ‘balanced’ view. Multiple flags, with different angles on the market and with broadly reliable histories, are pointing to an imminent correction. Some of these indicators are at all-time record extremes, and the aggregation of both the warnings and the levels is a trader’s opportunity. Mean reversion always occurs, so a correction will come, but that could be ‘eventually’. If I were to play the long side, I would look for bullish momentum to resume, and play with stops for short term profits, knowing that under such one-way sentiment, high leverage, and technical levitation, the market is particularly vulnerable to a sudden fall or a lasting decline. If we take a purely statistical approach to the markets (you can find that in THIS post), and remove any big picture bias, then the risk-reward is on the short side, until we have seen a correction that relieves the current extremes. The data gives high confidence that short positions here will produce positive returns, if any drawdown en-route can be tolerated. If there is little leeway for drawdown long or short, then the prudent approach would be to sit aside whilst both prospects of steepening parabolic and steep drop or crash are in currently in play.
Now to the bigger picture, and the potential for a bear market.
Looking statistically again, valuations such as market cap to GDP and CAPE, corporate profit margins to GDP, levels of margin debt and investor credit, and bull market trend/gain history: they are all at top percentile readings that have historically ushered in bear markets. The bull case relies on ‘this time is different’, namely: valuations need adjusting as bond yields and cash are suppressed, margin debt can go some way higher yet due to low rate of borrowing or there will be an orderly transfer from leveraged buyers to new buyers, and the Fed is underpinning the stock market and trumping normal factors. It has always been dangerous to side with ‘new norms’ because mean reversion, until now, has always occurred.
The current extremes seen in sentiment and euphoria typically occur towards bull market peaks, but can on occasion be generated in young bull momentum. The case for a young bull is that certain stock indices, e.g. SP500, decisively broke above 2007 highs in a mirror of historic secular bear termination breakouts, and the economy is now finally picking up. Regarding the former, the break-out case doesn’t apply to other major global indices such as FTSE, Euro Stocks, Nikkei and Hang Seng, and regarding the latter, the pick up in the economy is tentative and may prove to be fleeting. Much of the data coming out currently is backward looking to October/November. Broad and narrow money measures suggest the pick up may be tipping over again. But, for now, data is generally positive and we could argue for the possiblity of positive feedback looping. Nonetheless, it is still a stretch to make a case for young equities bull momentum when valuations, leverage and bull market history collectively indicate we are at historic secular/cyclical topping levels. It would be unprecedented to see either a rapid catch up in the underlying (GDP, earnings, revenues) or significant collective further extension of valuations, leverage, and bull market trend/gain. Rather, the evidence suggests current euphoria and sentiment extremes are more typically those of a bull market ripe for termination.
So let’s now look at the macro picture and assess what kind of bear market we could be in for, because there are again two options.
The first option would be a bear market that is a pause in a new secular stocks bull, sufficient to remove the froth that has built up in sentiment, valuations and leverage. On the SP500, this could be a retrace to the 2000/2007 resistance breakout, which from current levels would be 20% down. A successful backtest and a new cyclical bull thereafter. The option second would be a deeper, longer bear market, which would be classed as continuation of a secular bear market from 2000. A case for the first option could be built on exponential technological evolution and collective central bank support (commitment to enduring low rates and stimulus as appropriate). A case for the second option could be built on demographics and debt. We then need to look for evidence as to in which camp the balance of power lies.
The economic recovery since the 2008 crisis has been historically weak in various areas, such as consumption, income, retail sales, job growth, productivity and private investment, and thus we still have ZIRP and QE 5 years on. I believe there are two reasons for this: demographics and debt. I have covered demographics in detail on this site – please do a site search if you are a new reader – and I can summarise that we see collective trends that suggest growth and consumption will remain weak for some years ahead. The bull case relies on growth and earnings picking up this year onwards to historically normal levels but this will be very difficult to achieve against the demographic backdrop. Over the longer term, a combination of pro-active immigration policies, greater global economic influence in positive-demographic countries such as India and Brazil, technological and societal shifts could potentially help alleviate the pressures, but we are looking at sustaining a secular bull market right now.
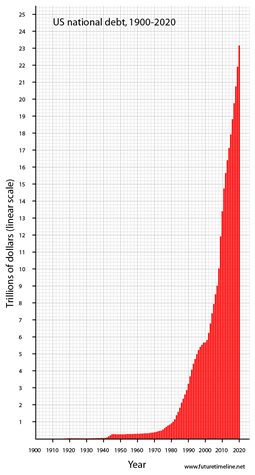
Turning to the debt issue, much of the world is suffering from all-time record debt: household, corporate and public. The problem with high and growing debt is that more and more has to be spent on servicing the debt, crowding out investment, and restricting other spending. High debt has historically correlated with low growth and low productivity. Money invested in government bonds is not invested in productive capital. Below we see the growth in US debt:
Next we see US public debt as a percentage of GDP. To add to the wars labelled, the Vietnam war of the 60s-70s was also highly costly.
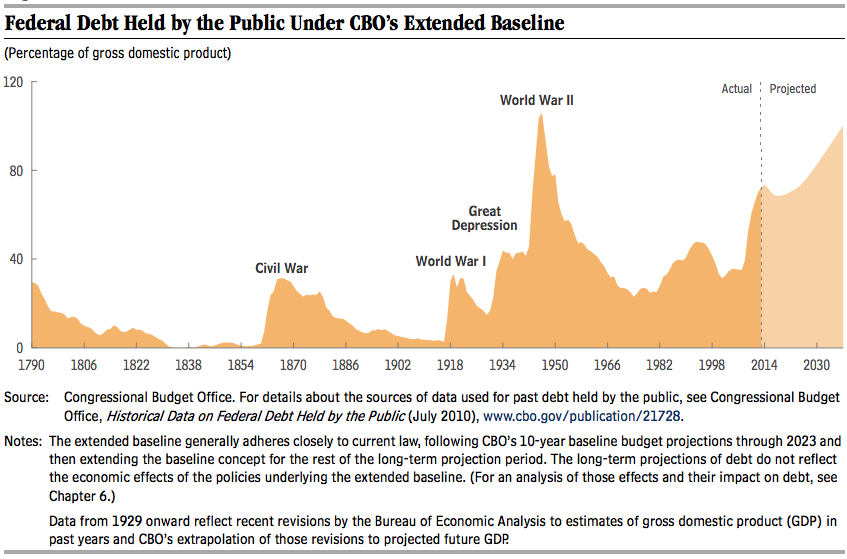
It is the combined costs of the wars that have led to the current predicament. War provides no economic benefit. There is a short term boost as certain industries boom and jobs are created, but ultimately it is highly costly, paid for in part by increasing taxation and by cutting other government spending, but mainly by increasing government borrowing. The build up of the debt led to the cutting of the gold standard, and since then debt has been on a one-way path. Compound debt can run away, unless revenues (GDP) can grow at a faster rate, or inflation is sufficiently high to shrink the debt, or, as a last resort, monetisation is undertaken (money printing to buy the debt). As growth has shrunk under the debt-overhang and both inflation and growth have been crimped by demographics, even more borrowing has been taken on to try to offset these factors, exacerbating the problem. Hence we are at that last resort of monetisation and no way back.
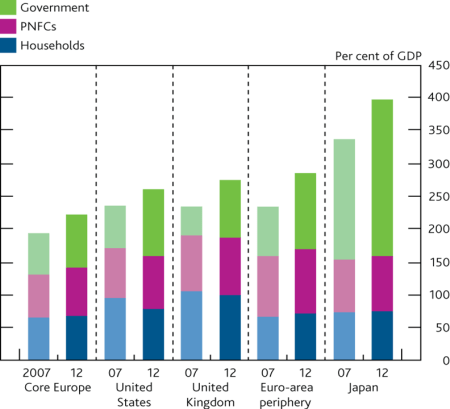
Here is the combined debt picture for US, UK, Eurozone and Japan:
 China’s debt is ballooning too. All these countries are in demographic downtrends, and all are compromised by ballooning debt. This sets the scene for a particularly nasty global negative feedback looping (US demographics topped out around 2000, Europe around 2005 and China around 2010, therefore the collective pressure is now at its greatest). It is asking a lot of technology to deliver a range of paradigm shifts in the near future to somehow turn this around, particularly when corporate investment has been neglected. Meanwhile, conditions of zero rates and QE have failed to convince consumers and corporates to spend, borrow and invest, other than in asset bubbles. Thus it seems likely that debt and demographics will and are overwhelming policy and technological evolution, and the secular bear market will ultimately continue. However, I would of course accept that this position is to some degree theoretical whilst equities remain in a bull market and whilst economic reports are largely respectable.
The proof, of course, will come piece by piece in the economic data. Should equities hold up a while longer and central banks / governments get their balancing acts right, particularly China, then maybe a period of positive feedback looping can develop and extend. If a stocks bear erupts, as indicators alone suggest, then realistically this would sink the fragile economy as that wealth evaporates. A deflationary shock is also a possibility, as such events have occurred in the past when countries flirted with very low inflation.
Understand that I have not changed stance from my previous posts, but rather I’ve tried to keep it balanced in this post and see the bull case, as it’s important to challenge yourself. So yes, equities could potentially move higher in the near term. The onus is on the bears to take this down and until they do in a meaningful way then we are in a strong bull market. However, the weight of evidence for either an imminent correction or bear market is compelling. And yes, at the global macro level, things are currently reasonably benign and economic data generally not too troublesome, so my expectations regarding demographics and debt could potentially be proven to be less potent than I predict. However, again, it’s about the weighing up the evidence and I believe I side with the probability. I’m short, either for a correction or a bear, and will increase shorts on market clues.

Thanks
some reading/charts here too.
UK seems to be heading in to a Bull-marked.
https://dub124.mail.live.com/default.aspx?id=64855#n=1571057771&fid=1&mid=ab847186-79ca-11e3-9050-00215ad73efa&fv=1
Thanks Niels. Can’t access your 2nd link.
Try this.
http://www.marketoracle.co.uk/Article43771.html
Niels, thanks for this. It is not clear to me how it would be realistic to expect house price rises of up to 80% over the next 6 years after reading the article. Affordability is already off the charts (in a bad way), what will drive the price up on the demand side when wages are looking poorly (have been lagging “real” inflation for 6 years already), company investment is at an all time low and unemployment levels are not exactly low (in real terms). The job market in London certainly has a lot more people chasing fewer positions in a lot of industries (including financial/commodities where I am) and has done for a while which is not good news for salaries. 13.3% increase in population over 20 years (and mainly immigrants on low salaries?) wouldn’t (in my non-expert view in this field) seem to be fuel for demand either…..I must admit that I don’t know much about the supply side though….I should point out that I am neutral in terms of UK property – I have no “position” as it were.
Presumably, if the 80% rise in house prices over the next 6 years is realistically going to happen then interest rates are going to be staying near zero for the entire term?
John, have been a long-time reader of your blog – thank you for all your hard work. I must admit that I do not understand the points made around solar activity in any detail, but I have howled at the full moon when inebriated on occasion so presume gravity/magnetic fields are at play…?;)
Good luck all
J
Thanks jegersmart
One of my great regrets in the past years was getting tossed from a forum where I was an invited poster because I carelessly posted what I thought based on my tools instead of getting in synch with what the bigger picture view of the host was.John’s post today , with its thoughtful alternatives, allows me to say what I think.IF price breaks out to new high,I have an upside of 1956spx,,, really not that much higher… in about 2.5-3 months….so I REALLY LIKE the work that points to a top in about 3 months that John posted…then followed by the alternative 20% pullback before a new high is made.Since the first of the year every trade i have taken except one in the indexes has been a short;but. each time price. instead of pushing lower, has simply gone to the day trade target and stopped…this is characteristic of market action before a larger move….
Thanks slater
Thank you Jon, for all your excellent work. As a small-time investor, and an astronomy buff, I find your perspective fascinating. Have pulled back all my investments as much “to the side” as possible, but it’s hard waiting for this correction. Your articles help me to feel I’m doing the right thing. Can’t afford a big loss. Thanks again!
Thanks Khiori
Hi
Some oddball projections that might or might not pan out.
”Sherman McClellan and his mathematician wife Marian developed the McClellan Oscillator and Summation Index in 1969” as most know ofcourse.
He’s made a business from looking for ”curvfits” all those years.
Sometimes (perhaps rarely) they pan out.
There used to be years worth of his ”free charts in focus” at their site, now only a few.
One of the latest ”curvfits” his son Tom’s been coming back to is this. Worth a read atleast.
http://www.mcoscillator.com/learning_center/weekly_chart/a_review_of_analogs/
Some years ago they also noticed the curvfit between the DOW and
The largest four traders gross long share of open interest (futures and options 3 months EuroDollars) in the COT-report data. Move that data forward one year.
McClellan had no explanation or reason for such a futuristic curvefit, but personally I actually made some money from it.
Check the red gross long bottom left graph and move forward one year.
http://www.cftc.gov/OCE/WEB/eurodollars.htm
So there you have it, Johns detailed forensics reports, plus two oddball charts showing a possible sharp decline starting just about any day now.
Happy trading, all!
sigge
Thanks sigge
Excellent posting John.
Thanks wxguru
All,
Outstanding post John… impressive balance in your presentation while remaining true to your BIG PICTURE. All the indicators in the world to the contrary cannot displace the massive debt accompanied by the demographics you’ve spied.
http://finviz.com/quote.ashx?t=ICPT Meanwhile the hyperbolic story continues to unfold… how much more? How much longer? And then what? None of us really knows but it is alluring to be pulled into the attempt to decipher it all.
My own conjecture is that the lack of amplitude on SC24 may suggest more measured mania to the upside in this cycle and thus more support when it comes down. Barring a collapse brought about by an echo financial crisis perhaps in April, or some other exogenous surprise (saber rattling), a sufficient ‘correction’ can reset the Bull clock as it were. So it is perplexing given the debt and demographics that we should even consider ‘growing’ our way out of the dire scenario.
Challenging yourself forces me to do the same and your organization of the points above and it’s sister post is quite helpful. Looking at the sector charts is intriguing given the discussion of where the solar max is or isn’t… Consumer Discretionary looks like a moonshot on both an absolute and relative basis… Healthcare hyperbolic on an absolute basis, not quite on a relative basis… (sorry no charts, not even sure if the FinViz chart for ICPT will come through but maybe one of you other techno people can throw them up here). So watching these and
other sectors response will be key over coming weeks.
Thanks so much John… well done…
Thanks HVA