

I could have put a question mark at the end of the title but figured that’s a bit wet. I have a case, so here it is. Now let the market shame me, preferably as early as you are reading this.
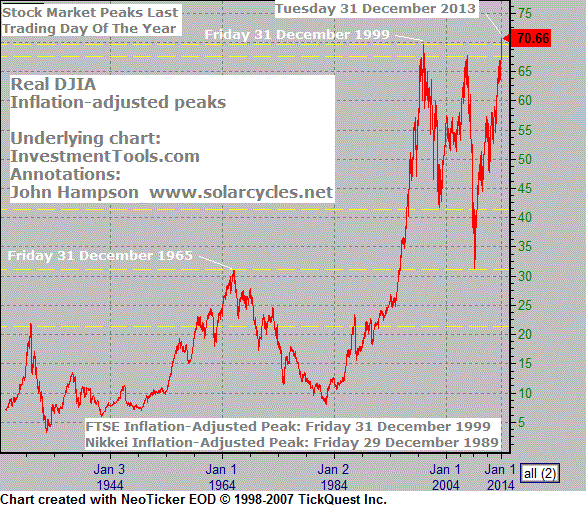
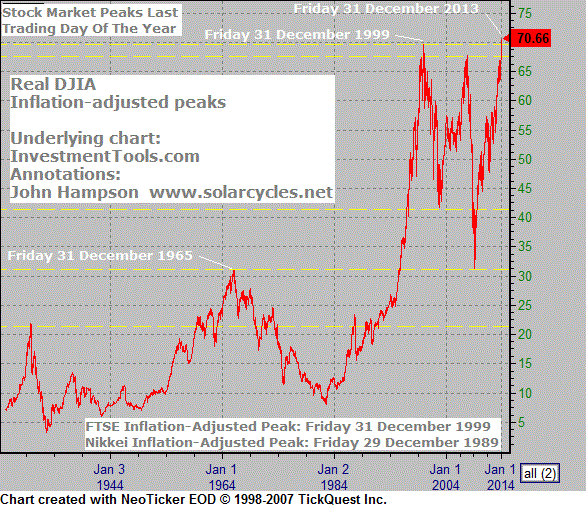
1. Last-trading-day-of-the-year applies to the major real peaks on the Dow, FTSE and Nikkei.
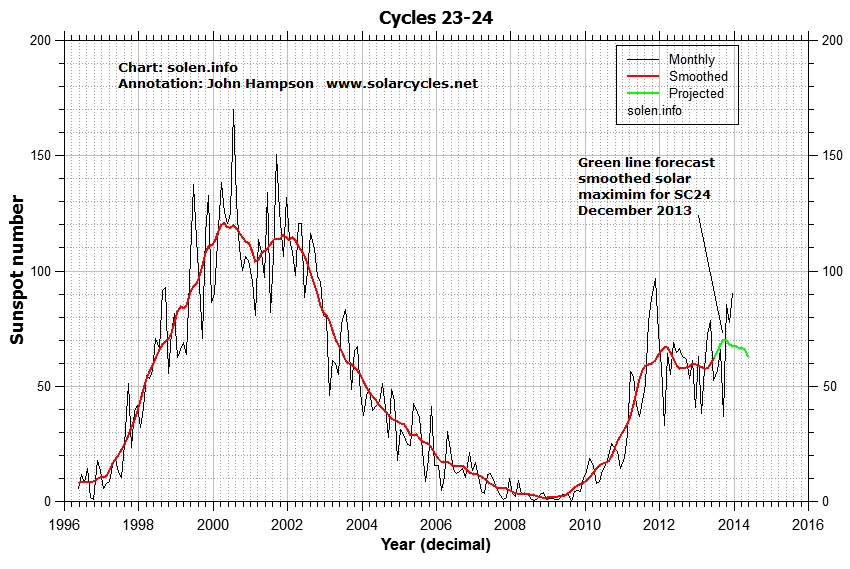
 2. Solar maximum alignment (sunspot maxima – human excitement peaks – speculative parabolic peaks): based on Solen’s forecast this is likely to have been December 2013, with associated monthly spike in sunspots (implications on second chart beneath):
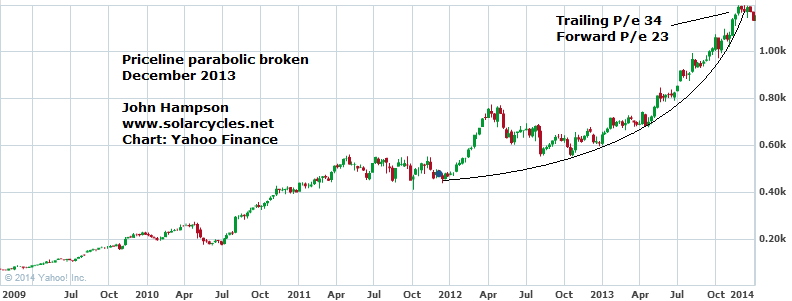
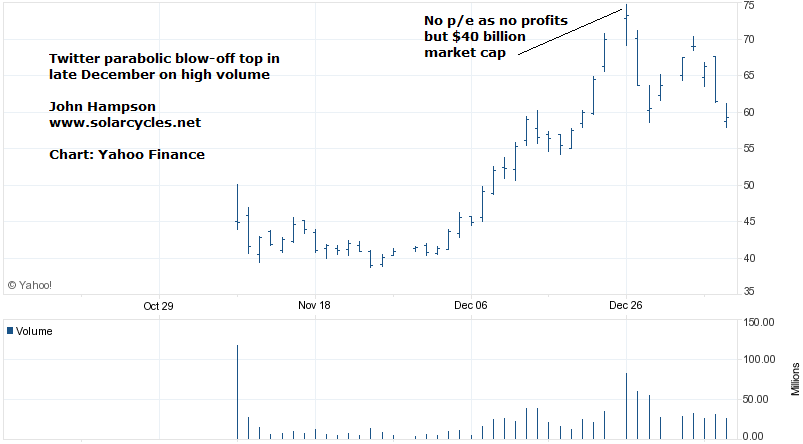
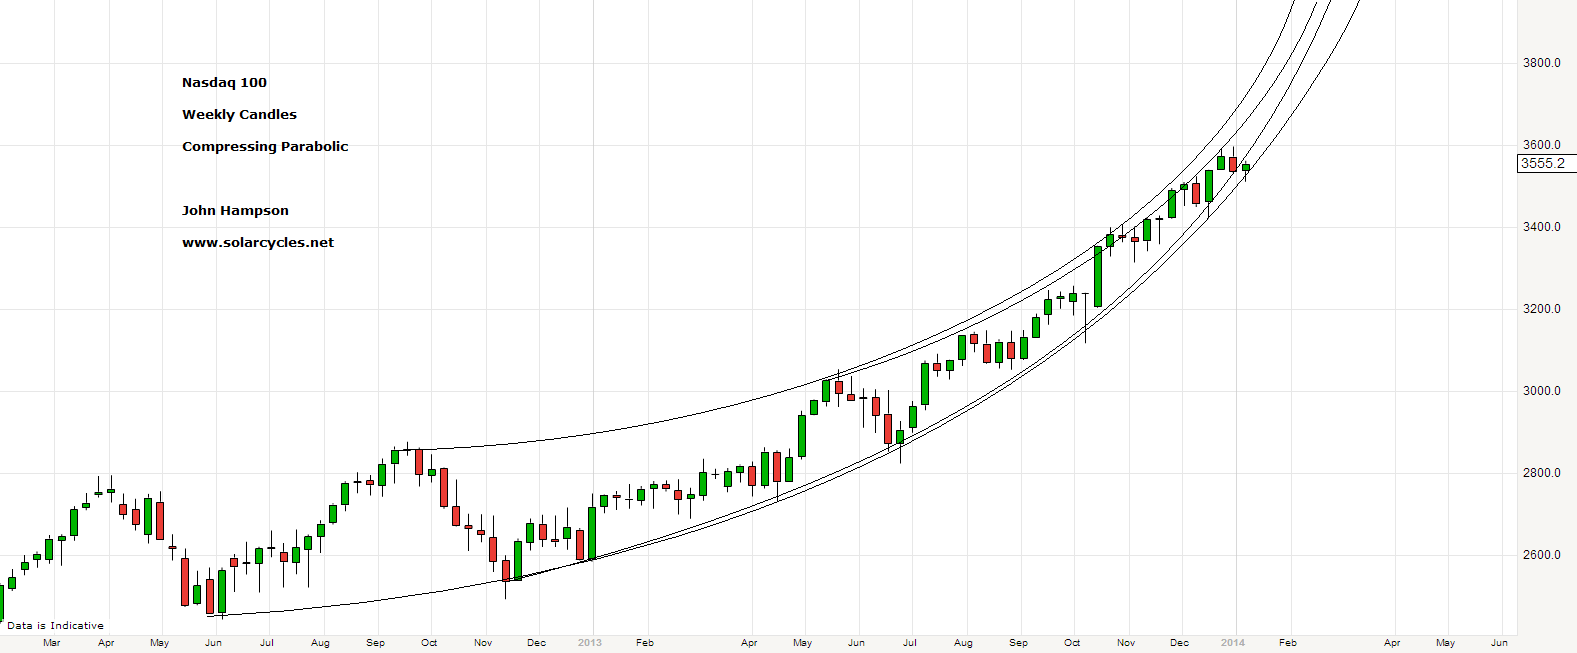
 3. The embodiment-stocks of this earnings-less, multiple-expansion bull market parabolic finale, potentially peaked out in December or are blowing-off now:


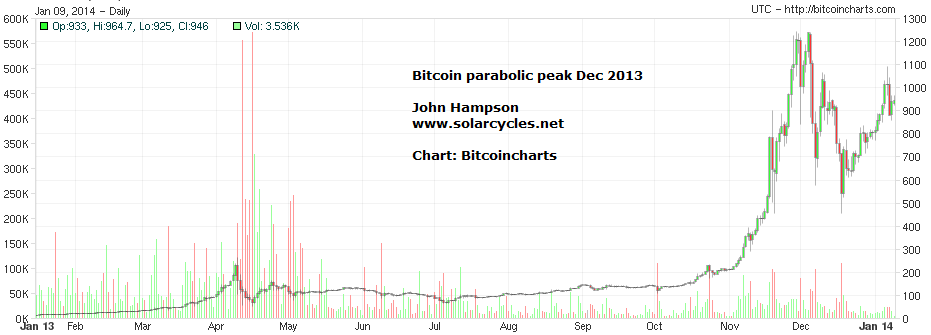
 4. Solar maximum speculative parabolic peak also in evidence in Bitcoin, which potentially topped out in December:
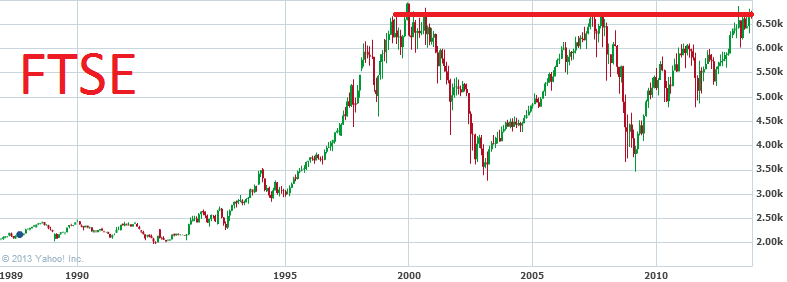
 5. Dow, FTSE, Nikkei all collectively at long term major resistance:


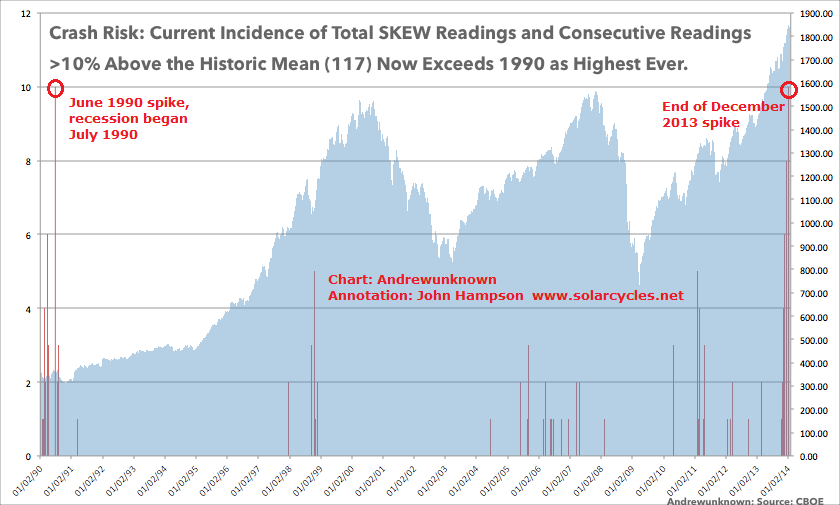
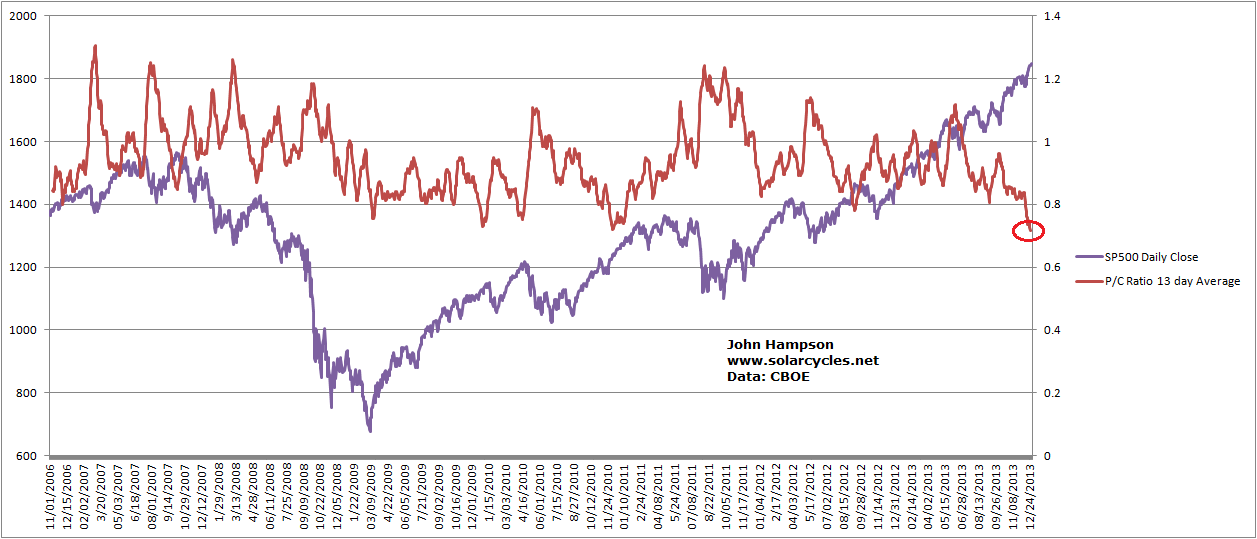
 6. Collective warnings in sentiment, valuations, topping patterns, leverage and more congregated in late 2013:
 7. Some additions/updates:


What’s missing in terms of topping signals? We have some breadth divergence (e.g. stocks above 200MA) but not sufficient for a typical top (e.g. cumulative advance-declines, congregation of stocks making New Lows). We do not see cyclicals flagging whilst defensives take over in a meaningful way, as is typical of tops. The 31 Dec high was a momentum high and normally we would see at least a second attempt at the high on divergence.
If the market hasn’t topped yet, then the table of flags and warnings suggests a peak within 3 months is likely, as do the parabolics on the US indices:


Probably one of the most important calls you’ve ever made on this site, John, in the +2yrs I’ve been checking up on the site. Bear markets of 20% or more typically signal a major loss of confidence, that tends to trigger a recession outright. If the US stock market fell +20%, what would you expect would happen to GDP?
Also, they say that if the US sneezes, the whole world catches a cold. If the BRICS are already decelerating, a US slowdown/recession could cause the BRICS economies to contract, surely? Europe’s current fragile recovery from the double dip would almost certainly nosedive into a dreaded triple-dip.
Not so sure commodities would see a repeat of 2007-08 though, any further contractionary economic fundamentals would more likely trigger deflation, and falling commodity demand. Most developed economies have a large output gap at the moment, there is an abundance of spare capacity. In 2007-08, some had an output surplus, such as Spain, Greece, the UK and Ireland. The crisis of ’08 has left those countries’ economies below potenial GDP. I think deflation will be the buzzword, if markets deteriorate, going forwards.
Agree, I side at this point with deflation and commodities not rising as late cyclicals, though I’d like to see that confirmed once equities start a meaningful downtrend. Think we need to separate precious metals from commodities from here on.
THANK YOU for the work..All a trader can ask of another trader is to say exactly what they think.
Appreciated
Try doing your analysis with log prices…
Top or a break out =)
Robert I wish you well with your momentum trading. I don’t think this site can offer you anything any more because you choose to deny every valid indicator and discipline. I welcome open debate and reasoned disagreement, but your repetitive one line dismissals aren’t either. Best wishes elsewhere.
From George Magnus of UBS, who also wrote the book “The Age of Aging”, a tome on demographics and markets.
“http://www.prospectmagazine.co.uk/prospector/are-we-heading-for-an-interest-rate-ambush/#.Us62tPv4I2r
Thanks Gary
http://www.bloomberg.com/news/2014-01-09/yellen-eyes-turnover-as-u-s-workers-leave-jobs-ecopulse.html
The quit rate – Good one to gauge especially if feds are doing it. I bet this matches the business cycle and the solar cycle if the data were available?
Bradley turn date tomorrow from Jan 1 to Jan 10, big CME from the Sun hitting earth, likely to have a behavioral impact on us – is more to come? If so, does general mood for stock’s continue their upward trajectory?
Thanks, I could only find a quits chart going back to 2003
good info thanks
A good read as always John. Thanks.
German DAX30 top and reversal leg down occurred at same time. Potentially playing out: http://www.zerohedge.com/sites/default/files/images/user3303/imageroot/2013/03/nicebubblechart.gif
Jon,
That squares with my recent chart of TJX. I believe that TJX is in the final mania stage of appreciation.
http://stocktwits.com/message/18806757
Thanks guys
Hi John, the analysis looks good and I hope that is what transpires now. The only problem I see is markets can be irrational until we throw in the towel and then do exactly what we were thinking, later. We need more confirmation from market action in real time that it indeed topped here. Until then it is just waiting game, because nobody wants to go long here for sure.
Thanks. Yes it’s about trying to gauge how long and how far ‘irrational’ extends.
Oh ok. This is after you have factored in irrational also. And trying to time when it has topped. Good call. Today’s action is supporting it.
“nobody wants to go long here for sure”
As an afterthought, may be this is why it will keep going up!!!
Yes it did…almost exactly 720 (2 X 360–Gann) weeks from the March
2000 high
Scotty
Thanks
Good call, John (no guts no glory). Your last several missives certainly convinced me the end is nigh. The exact date of course is difficult as tops can wear bears out lasting months.
Thanks, yes have to be patient