
In the original post (HERE) I showed that major market peaks typically occur:
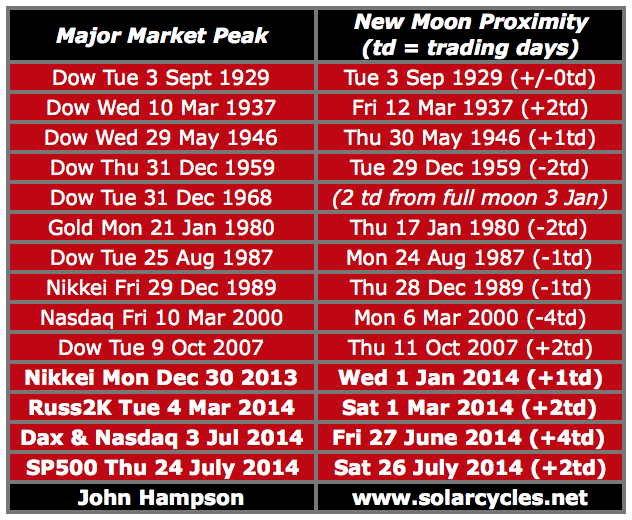
1. Within the month – at new moons (optimism peaks)
2. Within the year – at inverted geomagnetism seasonality peaks (optimism peaks)
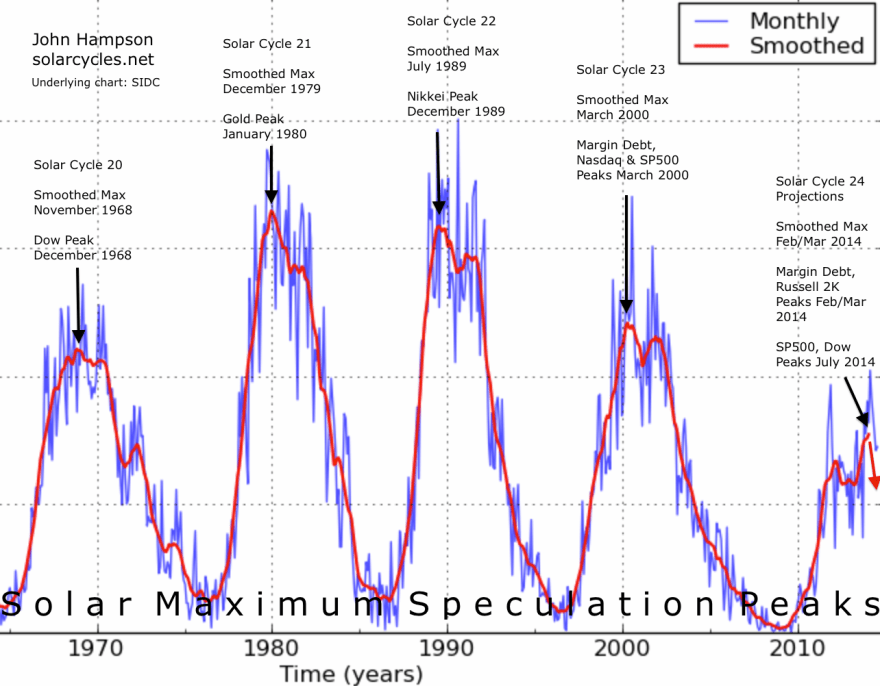
3. Within the decade – at the solar cycle maximum (speculation peaks)
Demographic trends determine which asset is the speculative target and whether the peak at the solar maximum is cyclical or secular.
My case is that stock indices have now all peaked out in 2014 and we are post smoothed solar maximum, so on those assumptions, here is how things stand.
The major world stock indices largely topped out close to new moons between Jan and July 2014 as shown in bold in the table, aligning with historic norms:
 The major indices, with the exception of the Russell2K, also peaked out at the seasonal geomagnetic peaks of the turn of the year and mid-year as shown below:
 The R2K peaked along with the hot sectors of IBB and SOCL, and margin debt, at the turn of Feb/Mar which is the projected smoothed solar maximum:

To complete the picture, demographics show us that this is a cyclical bull peak within a longer secular bear:
 In summary, equities were speculated up to a solar maximum major peak, making a cyclical bull peak within an ongoing secular bear that began in 2000. The topping process lasted from January to July 2014, centred around the smoothed solar maximum / margin debt / RUT / IBB / SOCL peaks of Feb/Mar. The Nikkei and various risk measures such as high yield:treasuries and dow:gold all peaked at the turn of 2013-14 at the year end inverted geomagnetism peak, and the remaining stock indices peaked throughout the month of July at the mid-year inverted geomagnetism peak. The majority of peak closes fell around new moons.
In short, the market peaks in 2014 align well with historic norms, if they were the ultimate peaks. If higher highs are still ahead in equities, then we are moving away from the (likely) smoothed solar maximum and out of the mid-year seasonal peaks into a less typical zone. We could make an outside case for final higher highs around the new moon of Aug 25, but this possibility is weakened further when we cross-reference with market indicators (see HERE), which also point to the topping process completing in July. Therefore, the case is strong for the top being in.
So to the short term. Markets appeared to invert at the full moon (Sat) on Friday, starting with a big drop in the Nikkei and ending with a firm close and downtrend breakout in the US. This has relieved the oversold indicators that were gathering, but paves the way for further gains in the first part of this week. If I am correct about our positioning post-second-chance then bull action should be weak and bears should regain control fairly swiftly. So I am looking for fresh lows later this week.

Thanks John. Worth noting that many investors bought protection during the last decline and with OPEX this Friday the guys that run the show might want to ensure they dont have to pay out.
“Global wheat supplies for 2014/15 are raised 1.8 million tons with increased production more than offsetting lower beginning stocks. World production is raised 3.6 million tons to 705.2 million. This is down 9.0 million tons from last year but still the second largest production on record. The biggest foreign increases are 1.6 million tons for the EU and 1.0 million tons for Ukraine both due to continued favorable weather. Production is raised 0.5 million tons for Australia based on the latest government indications for area. Production is also raised 0.3 million tons each for Brazil and Serbia.” From United States Dept. of Agriculture.
This would account for reduced grain prices. Food price is equivalent to oil price in importance and food production would seem to drop as the Solar Maximum passes which would indicate commodity price rises will rise.
If the market is thinking ahead its another reason to think money in equities will soon be tempted to find its new home in that area.
Tom mcclellan is seeing the market higher into year end with seasonal weakness into October. However, that may not mean a 10% correction.
http://m.financialsense.com/financial-sense-newshour/tom-mcclellan/stock-market-heading-higher-by-year-end
Keep an eye on the vix. Its high basing so could potentially break to the upside. Im long as of Friday but if this falls back to 1900 – look out below!
Unless the bears can save the vix by the end of the day the high basing daily is dead and i think we move higher into OPEX.
http://stockcharts.com/h-sc/ui?s=$VIX
Bull markets are often missed by the majority. We’ve had two 50+ declines in the past 14 years and the returns since then have been poor compared to historic periods.
This long term chart shows the secular bull maybe just getting started …
http://www.ritholtz.com/blog/2014/08/structural-bull-market/
That makes sense to me.
2013 was a “high stock prices” year according to Gann’s Financial Timetable (lunar declination cycle) – a lead-in year to the 2015 minor lunar standstill. Previous such years like 1937 and 1974 saw significant declines in US stock prices, but others like 1995 saw the start of new major bullishness. 2013 was more of a 1995-like year.
This cyclical analysis of the Dow (based only on price action and nothing else) shows it inverting and diverging away (since mid 2013) from what it had previously been doing. http://econocasts.blogspot.ie/2014/03/20140307-djia-cycle-chart-and-z-score.html
So the future part of this cyclical analysis will be inverted, bringing it back into line with Gann’s Financial Timetable indicating a top around 2018 (I would estimate SP500 exceeding 3000 by then). The big question in the meantime, is when will the intervening panic occur? Many things, including the sun’s polar magnetic field strengths, are pointing towards 2015 – and especially autumn 2015…
There is no reference to demographics and no reference to solar cycles, there is no understanding. Plus, secular bulls do not start from these valuations, the worst bear markets in history do:

But focus in to 1995 and the subsequent few years on that dshort chart; very similar to 2013 and… (the next few years?).
Could be, Duncan…. Could be…..
But basing ANY long or short positions off of that chart is nuts….
Because we could easily drop to 12k, or 10k, or 8k, or even 6k on the DJIA, and all he’d do is change the last “13+ years” label to 14+ or 15+ years…
I mean, he could very well be correct, and with the value of the dollar always changing, it wouldn’t surprise me at all to see the Dow at 30-40-50k in my lifetime….
But my point is, it could easily be 5k first…
And the chart you mention would still be “right”…
OR am I missing something completely??
Barry
Mark, the “solved” version of Gann’s Financial Time Table uses the North Node fwiw.
Thanks Peggy – I’m not familiar with that version. Is it intended to refine the original timescale, and be more forward-looking? I noted with interest the dates you mentioned recently; it seems a market panic could erupt at any time from now on..?
Talking about the North Node – I see some Indian astrology experts regard it as having supported the stock markets, and that that support remains intact after the recent planetary realignment.
My opinion is that it is the “decoded” version based on the clue that Gann provided at the bottom of the original FTT – “December 25, 1989 revises to March 13, 1934”. Yes, according to this version a panic is expected between June 2014 and Jan. 2015 with a smaller possibility of the panic extending to April 2015.
SPX 1942 and futures retraced 50% of decline. As oversold conditions have cleared it is great time to add to short positions. Although higher levels might provide even better entry one should not bet on it. I am convinced S&P 2K will not happen for at least few years. Surprises will be on the downside in that cycle.
It seems bears are again on the wrong side…this reaction is (ridiculously) strong than expected
just two days to erase half of market’s loss. it seems impulsive. I will reopen short only at 2040ish or under 1920ish levels
Shorting is best done during a bear market when price is below and stays below the 200sma. Short dips to or below are buying oppotunuties. Trying to pick a top is impossible.
sma200 is rapidly rasing…it’s healthy a test now after 450 days without a touch. If market can not reach escape velocity from it with new highs, It could be ugly because market will expand losses when it breaks down.
nasdaq continues to overperform djia and spx. speculation is in play for the moment.
If you are thinking about shorting the markets please read the following. Im sure everyone agrees that buffett is a smart man. Here is an article where he admits he would have lost all his money if he did it. No one can truly tell when a bubble will pop so you will need deep pockets and even then it might not get you to break even after you have paid off the fees and dividends whilst holding your shorts. Just food for thought:
http://investdigest.blogspot.co.uk/2006/02/warren-buffett-on-shorting-stocks.html?m=1
if you correct john id expect now that weve hit the 50% fib that that will be it and the bears will quickly take control again
it does look to b corrective (abc)
The McWhirter book discusses the North Node in her first chapter.
Duncan I can see the “reply” icon under your post…but I agree with you and Warren Buffet. Said that, correction and severe correction occurs in a Bull market.. and it is what we are searching to discuss here. I appreciate the link 😉
You’re welcome. My posts today might make me sound like a permabull. I’m not, just that we need confirmation that a top is in. No signs of that on SPX. Although there could be on Dow. I’m even thinking R2K goes significantly higher here as the last drop looks corrective rather than impulsive. I understand its PE ratio is off the scale but it only matters till it matters.
That’s the difference between your analysis and that of John and Gann. There is nothing wrong with that. You wait for confirmation whereas Gann looked at cycles though the Law of Vibration and predicted market action based on universal law. In particular, focusing on the Law of Seven and the Law of Three.
Really a few people expecting major decline. I think until end of August we should test February lows in SPX 1750 area. But I think this support will also prove illusory as bear market will not honor bull market rules and supports. This crash or rather series of crashes will be for history books. Many talk about low bull percentages in various investor surveys. I think we will get accustomed to 10-30% bulls for months if not years
John, your work is always second to none. Say, would you happen to have the similar chart to this ( https://solarcycles.files.wordpress.com/2014/08/10au2.png ) for 2013? just curious how it lined up last year. Thanks much!
Thanks. 2013 was a trend year up, the cooking of the stock market mania. There were no seasonal corrections, just some adherence to lunar phase timing.
spread between ndx and indu is widening too much
http://stockcharts.com/h-sc/ui?s=$INDU&p=D&yr=1&mn=10&dy=0&id=p30100999052
http://www.accuweather.com/en/weather-news/fall-2014-forecast-polar-vortex/31254218
I wonder if the polar vortex does more than just affect the weather. The article mentions September. That’s when the tides give the low for this correction. Can the polar vortex create an inversion of the trend?
Yesterday’s action eventually produced a bearish candle, which is promising for my case. CBI reset to 2 and various other short term oversold indicators have been worked off in the Friday/Monday rally. Volume was lighter on the up days versus the down days. So I maintain my expectation of new lows by the end of this week.
John, your elegant synthesis of these causative/correlative factors is beautiful. Just as incredible is the import of now. The consciousness/awareness of the historical significance is incredible. Thanks.
Is something really big happening with oil. For the last 25 years the commitment of traders used to reach a maximun of about plus or minus 100,000. Since the bottom in 2008, it has worked its way to 500,000 long speculators and 500,000 short producers. According to Briese of Commitment of Traders Bible, the time to sell is when the last speculator has bought. This could have happened at a point where the longs could be extremely over committed. Two interesting oil stories per Briese. Producers are natural sellers as that is what they do. Six months prior to the invasion of Kuwait, the producers became big buyers. The other was the huge blowoff of oil to $147 in 2008. It was caused by the producers covering their short (sells) because they were tired of the huge margin call (losses). This is a very rare phenomenon as hedgers would’t hedge if there were frequnt large losses.
Thanks Kent
Hedgers own the underlying therefore the loss on the short is offset by the increase on the underlying physical that is the definition of a hedger ? Total shorts must always equate to total longs under all categories of trader .
Im adding here to my long on friday. This pullback looks correctives vs the impulsive move higher on friday and monday. Looking for the market going higher into OPEX this Friday. Still think we get one more high above SPX2000 even if it is to just get the headlines before a correction.
There are some who believe that all vocal bears must capitulate before the top. For example, Tiger in 3/2000. http://money.cnn.com/2000/03/30/mutualfunds/q_funds_tiger/
Are there any examples of bears that did make it through the top? Or are we all doomed?
Hussaman?
Just crossed my mind that we havent heard much about the sorrette bubble recently. If you look at the general structure it fits a rising wedge and we are in a massive rising wedge going back to 2011. Now most of the time rising wedges break down and I think thats what will give us our 10-15% correction. However, rising wedges have also been know to break up into a channel. I think we will know the answer in the next few weeks.