
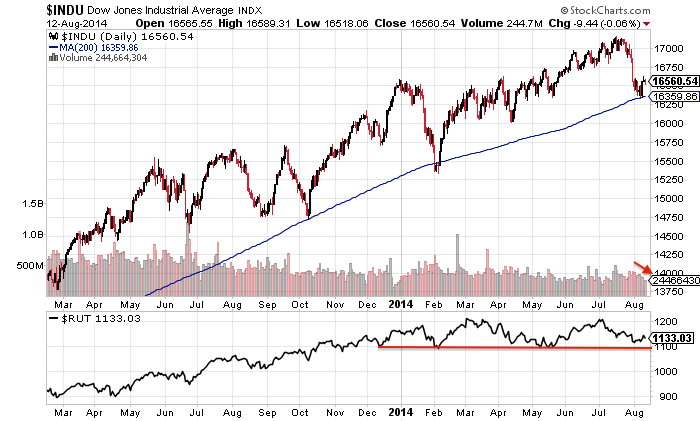
Yesterday’s action produced a doji in US large caps, or indecision, so we roll over to today. This is how the Dow and R2K look:

Source: Stockcharts
The Dow has been saved 3 times by the 200MA and the R2K 3 times at horizontal support. Looking for a technical trigger for the waterfall declines: both to break down and initiate the voluminous selling. The small red arrow shows that volume has ebbed away the last 3 sessions; volume remains more dominant on down days.
Biotech is in the nose of a triangle, ripe for resolution, adding to the case for the downside break to be close.

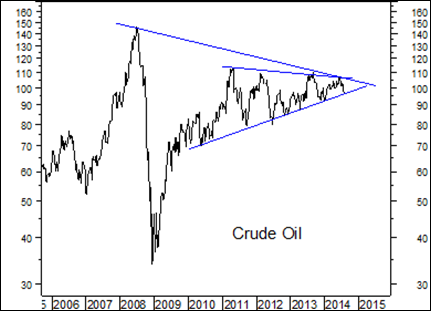
Source: Stockcharts
Crude oil also looks ripe for resolution. Weak growth and deflationary pressures suggest this will fall, along with equities. Meanwhile, gold and gold miners continue to make a sturdy base and I believe they will rise as safe havens.
Source: StreetSmartPost
Demand for safe havens is high, with German 2-year bond yields turning negative. Investors are choosing a guaranteed small loss over the alternatives.

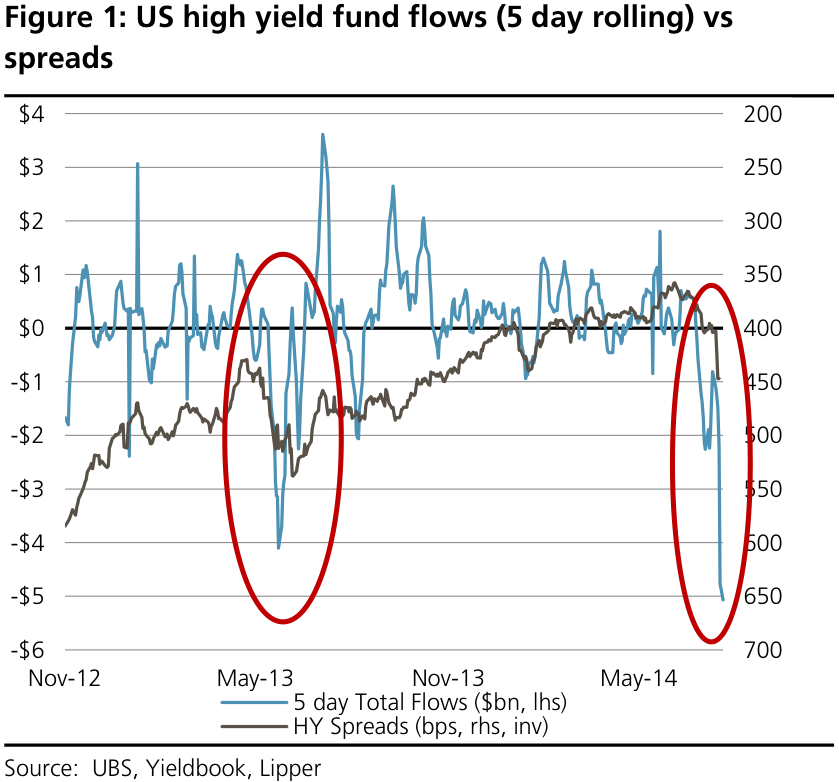
Source: SoberLook
There has been a hurried exit from high yield bonds, an asset class that had become very lop-sided like equities. Investors went all-in on corporates in both shares and debt.
Source: BusinessInsider
An updated look at sector performance year-to-date shows an alignment with the top of the stock market cycle and suggests we are beyond the peak:
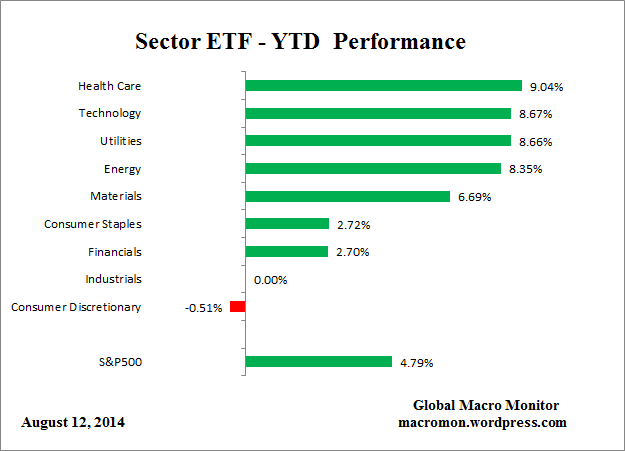

Source: TradersLog
The SP500 levitation above the 200MA is second in duration to the the one that terminated in 1998. The subsequent 6 week 20% drop that occurred then is similar in speed and severity to the other analogs I recently drew together, and occurred in the typical window for drops: July to October.

Source: JohnKicklighter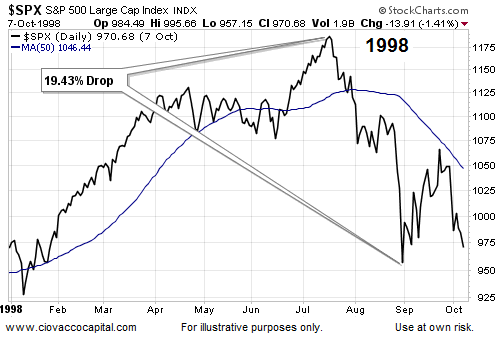
Source: Ciovacco
Japanese Q2 GDP, net of the sales tax, came in negative. Like the US Q1 GDP print, which net of the cold weather was still negative, it reveals a world economy still in trouble. More reliable on China data shows weakness too:

Source: FT
Fed officials’ vocalisations of ‘secular stagnation’ are being reported in the media, namely their belated realisation that maybe the economy is not going to normalise after all but remain weak and troubled. This was written in demographics all along and suggests they did not and do not understand that driver.

John,
With respect I dont think volume here matters. If you look at the chart you provided, mid April through to mid May 2013 saw declining volume but the Dow moved up substancially. Same at the end of June 13 and beginning of September.
Also analogs have not helped in the last year. Market has been compared with 1987 and 1929 but each has been nullified. IMO price has been contained in a massive rising wedge.
Just my 2 cents.
Thanks John, I can’t believe how prolific you are in regard to research.Astounding.
This is now the most overvalued market in history, even more so than 2K because this has been across virtually all sectors.
Andre, you may have nailed this. If memory serves me you said:
High Monday, low Tuesday, high into 19th then down into September?
A lower high on the 19th would fit the scenario for a larger decline into September.
Cheers
Allan,
Thanks. Yes, that’s what I said. It’s just that I expect the September low around the 10th. And then up into November for the final high.
We’ll see.
Cheers,
André
Andre – do you have specific support levels in mind as well for the August low and Sept low?
Martin,
The tides don’t give pricelevels, only timing and direction. But how strongly the market reacts to gravitational force can differ substantially.
Keep an eye on the 50sma. We should get a test at the very least. It we get a close above I think it provides more confirmation that new highs are coming.
yes
“belated realisation that maybe the economy is not going to normalise after all but remain weak and troubled. This was written in demographics all along and suggests they did not and do not understand that driver.”
And this is why we all should be very worried. Iran has flip flopped on contraception and abortion policies now and in past due to demographics. Dictatorships have more control over this then democracies. Here in US, going to need to create incentives because many of those immigrating to the US are not suitable replacements for economic and demographic drivers. Europe and Japan will need to do same. Russia has their day each year. China modifying policies slowly already. Africa and India there is still murder/sterilization of females in favor of males.
Personally John, maybe I’m tuned into it or something, but I have seen my share of big bellies more then usual this year. You highlighted birth rate versus solar cycles a long while back. May be worth to blow the dust off for new visitors?
These 2 charts:


Bulls have taken vix below 200dma. If you look at the daily chart bears tried to pull price above the 200 but failed. I think we see 1955+ by Friday.
I added long with this confirmation (this is before the close though so taking a bit of a risk that bear drive vix higher)
Duncan, just to say I appreciate your comments as they act to lessen my confirmation bias/myside bias (I’m currently short).
Youre very welcome John.
Two exceptionally bullish looking charts:
http://stockcharts.com/h-sc/ui?s=NUGT&p=W&b=5&g=0&id=p34396573505
http://stockcharts.com/h-sc/ui?s=GDX&p=W&b=5&g=0&id=p90189054546
Indeed – and at a time when virtually nobody has any interest in them.
The only better buy-of-a-lifetime I can imagine will be if the likes of JNUG loses half its value by around March 2015 (its possible) – then buy even more. That would be the downside limit, but the upside is literally unlimited…
Since when do confirmed down trends look bullish? Even a large rally from here would probably only be bear mkt rally.
For those of you who are commodity traders, take a look at lumber (LBS). Pretty clear reverse head and shoulders confirmation on the daily chart and looking out further it’s a clear triangle that is close to breaking out.
Downside is that lumber is fairly illiquid.
Have added short today. GDP in eurozone I think will dissappoint giving us our next leg lower.
I find it absurd how the market rallies on geopolitical easing when it is clear geopolitics is barely priced into the market. I’m starting to see how John’s scenario is going to play out and I’m liking Andre’s work too. Have to admit I had my doubts in the first half of the year as the market refused even a small pullback for a many months but its looking different now.
Bears have no power… it’s all a buy buy buy again (with fed-savers-government money) by istitutionals, hedge funds and aliens too, all united to pump stock market
The bears have plenty of power. It will be shown when the bulls are at their most vulnerable. That’s how it always works. The Fed can print endlessly but when the dollar becomes worthless as a result the economy will collapse and then nothing can hold stocks up. The end game is a win for the bears. It just might take a long time to get there.
Sorry but I find this has no sense. If you think so buy gold and silver. Do not short stock market
John –
I understand if the stock market goes down, gold is the anti market trade. However, I am looking at commodity indexes, geopolitical issues in Ukraine which may be resolved by Germany and Russia themselves, and an increasing dollar – the gold trade to me does not seem to have a lot of big upside here.
Doug Casey, the greatest living speculator and a billionaire, disagrees with you about gold. You might want to read some of his articles on the subject.
Ya’all think too much. The index charts is your subject. So forget the noise and be students of them. First step is the application of Elliott wave theory for direction and location. Without direction and location you don’t have a clue.
With scant study you will realise that within the 2nd phase of the bull super cycle that commenced 20th Nov 2008 there will be 5 primary impulse waves after which there will be 3 primary corrective waves. Repeating for all eternity, like the universe itself. Impulse waves drive the bull trend and alternate up, down, up, down, up. Corrective waves drive the bear trend down, up, down. The purity of nature itself. At present we are in the 3rd primary (of 5) within which there are 5 major waves. The 5th of these major waves has been active for most of this year. It too has 5 (intermediate) waves. We have just entered the 5th of these. Here again there are 5 (minor) waves. We have just entered the 2nd one.
The roadmap has been there all along, but there are none so blind as those who are driven only by endless noise whilst blinkered to the obvious.
So what’s your EW projection looks like? 2100, 2300, 2500 by the time it hits 5th of 5th of 5th….?
Definitely an interesting day. Virtually all earnings, Japan GDP and retail sales tanked, geopolitical front is terrible and of course fed is still on course to eliminate easy money QE within 2 months. Margin debt is back to within .3% of its February high and yet, the market is surging and in no danger of violating any of the key moving averages. This doesn’t bode well for gaining any bearish momentum. Just the opposite. Will a correction happen, yes someday, but for now the trend is clearly up and the wall of worry is very large. I favor the bearish argument at these levels but the trend shows a different tale.
Good luck all.
A 4% correction is really poor downside. This market is fast and only techincal. You should leave brain out or it will destroy you. If you are an investor take some profit…if you are a trader stay away from long/short position for the long term . It’s an unreal market fully controlled by istitutionals. bubbles and crashes (when those on the wrong side will be destroied)
http://stockcharts.com/h-sc/ui?s=IBB&p=D&yr=0&mn=11&dy=0&id=p98908335033&a=363569790
pivot at 1951 is tough resistance for spx – with only 400ml pomo today this could reverse if relative strength keeps indicating selling into the rally
http://stockcharts.com/h-sc/ui?s=$SPX&p=D&yr=0&mn=4&dy=0&id=p72175858274&a=305384923&listNum=4
IWM has to get over 113.47 to confirm the buy signals here
nasdaq and ibb show that all is unreal… market going parabolic pumped by unreal money to steal real money, firts from shorters and then from the last longers. Who is buy IBB that is 4x in a couple of years and why? It’s all just an illusion but the money you lose in this “game”.
watch $NAHL:$NATOT ema’s and simply trade accordingly or stay out and see the unit of measure cut your life down to size…
http://stockcharts.com/h-sc/ui?s=$INDU&p=W&yr=20&mn=0&dy=0&id=t39891287540&a=297459295&r=1407955132117&cmd=print
little doubt but…delay they can
http://stockcharts.com/h-sc/ui?s=$INDU&p=M&st=1995-02-05&en=2014-08-13&id=p53004117885&a=297460141&r=1407955236513&cmd=print
There is still too much fear in the markets. CNNs fear and greed at 8. Was 5 last Friday. I recon we hit 95 extreme greed when we surpass SPX2000. There will be a ton of people shorting for a double top at 1990 with a stop at 2000. Don’t think the market will make it that easy.
the 8 ema crossing the 21 in this chart would be confirmation of CIT
http://stockcharts.com/h-sc/ui?s=$NAHL:$NATOT&p=D&yr=0&mn=6&dy=0&id=t49121279248&a=344670944&r=1407950594665&cmd=print
John’s biggest analytical deficiency is that he doesn’t realize that we have been, for several years, in a new era which has a symbol of very depressed real interest rates along with very low nominal interest rates. Risk-free interest rates are vital for valuations of any kind of asset classes. Should those interest rates stay negative/very low for another decade, only God knows how high stocks P/E would be. So, the current bull market is very wired when compared with the past ones. It is immune from bad economic data or news. The worse data/news, the lower expectation of interest rates for the future, then, the higher stocks valuation for now.
buy buy buy buy…. it will never end. cash level rose to high level, asset allocation to us equity low … three days and we are near recent highs… sma 200 will rise over 1900 and will be support. Bears are burned again after a quick correction where few have gained.
http://fat-pitch.blogspot.it/2014/08/fund-managers-current-asset-allocation.html#more
there were an article in wich the autor of this blog reported that in the sixties with low interest rates the market valuation in terms of p/e does not become so expensive as today. We are in a bubble with a lot of sectors very very expensive. I don’t believe we will see a p/e 10 at the low levels of the previous generational lows but this market should correct part of the large gains of these years… At least a retest of 1800 is DUE. The problems are big istitutions that want to make bubbles every times bigger. Who is buying futures in the night and in the after ours …who squeeze shorts every times on economic data : it is simple Goldman Sachs and Co.
Market is at 122% market cap/gdp… I think it could stay for just few second at 110-112% befare the uptrend resume. With all bad news of these days I cannot believe nasdaq is just 1% from previuos high… someone is sustaining with futures the market, too much put selled in these days.
If the mkt keeps going up in the face of such extreme optimism, it is a new era.
The timing was alittle off in terms of when the correction started but this is the beginning of the end from a price action standpoint. There will be a double(possibly triple) top and then it is all over. Just not sure where the double top is.
I think heavy nyse and dow jones are telling this story… nasdaq is not a serious index and is going to make new highs.
I think after an almost complete recovery nyse will touch 10000 again.
http://stockcharts.com/h-sc/ui?s=$NYSE&p=D&yr=1&mn=6&dy=0&id=p94193820007
I’ve covered this before. In the 1980s conditions were the opposite: stocks were depressed and rates were extreme high. Investors could choose bonds at no risk and twice the yield of stocks. Yet stocks outperformed from low valuations, under a demographic tailwind for equities. In 1937 we had the same conditions as now: low rates and a form of QE, yet stocks entered a bear market, from high valuations. Plus, Shiller himself says it does not alter the historic predictiveness of CAPE whether he factors in or out what rates were doing.
New era huh? If the market keeps going up with new era talk and being wired, it truly would be a new era. Old era is when people are saying high prices are permanent, a fixed part of a new era that justifies it – historically, that is a sign of a top.
Germany GDP dissapoints at 0.2 compared with 2.5 last quater yet little reaction. Wouldnt be supprised to see DAX close up as its already taken a hammering last few weeks.
Like most major declines recently – its not driven by economic or company reports. This is a sentiment driven market.
Agree. The fact its sentiment driven makes John’s scenario of quick heavy falls more likely as sentiment can change overnight but an economy can take a longer to turn up or down as we have seen over the years. Not long to wait before a much bigger drop in equities me thinks. The low will most likely be in October before a big retrace up into year end and then a bigger collapse in 2015/2016.
Yes just seen that, France also stagnated it’s GDP.
Germany GDP for Q1 was 0.8%+ Q2 was already forecast to contract minus 0.1% it came in a little less at minus 0.2%, not really much of a change at all. Prob why there little change today.
But wait for Q3 (14th Nov) forecast is at 1% + I think they will miss this target by miles.
http://www.tradingeconomics.com/germany/gdp-growth
See John previous report. Excellent overview of the long term european trends.
Germany and France should have just fudge the figures like the US does.
Maybe they did? I suppose their only so much fudging you can do before you get caught cooking the books.
We are headed for a high on Tuesday 19th. There’s no news that can change that. Today a high and a low. Tomorrow a high. Monday a low and Tuesday the final high. Duncan is right: this is a sentiment driven market. And it has always been one. And natural forces drive sentiment. Even calling it Elliot waves won’t change a thing.
When will you post the Sept forecast ?
If you guys are interested I will post the September forecast next Sunday.
Cheers,
André
imho John’s great work and thorough analysis is slowly but surely playing out nicely. This market is testing our patience big time, as the topping process is stretching for almost 8 months since earlier this year. We are at the crucial point now, where the market either crates and falls hard as John has predicted, or at the minimum the Dow would retrace to 16000 before making new high in Oct/Nov.
From the EW perspective, I think we are on the b wave corrective move. If the count is valid, then then there are 2 scenarios that I suspect: 1. Dow to 15000 or lower imminently. 2. Dow to 16200 then bounces back to 17400 or higher.
Thanks Andre also for your great input. You’ve added a great dimension to John’s brilliant analysis. I sure hope that we all will be celebrating together sooner than later.
The markets have now become typified by very strong opinions; in both directions. Investors have set out their stalls. They’re not for turning.
All speculative markets are always sentiment driven. Prices go down until enough bulls have been scared off; and prices go up until enough bears have been scared off. It seems to me that there are a lot of bears about the stock markets, but that’s a matter of personal opinion. News, like surprising GDP numbers, are just a spark for increased buying and selling, but it is always the prevailing sentiment which influences direction.
The vast majority of investors are not actually investing in anything – buying shares on an exchange merely involves a transfer of ownership of those shares. Only those who lend to start-ups or buy new issues are really providing any new investment. The two traditional reasons for buying shares are to collect dividends and hopefully benefit from future share price increases. But now there is a third reason – to protect wealth from interfering bankrupt governments and banks.
So, an individual investor acts only on his/her behalf; but it is the overall flow of money from one place/market to another which makes the difference.
individual investors (also considered as a whole) have no importance in determination of price. Only big banks and FED (secretely buying (who can control?)) have importance in market direction.
http://systematicrelativestrength.com/2014/08/14/fund-flows-207/?utm_source=mcverryreport.com
Lots of resistence around SPX 1950/60 mark. If bulls can push thru we should be on our way to SPX 1980ish fairly quickly. Imho.
Im looking to add long if we do clear that level. Ultimate target SPX 2000+
IBB breaking out to upside
Another Coronal Mass Ejection today and, yet again, it is farsided and directed away from us. During 2014, geomagnetism and visible-sunspot numbers have spiked in close timing with the sun’s Carrington rotations: http://www.solen.info/solar/index.html
In other words, one side of the sun has been creating more sunspots than the other, and storms have tended to occur when that active side has been facing away from us. The correlation between solar activity and rotation has been especially close since April 2014. This is also when Venus began to swing towards Jupiter into opposition with us. Venus-Earth-Jupiter alignment is a primary driver of tides in the sun’s plasma, so I wonder if those tides have been increasingly influencing the location of this magnetic activity?
Venus and Jupiter will reach maximum opposition to us in the next couple of weeks, so this could result in Earth increasingly receiving more of its fair share of geomagnetism this autumn. That would not be supportive of further stocks speculation, but an important consideration is whether it would be matched by continuing high sunspot numbers. This is important because the first geomagnetism high at each solar peak is primarily from CMEs (and CMEs are associated with sunspot groups). The second geomagnetism peak (typically a year or so after the SSN peak) is associated with coronal holes and decreasing sunspots.
So sunspot numbers during September to November will dictate whether SC24-induced speculation will end soon, or be extended to either spring or autumn 2015. With the solar polar field strengths still so weak and going absolutely nowhere, the latter must be the more likely.
JNK regains its 50sma. I would not advise shorting here as JNK regining 50sma is a sign of risk on.
Ive added to my SPX longs.
It does look like it might grind higher but not with any conviction. As Andre mentioned next week is the one to look for with regards to a another market top.
Lots of people calling a bear flag on daily charts. Ideally would like to see VIX close below 50sma and RUT regain its 200sma for more confirmation.
Nasdaq about 1% off ATH. Looking for that to get a new high soon which will give us more confirmation that SPX is going for SPX2000
Nasdaq within 1% of ALL TIME HIGH?????
Good spot – mean this years highs.
market is far away from the high it will reach. this is the superbubble my friends… corrupted america is showing its power with war and bubbles. Nasdaq composite will break all time high at 5200 points. It’s finish bears for short position strategies. Corrections last some days and are modest, then a squeeze start rapidly: this is all that is left to poor bears. precious metals are manipulated, bonds are expensive, all wants you to buy the bubble. It’s been a miracle the correction to 1900, anyone who was short from 1850 had his occasion to close with a modest loss.
John, thanks for the effort you put into your blog, I enjoy reading it. Regarding your hypothesis that solar cycle maxima coincide with stock market peaks what are your thoughts on 2007 where the solar cycle was bottoming? You may have addressed this elsewhere but I haven’t found it.
Thanks. The market bottom at the turn of 2008 to 2009 aligns with the solar minimum bottom. We crashed into that and crashes/panics at the solar minimum have been common. As solar cycles are only ~11 yearly there will be cyclical bulls within that, but I feel it’s an area I can work more on.
Damn I hate to say this but this looks like it is going to break higher. Things need to turn down hard virtually now!
http://stockcharts.com/h-sc/ui?s=IBB&p=W&b=5&g=0&id=p98601924850
Slow STO hooking up. Weekly price action looks like a bull flag. Should get confirmation early next week if it is intended to go higher.
Dates to watch. 25/26 August. 4 Sep.
Dont underestimate the bull.