
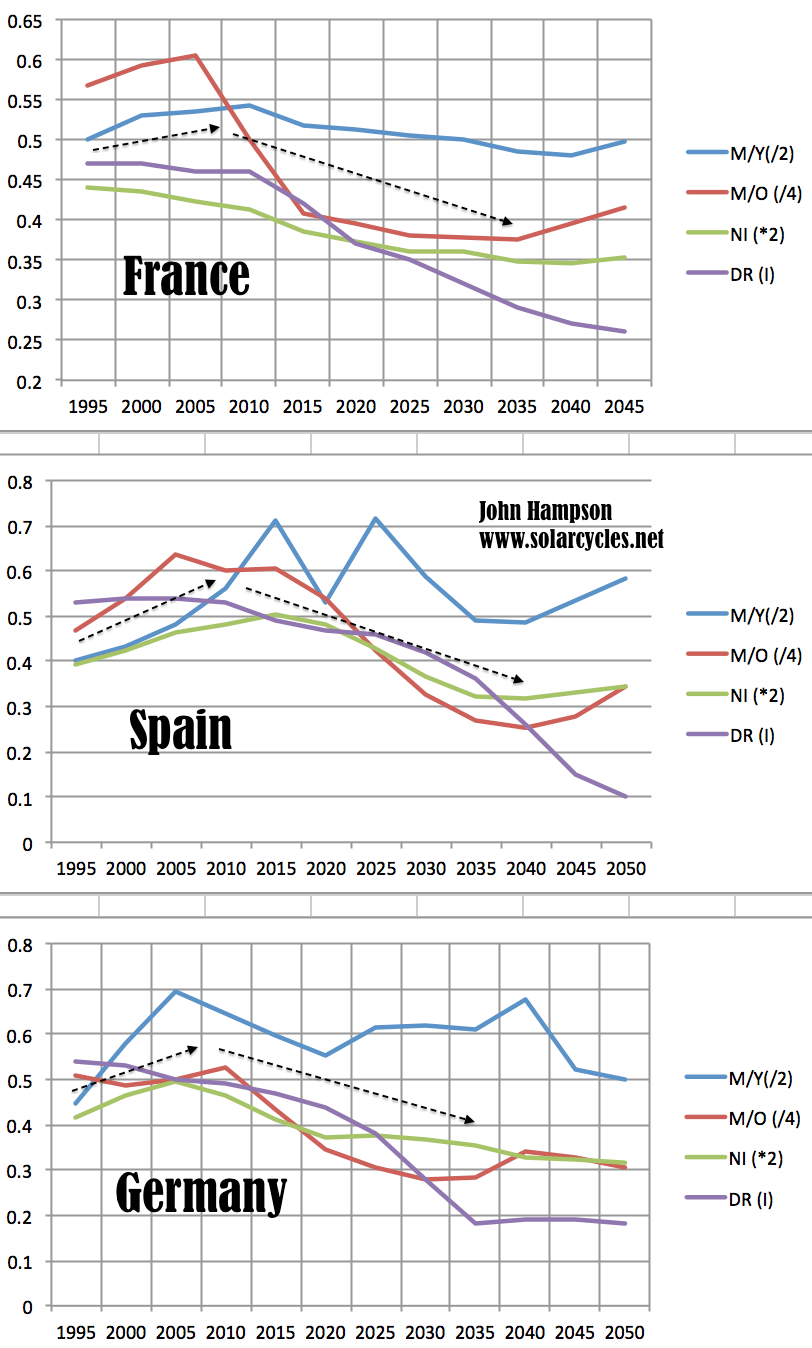
In the last decade, demographic trends in the Eurozone turned from growth-positive and inflationary to recessionary and deflationary.

Cross-validating this, we see a trend of disinflation since the peak that is threatening to turn into outright deflation: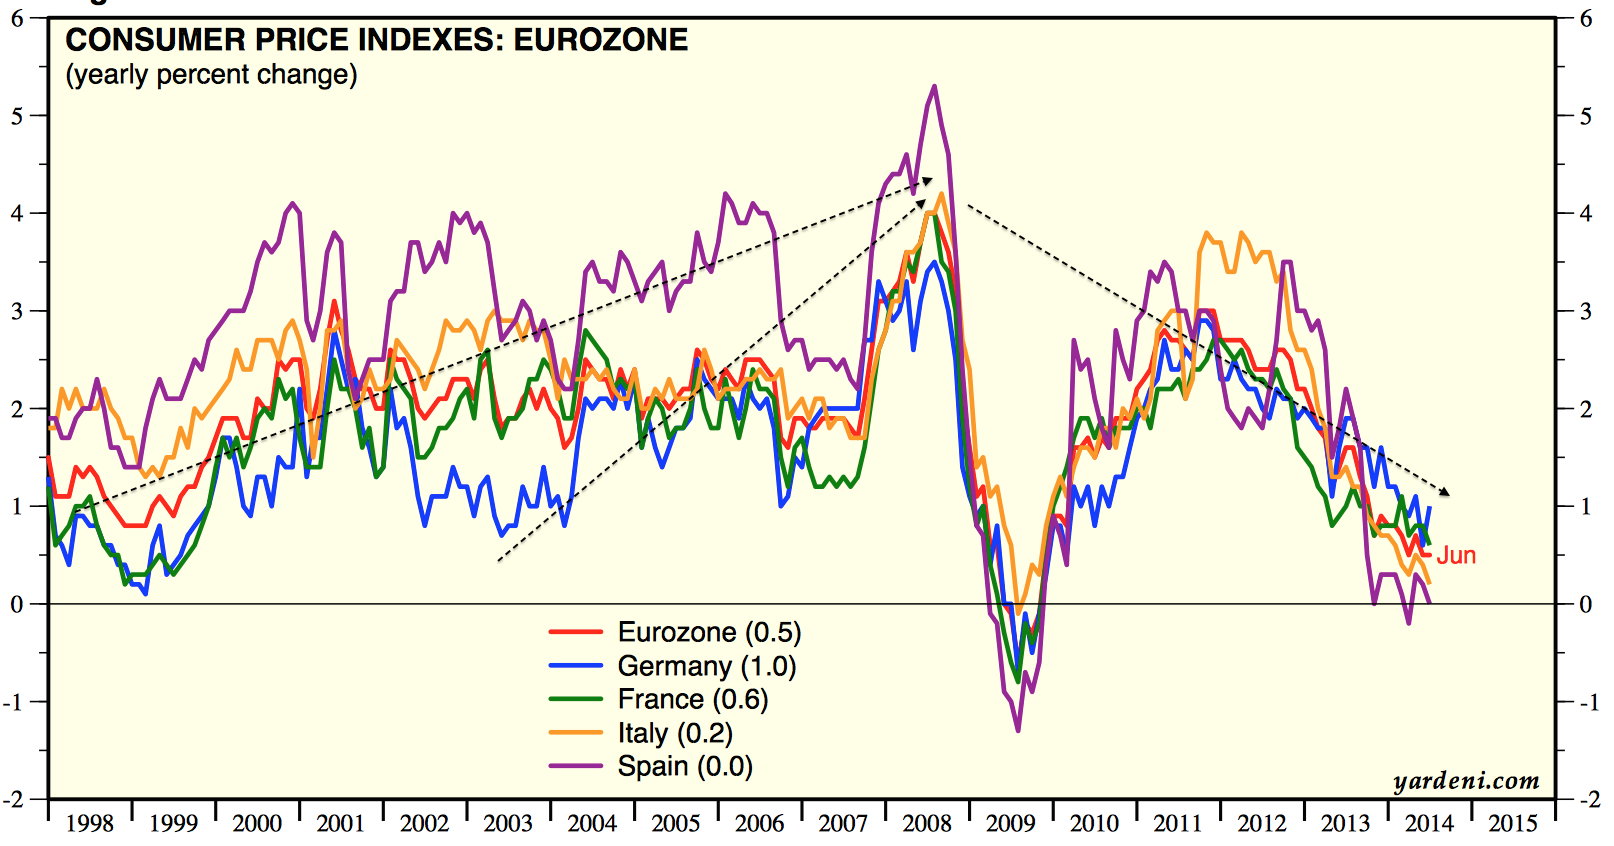
We also see overall slowing economic and credit growth since that demographic inversion: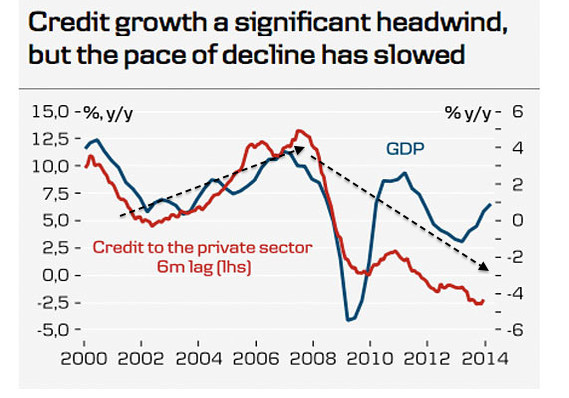
Meanwhile the rise in stock prices over the last 2 years has been multiple-expansion rather than earnings based, in keeping with the weak economy (and the solar maximum driving the speculation): In the latest data: Economic surprises for Europe continue to stay below zero; Italy has re-entered recession; German and Spanish bond yields are at record lows; German industrial orders contracted at their fastest rate since 2011; Eurozone retail sales have fallen sharply since June.
In short, Eurozone equities are due a sharp correction and the negative effect from falling stock markets is likely to tip the weak economy into outright recession and deflation, an outcome that was written some time ago in the demographic trends. Those trends suggest the next 2 decades will be difficult for the Eurozone, and that picture is consolidated rather than offset by demographic trends in USA, UK, Japan and China.
Short term US equities: Little movement the last 2 days. Stocks consolidated their breakdown, or exhausted their selling momentum, take your pick. Oversold indicators remain in place arguing for a bounce, but indicators for the overall correction suggest more downside is ultimately required. By my work we are post-second-chance and drawing on the analogs bulls should get little look in. The best fit then would be another leg down here into the weekend’s full moon, continuing to make it difficult for people to get in or out of the market, and gradually ramping up the fear. Gold broke up over 1300 again yesterday, and its large basing pattern continues to build.

Just for fun I used the DJ low of 1932, the high of jan 1973 and the low of dec 1974 for mastertiming. This represents the cycle structure of the last 80 years, almost starting at the birth of the DJ index.
For 2014 It gives 3 clusters of dates : march, june/july and okt/nov. For dates 40 years apart (1932-1974) it is remarkable to see the dates for 2014 are within 4 weeks periods. The 2000 – 2009 period also pointed to july and november as significant dates. How’s that for coincidence?
I’m still analyzing this stuff, but my current impression is that this analysis adds value.
I am mainly an intuitive person and I love reading all your research to confirm what I feel. Ireland overall shows little life but Dublin is doing better. Any salary rise is countered by increased taxes which reduces the take home, so there is no incentive to work other than to keep the job, and the shops still stand empty wherever you go. The propaganda machine is all thats left, I feel something heavy is coming down in the next year or two, maybe sooner.
I suspect that “something heavy” will be connected to the confiscation of your wealth. Try keeping any of it in cash or small quantities of silver, and you’ll be automatically labelled a criminal: http://newstalk.ie/Revenue-sniffer-dog-Barney-wins-Golden-Paw-Hero-Award
“In one particular operation, the search of a premises led to the discovery of €30,000 and two silver bars valued at €10,000 hidden in a wardrobe.”
I have the feeling as well. Folks keep forcing the idea that the 80’s and 90’s are a normal economy when in fact that era was a demographic boom anomaly. This is preventing the rot in the system from being flushed out, which it desperately needs to rebuild stronger.
The question of what the ECB will/can do is still out there. IF Draghi can get banks to lend again, that will help stimulate economies in the EU. That’s a big if, what with the banks still in deleveraging mode and the difficulty Draghi has in getting all parties to agree to such a program. Regardless, one observer who should know, El-Erian at PIMCO, believes nothing will be done until after the summer. A case of Nero fiddling while Rome burns?
http://www.bloomberg.com/video/el-erian-ecb-to-do-more-on-economy-after-summer-5w86i9JGRZ2pVk951JFIvQ.html
LOL. Just like the Fed tried to make the banks lend here in the states. Only thing banks will do with the money is to cover their balance sheets or invest it in the casino. Hence, there will never be inflation, THE MONEY NEVER GOES TO THE STREET OR JOE SIX PACK. The debt monster has 30 plus years of debt to eat before it’s full and the Inflation or hyperinflation can ever poke it’s nose.
Never let a good story get in the way of the facts, I say.
http://research.stlouisfed.org/fred2/series/BUSLOANS
http://blogs.reuters.com/macroscope/2014/08/04/ecbs-fingers-crossed-for-loans-growth/
How much longer can people swallow this crap!
Week before last we were told GDP spiked for the qtr to 4% whilst unemployment had risen and today we are told to believe that the four-week avg for jobless claims dropped to their lowest level since 2006.
I am fast running out of absurdities to describe this farce.
What does m/y, m/o, ni, and dr stand for?
i) middle-to-young ratio, (ii) middle-to-old ratio, (iii) percentage net investors, (iv) dependency ratio (inverted)
Yikes – from Bill Gross:
Russia/G7 trade war getting ugly – trade, airspace, etc. Eu headed for recession. Own Treasuries.
http://stockcharts.com/articles/dont_ignore_this_chart/2014/08/did-you-see-the-soaring-volume-on-xly.html
so, bill gross must be wanting to sell treasuries
Cynical group here today, lol. In this case, I think Bill is talking his book. For God’s sake, he’s not always wrong! 🙂
Early promoters of A-B-C correction were shaken off this morning so the afternoon rally seems plausible. In this trend surprises are on the downside…
Waiting for tech leadership to break down and the US long bond to break above 139. Everything else appears to fall in place for a replay of 2008 – euro weakness, financials and housing stocks leading down, weakness in commodities. Let’s see.
I’m looking for a severe correction on this ratio. Tech stocks are becoming very expensive if compared to dow, europe, emerging market.
http://stockcharts.com/h-sc/ui?s=QQQ:EEM&p=D&yr=3&mn=0&dy=0&id=p39671200515
Chris Puplava is still resolutely bullish.
http://www.financialsense.com/contributors/chris-puplava/be-fearful-when-others-greedy
The points presented in Puplava’s article don’t resonate with me (regardless of whether his view turns out to be correct). Even if we take a neutral view and assume the market is a random walk, then we’d expect much of what is referred to to naturally occur in-step/contemporaneously with rises and falls in the market and none of it predictive.
We’d expect bullish (bearish) books & magazine covers during and after price increases (decreases). In a bull market (defined with hindsight) we’d expect short interest to rise during falls, followed by price increases (it’s a bull market, right?). Many hedge funds are trend-following which usually requires prices to change direction by some degree before trading so they’d often be long (short) at peaks (bottoms).
The VIX & the put/call ratio rise when price falls so during a bull market (known with hindsight) they will increase during and close to bottoms. A trendline from early 2009 to the peak in 2011 would have been decisively broken but it turned out to be a short term correction in a longer term bull market, so the longer term trendline won’t be broken until it’s, err, broken.
What I Can say to your comments, yes. The three things Puplava said that were consistent with bottoms is true. It is also true, they are consistent with bear markets. What we need to know is whether it is a bear mkt or not which will not be known for a while (hindsight). The gold bull mkt from 1998 to 2011is a perfect example. During that time period, everytime it fell to the 200 day ma, it was a buy, same for every time it formed a triangle, got temporarily oversold, cot speculators were short, etc. Then, in 2011 gold fell to its 200 day ma, formed a huge triangle and fell (perversely) through the 200 day. Then, tremendous buy signals such as cot spec short levels were given, it proceeded to fall even further. It was now a bear mkt, but an 11 year bull mkt had trained people otherwise. What PulPuplava said is actually indicative of a bear mkt, but we won’t know until it falls through its 200 day ma on buy signals. The majority is right during trends and wrong on both ends. Buy buy signal and ignore sell signals during bull markets. Sell sell signals and ignore buy signals during bear markets. By the time I learn the rules, they change the rules.
Great stuff as usual John. I believe we hit a top like you wrote a few weeks ago. The only part I am unsure of is whether this is the absolute top, bypassing the second chance. Although I have not done the in depth analysis you have, I want to point out that in Oct 2007 the S&p topped out but the water fall declines did not happen till Sept-Oct 2008 IMHO.
Also S&P topped out in July 2007 but then double topped(second chance) in Oct 2007. Margin debt was already down by Oct 2007 but still double topped then. The reason why I am mentioning is that RUS2000 at that time had a top in June 2007, then July 2007 and finally in Oct 2007. So a triple top. I am not sure if you could even compare the two in terms of similar characteristics but wanted to put that out there that perhaps the second chance has yet to come with RUS2000 having a triple top again.
So far this is a fairly orderly correction in which we have not seen waterfall declines. The way it is looking so far is that we should have another 1-2 weeks more correction. I am waiting for Capitulation which it hasn’t happened so far but we are getting closer. After that, then I believe we may be headed for the second chance in perhaps Oct. Wanted to put that out there that the second chance may still be lurking in the shadows but the first(and perhaps final) top happened a few weeks ago.
One thing is for sure, I remember in the amalgamator website days you had an uncanny ability to find picking that bottom within a few days back in 2011. I will be looking for that exceptional ability of yours to sniff that out again. 🙂 Thank you for all that you do. It is much appreciated. I have been waiting a long time for this and I think we are very close.
I wonder how many here go back to the amalgamator days. And I agree about John’s uncanny ability – he has just the right temperament for trading markets, which is very uncommon. Most people are far too emotional (including myself). That’s why I appreciate John’s skill in managing not only markets but himself.
Thank you both.
2007: June was the indicator extremes, then October the indicator divergences. Jan-July 2014 has seen similar progression in the indicators, which makes me lean to us being equiv to post Oct 2007. 2007/8 does indeed provide an example of the waterfall declines taking a while to hit, but the other analogs (and I’m giving more weight to the solar max market peaks) all show fairly swift panic selling, at least in the hot sectors and indices. Even 2007 showed sharp falls in the homebuilders sector fairly promptly. RUT, IBB and SOCL declines have been fairly measured so far, so I think it’s ripe to kick off at least in those, if not wider.
I think this could be the initial decline that should last until @ Aug 25th. Then a 2 or 3 week second chance.
Japan crashing joining global risk off. Good things come to those who wait. Following John’s Geo Magnetism chart which looks for some bottom around Tuesday? Still 3 trading days. USD/Yen targets 100.70 short-term. Thank you John for providing this educational site for like minded investors.
Appreciated
This is slightly off track but I believe investors really need to start taking a very hard look at silver.
Regardless if the following article is credible, silver at current prices is currently historically cheap compared to gold and aside from that it is just cheap period given its industrial applications.
Many silver miners are struggling to find economic deposits at current levels. If it were not for the fact that most silver production came from secondary. Mining sources then silver would be markedly higher than they are simply due to supply constraints. That is however changing as silver from secondary sources is declining.
Now if this article is correct and silver demand grows by 275% in the next 4 years then silver could rise by a factor of 5 or 6.
I don’t have to tell you what that would do to silver miners!
Something to think about……..
http://www.hardassetsinvestor.com/features/6115-silver-demand-from-3-new-technologies-to-grow-275-by-2018.html
Silver demand growing by 275% in next four years. Most importantly, until proven otherwise, it’s in a bear market. Industrial useage of silver has been flat since 2000. The demand for silver that caused it to rise from 2000 to 2011 was speculative demand, and even at that, they were calling coin industrial demand. So such a huge change is highly improbable. Silver institute.
There is no need to panic!!!
Can all retail investors form an orderly line and let the 1st class institutional passengers off this sinking ship first.
We promise you someone will be along soon to pull you out of the water.
Looks like that occult tip off by the IMF late July I pooh poohed was actually a genuine warning. I take it all back.
I suppose this was bound to drop given the surge, but how far will it fall 5% 10% – 50%
Looks like China had to seriously cook the books to stem panic.
http://www.zerohedge.com/news/2014-08-07/china-trade-balance-explodes-record-high-july-exports-double-expectations
Looks like market is oversold on many indicators to my eye. Obviously can become more oversold but have personally gone long here. Looking for SPX 2000+ in coming weeks.
Think the next high will be the ‘one’
“here. Looking for SPX 2000+ in coming weeks.” – seriously?
I thought it would hit 2000+ 3 weeks ago! But now looking at these ugly events I really can’t see it, under what basis do you see it reaching that level, considering it’s nearly 200% up since 2009.
I can only see trouble in the news…..
Obama issuing air strikes in Iraq
Russia banning food imports and possibly banning plans entering air space
WHO issued an international crisis regarding Embola
Putin about to invade ukraine
Albania at war
Obama and EU issuing more sanctions
HY credits in free fall
ISIS taking over Iraq
Hamas firing rockets again into Israel
FED tapering down and about to finish next month.
The list goes on and on…but I hope your right about the bounce as this will affect all our lives even if you do make a fortune on going short.
Dr. Brett Steenbarger has recently had a series of blogs on market indicators that are well worth reading:
http://traderfeed.blogspot.com/2014/08/the-bollinger-balance-tracking-stock.html
Viewing short-term market action through the prism of a calculated gamble, I believe we go up for the near future. Here are the reasons I think the market retests (and eventually fails at old highs):
1)200 week MA is still holding for the VIX.
2)DOW is holding support on 200 day MA.
3)S&P in a falling wedge pattern.
All in all, I expect (and am positioned now) for a rise to 1,950-1,970 on the S&P.
Medium and long-term I think long US equities will be a fool’s errand. Bonds, gold, and silver are the most attractive to me.
And I believe John will be proved correct in time– the demographic and extreme indicator research on here in unparalleled. Best to you all.
Rick L.
Thanks Rick
Any ideas where and when the DOW will bottom before the next great bull market starts?
My ideas on that are here:
https://solarcycles.net/2014/01/17/timing-major-market-peaks/
John, I saw your DOW projection in the above link. Your wave 1 down has a target around 8500 with an eventual bottom of 3500. I suspect the 6500 in 2009 would never be reached again. I think the multi decade flat period will end in the near future.
$NYADV:$NYDEC hooks…looks like a bottom is in…a strong follow through next week needed to confirm…
Bears don’t add to your short positions for now.
Hi john
Nice to see some of your work quoted by c e Christensen over at safe haven.com
Faith in capital markets collapses among professional investors
http://wolfstreet.com/2014/08/07/faith-in-markets-collapses-among-professional-investors/
Meanwhile, a hammer completes a weekly trend trade buy setup on SPX, sat right at on the lower parallel – http://scharts.co/1lJphXW
Warren Buffet’s Berkshire Hathaway often moves in lockstep with the SPX. On Friday it broke up from 3 month resistence. This market needs a correction but I think we head higher for now.
http://stockcharts.com/h-sc/ui?s=BRK/A
http://allstarcharts.com/buy-berkshire-hathaway/
… that does not mean the cracks are getting bigger. They are, as the article below shows. But the broader markets are always the last to get the message. FWIW, i think the Dow has topped. It broke down a key trendline going back to 2009. I think it puts in a lower high as it dragged up by the sp500 which hasnt broken any trendlines
http://allstarcharts.com/head-shoulders-top-regional-banks/
Lastly, whilst I think we make a lower high on Dow I don’t think this will happen on SPX. Just a single peak somewhere in the next month or so and a correction into November before a rally into Christmas.
John, you have created a wonderful site for many investors and traders to absorb your research. I hope its not too much longer before your rewards come along.
Just a few words about mastertiming/gann timing. My assumption is that important turns in the past give important possible turns in the future. So I analyzed the 20th century and found this wave structure : A low in 1903, a hIgh in 1929, a low in 1932, a high in 1966, a low in 1974 and a high in 2000. I know the 1973 high was slightly higher than the 1966 high, but I think 1966 was the orthodox high and now the dates are better spaced. I have some more recent dates as well.
From now on I will include this timing in my analysis. Master timing gave 2/3 and 7 august as timing. The S&P set a high on the 4th (monday morning) and a low on the 7th. So far so good. Next is aug 10. That’s today. That will bring a turn on monday (high).
Next dates : 14,18,21,23,23,27,28,28. You can see the clustered dates. Mastertiming can be off by one or two days. So dates that are close (2/3 and 27/28 and maybe 21/23) should be read as the same date.
I do believe that confluence in timing has significance. And the timing gives 2 heavy clusters around 21/23 and 27/28 while they both are within one week. So the last week of August will be special!
How does that fit with the tidal forecast? First the tides give the low for this wave around September 10th, with a high on aug 19th. So after the low Tuesday 12 Wallstreet will be in a retracement until the 19th. And after the 19th we will start the last leg down into September. That should bring volatility. I think that is what mastertiming indicates; lots of dates after the 20th, meaning a lot of confusion in the market.
The lunar trends I posted about earlier, show the cycle down from March is turning up in August. and will then be up into November, consistent with the yearly trend that is up from February. This suggests that the S&P still has one more leg up to do this year.
Gann’s financial time table indicates 2015 as a ‘panic year’ with low prices in 2016. This also suggests 2014 is a pivotal year – showing lots of divergences – and consistent with the 4 year lunar cycle (up sinds early 2010) that will peak in November. This confirms what McHugh is saying; a low in September and then leg E up before the jaws of death pattern is complete.
Both the bearmarkets of 2003 and 2007 were preceded by a multi year high in the long lunar cycle like the one we see in November.
Key message : the crash will come. But September will be important. Wouldn’t hurt to pay attention then and keep an open mind for one possible last leg up.
I don’t claim to be a better analyst than John, because I’m not. But this is what gravity is telling me.
Cheers,
André
P.s. Just can’t hide a smile. McHughs ‘Primary Trend indicator’ gave a buy in March 2010. Dr Bob thinks he created some pretty smart indicators. But all he does is show the lunar cycle, and he just doesn’t know. My lunar cycle gave a ‘buy’ in jan 2010. That was 2 months earlier. Amazing; isn’t it?
The helio/geo Bradley dates are yet another timing tool, based on planet/astro, so distinctly different from gravity and mastertiming.
The bradleys give for August : 5/8/18/21.
No matter what timing tool you use, the same dates keep coming up. There is order in this universe 😉
This site : http://www.astroadvisor.com/ gives turn days every weekend. For next week he gives Monday, Tuesday and Friday. That confirms the high on Monday, the low on Tuesday and the high on Friday.
thank you Andres. looking forward to your 2015 analysis. regarding Gann’s Financial Time Table – the “solved” version puts the market in a panic cycle until April 2015 but most likely by Jan. 2015 with a final low between Oct. 2015 and June 2017 (although could come in by April 2015- unlikely). GFTT then suggests an important high will be made in 2018.
Peggy,
My first impression is that 2018 will be very volatile with both a multi year lunar low and a multi year lunar high within less than a year. This is a very unusual pattern and I see it for the first time. Seems to indicate 2018 will be very special. But it also indicates markets could go down into 2018 to make a volatile recovery in what could be a new bull market. We can only speculate about what will happen. One scenario could be that essentially the whole world goes bankrupt. Current debt levels all over the world are higher than in 2007 and it is hard to imagine how this will all be payed back. So the system needs a reset. If this is the scenario, 2018 doesn’t seem a bad timing. But the moon is no crystal ball 😉
Look; this is what Keystone says ( http://thekeystonespeculator.blogspot.nl/ )
Traders are trained like Pavlov’s dog to buy stocks for the last six years without discretion due to the obscene central banker money printing. This philosophy is engrained in trader’s minds so the majority of traders simply view the world falling apart as a buying opportunity. Equity markets may set up for a potential crash if confidence is lost in the Fed, BOJ and other central bankers.
But we can see it’s just the moon. Once you realize this it becomes kind of amusing.