
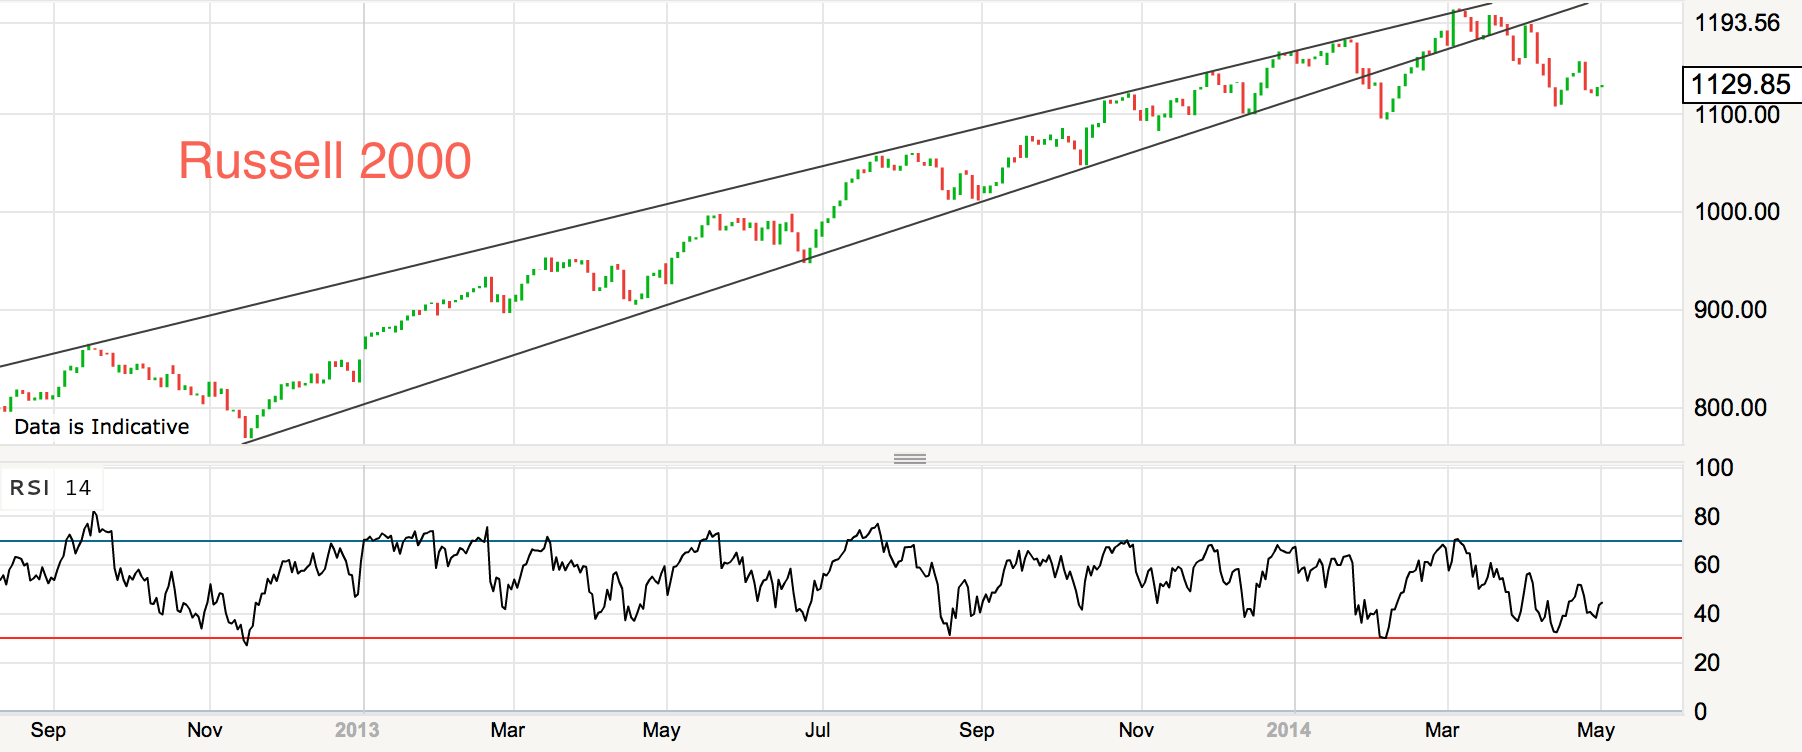
Speculation typically peaks out at solar cycle peaks. In 1989, the Nikkei was the speculative target reaching p/e>80 as it topped out at the solar cycle 22 peak. In 2000, the Nasdaq soared to p/e>80 as it topped out at the solar cycle 23 maximum. Now, at the current solar cycle 24 peak we see a broad range of historic topping valuations in equities but it is particularly the small caps that have been subjected and bid up to the extreme, as the trailing p/e for the Russell 2000 currently stands at >100.
Remove the companies with negative earnings, which is about 20% of them, and it would be 23, which is at the top of its historical pricing:

Source: Andrewunknown
Valuing by EBITDA, the R2K reached 10.8 in March, the highest since 1995.
Small caps are also at the top of their historical pricing relative to large caps:

Source: Alhambra
Similar historical rallies to 2013 in the R2k have been reversed in full the following year:

Source: Fat-Pitch
R2K current historic levitation is demonstrated here:

Source: Gordon T Long
Biotechs have been a key driver of the R2K outperformance, but their parabolic bubble looks to have popped:

Source: Alhambra
Along with Biotech, the Russell 2000 potentially topped at the turn of February into March:
 Lerverage also looks to have peaked out in February:

Source: DShort
Over the last 5 months, the collective performance of the four major US stock indices switched from uptrend to range:

Source: Stockcharts
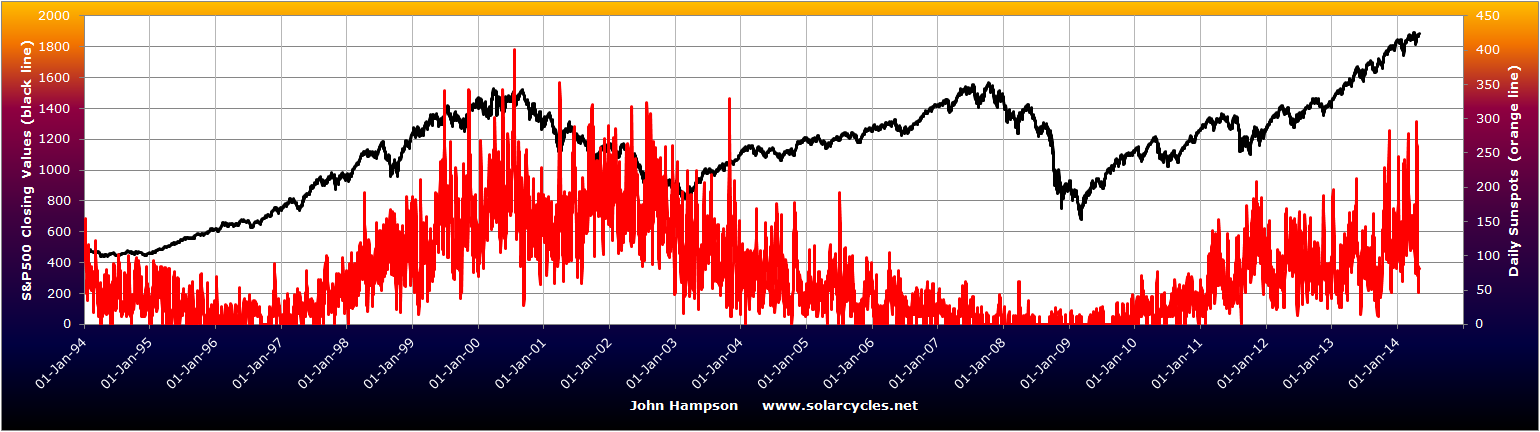
I believe this is a topping process aligned with the solar cycle topping, so let’s look at the updated solar charts.
My daily sunspots chart shows a higher high but a lower low in April:
The pole-switch progress has been oscillating around a trend that is now set to complete:
 Source: Leif Svalgaard
Nasa and Noaa models suggest the smoothed solar peak is behind us. Solen agree, suggesting a smoothed peak around December 2013. The below forecast aligns with that, whilst allowing for an April peak:

Source: Sunspotwatch
SIDC are still running with their two alternatives. The SC prediction aligns with that of solar cycle 16 progress, which SC24 has mirrored to date. The CM forecast predicts ongoing but plateauing strength into late 2014.

Source: SIDC
Previous speculation peaks occurred close to the smoothed solar maximum and on a spike in monthly sunspots. Aggregating the predictions, the smoothed solar maximum for SC24 is likely to have been at the turn of the year from 2013 into 2014, whilst the monthly sunspot spike so far was February 2014, with both March and April coming in lower.
As things stand, US equities broke out of their uptrend and into a range at the turn of the year and the R2K, Nasdaq, Biotech and momentum stocks all peaked out at the end of February. A February peak in margin debt is also supportive of a potential speculation peak having occurred.
I suggest chances are slim that equities resume an uptrend here following this price ranging, due to the 30 bearish indicators that I recently amassed, some of which are already overdue fulfilment by historic norms. We have a compelling cross-reference of stock market topping indicators (price clues) and solar cycle topping indicators (time clues) in the window of Dec 2013 to April 2014. I believe the Dow’s marginal new high yesterday will be shorted lived: a fake-out.
My biggest short remains the Russell 2000 and I have added to this today. It is the largest trading position I have ever had, so there’s my conviction. NFP Friday a likely market mover, and the start of the lunar negative period this weekend.
