
Thank you so much for all the messages of support – I was really touched to read them all. I had a burn out and now have to take things easy. I was working long days with the markets and doing too much of everything on top. So my posts will be less frequent for the foreseeable future, but as my focus is on the medium and long term, less intensive tracking may be no bad thing. I come back to the markets after a couple of weeks away and although price continues to frustrate, little has changed in the big picture. Some of my near term timings didn’t work out, but the overall case remains solidly bearish, and it’s a question of patiently waiting for price to fall in line.
Focusing on US stock indices, I have updated the bearish indicators and flags and added some new ones below:
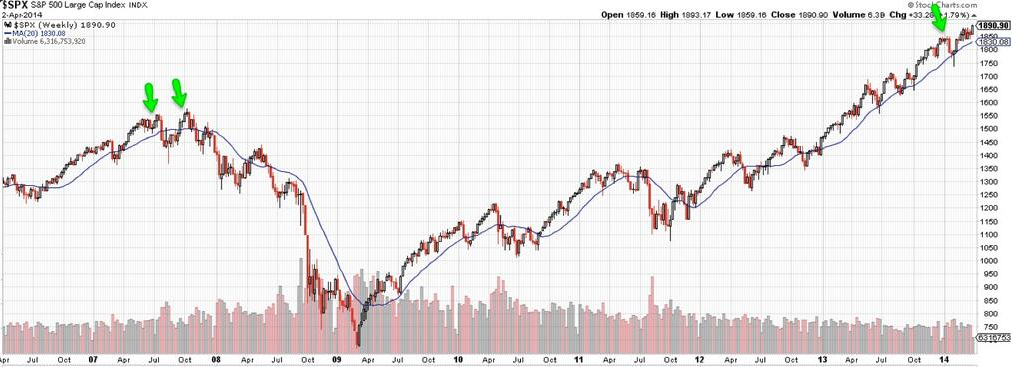
1. A 5-year bull trend only occurred once before, in the 1990s, and was followed by 3 down years
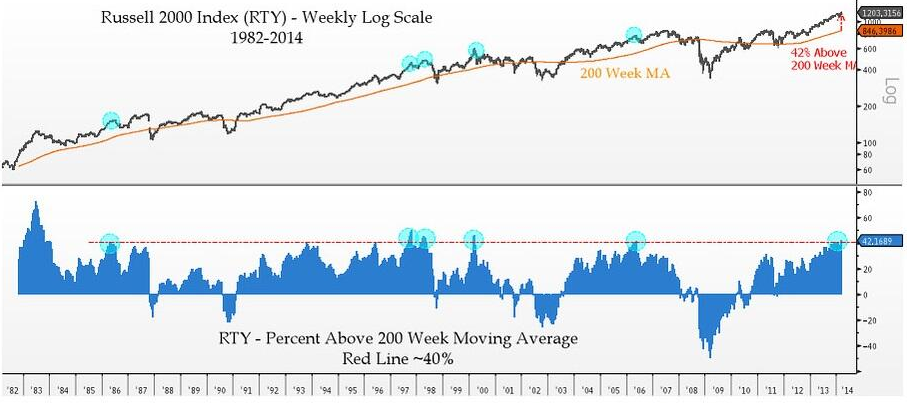
2. Historic levitation above longer term moving averages and lack of 10%+ correction since 2012
Source: Gordon T Long
3. Last 2 years rally in US stock indices has been made up of less than 20% earnings growth and more than 80% multiple expansion. The last 2 such occurrences in history were 1985:1986 (leading into 1987 crash) and 1997:1998 (leading into 1999 real Dow peak)
4. Compound annual growth rate in equities since 2009 was only exceeded in 1929, 1937, 1987 and 2000, all of which led to steep market declines
5. Crestmont P/E is the 3rd highest in history after 1999-2000 (market peak) and 1929 (market peak), and in 97th percentile
6. This is the 2nd highest market capitalistation to GDP valuation outside of 1999-2000 (market peak)
7. This is the 2nd highest Q ratio valuation in the last 100 years outside of 1999-2000 (market peak)
8. This is the 3rd highest CAPE valuation in the last 100 years outside of 1928-1929 (market peak) and 1999-2000 (market peak), and the US is the 4th highest CAPE valuation in the world currently.
9. Russell 2000 index p/e is currently 74.8; Russell 2000 to SP500 valuation differential at all time record
10. 84% of companies have offered negative earnings guidance for Q1 2014 so far; Last quarter’s revenue growth was the lowest since 2009
11. Skew is in elevated range for the last 6 months; Cluster of extreme Skew readings not seen since June 1990 before recession began July 1990
12. Put Call ratio 21 day average over the last several months has clustered in the extreme low zone that previously led to sharp corrections

13. Greedometer – aggregate of macroeconomic, fundamental and technical data – is at a record level exceeding the 2000 and 2007 market peaks
14. Citi Panic/Euphoria model at a level only exceeded into the 2000 peak:

Source: Fat-Pitch
15. NAAIM sentiment remains historically high
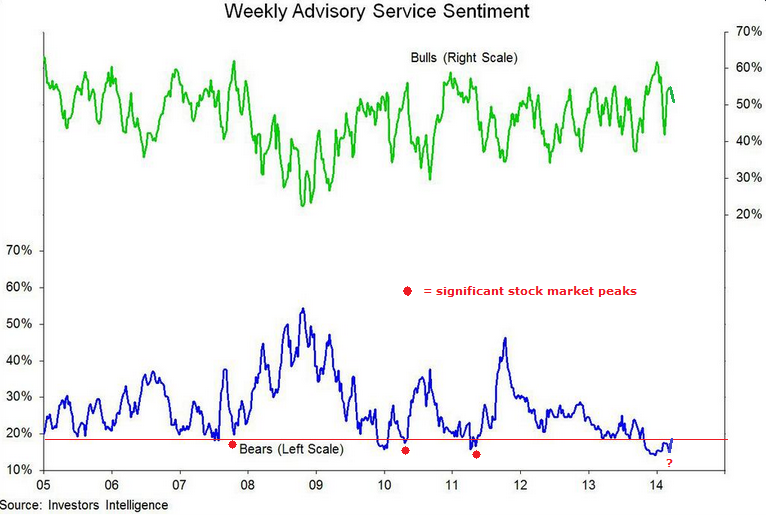
16. Investor Intelligence % bears levels and pattern similar to previous significant stock market peaks
17. Rydex bull ratio at extreme historic high
Source: Sentimentrader
18. Margin debt (updated for Feb 2014) is at an all-time record, both in nominal and real terms, and as a percentage of market cap; Net investor credit balances are at an all time low

Source: Dshort
19. IPOs with negative earnings at levels consistent with previous market peaks
20. Leveraged loan issuance at record, surge mirrors 2007 and 2011 important stock market peaks
21. High yield corporate bonds to 20+ year treasuries shows a divergence with the stock market that has previously marked tops
22. AAII equity allocations highest since June and Sep 2007 and Dec 2013
Source: UKarlewitz
23. Smart Money Flow Index shows siginificant divergence in 2014

Source: Todd Harrison
24. Biotech parabolic bubble breakdown
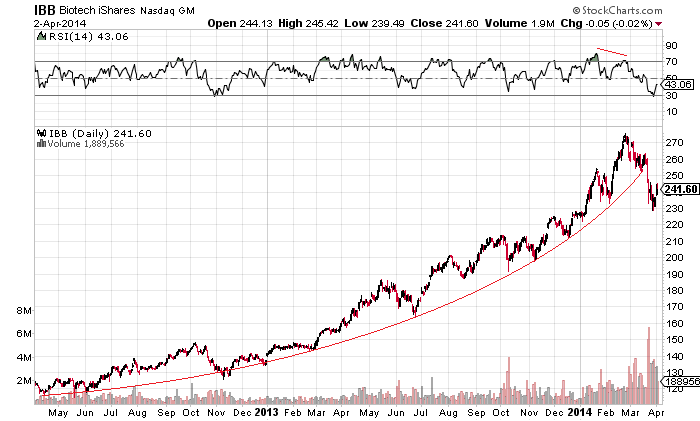
Source: Stockcharts
25. Wider momentum stocks breakdown

Source: Charlie Bilello
26. Leading indicators suggest global industrial output slowdown into a May trough, then a pick up into late summer
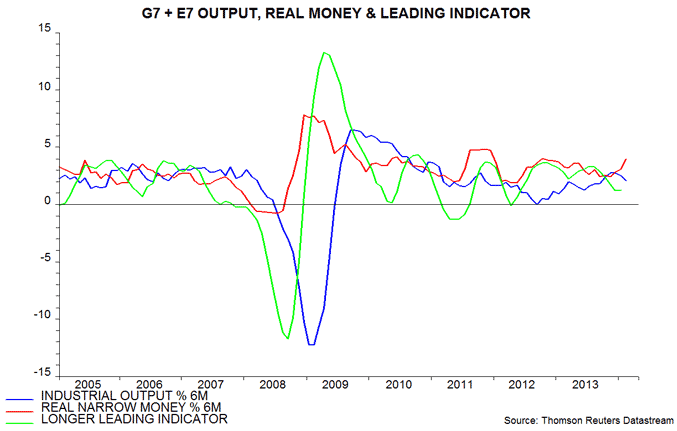
Source: MoneyMovesMarkets
27. Citi Economic Surprise Indices for major global regions all negative

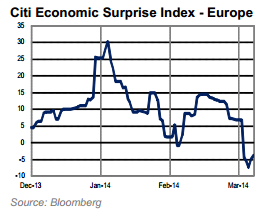
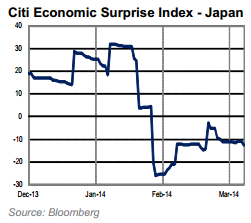
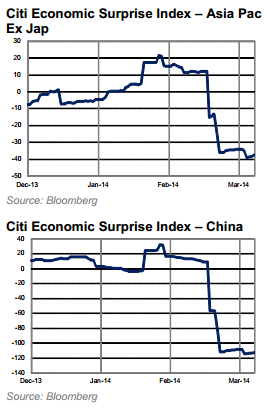 Source: Citigroup
28. Fund manager allocation to global equities is at levels that previously led to a market peak or correction
29. Percentage of stocks hitting new highs is thinning into current new SP500 highs

Source: Stockcharts
30. Six month breadth divergence in Nasdaq 100 in stocks above 200MA

Source: Stockcharts
31. VXN/VIX ratio is a risk-off current flag
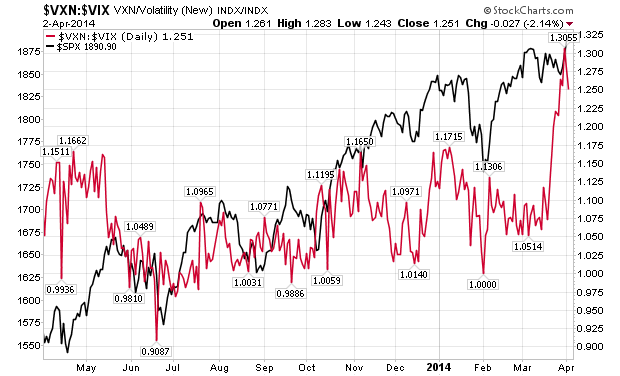
Source: Stockcharts
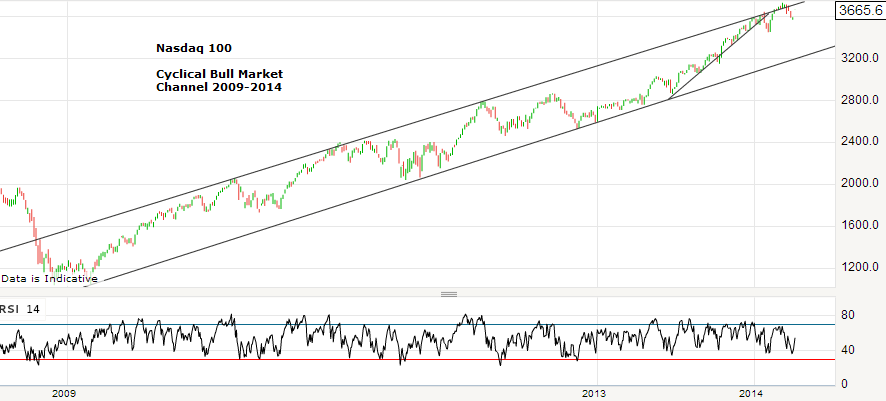
32. Nasdaq 100 made a fake-out from its cyclical bull channel in March
33. Best performing classes and sectors in Q1 2014 were commodities, treasuries and defensives
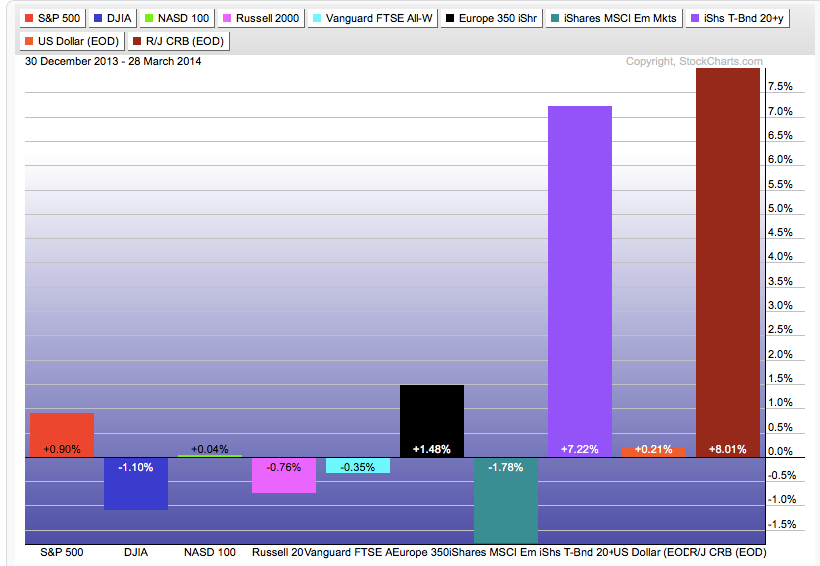

Source: Fat-Pitch
34. Late cyclical outperformance of commodities as equities top out consistent with 2000 and 2007 peaks
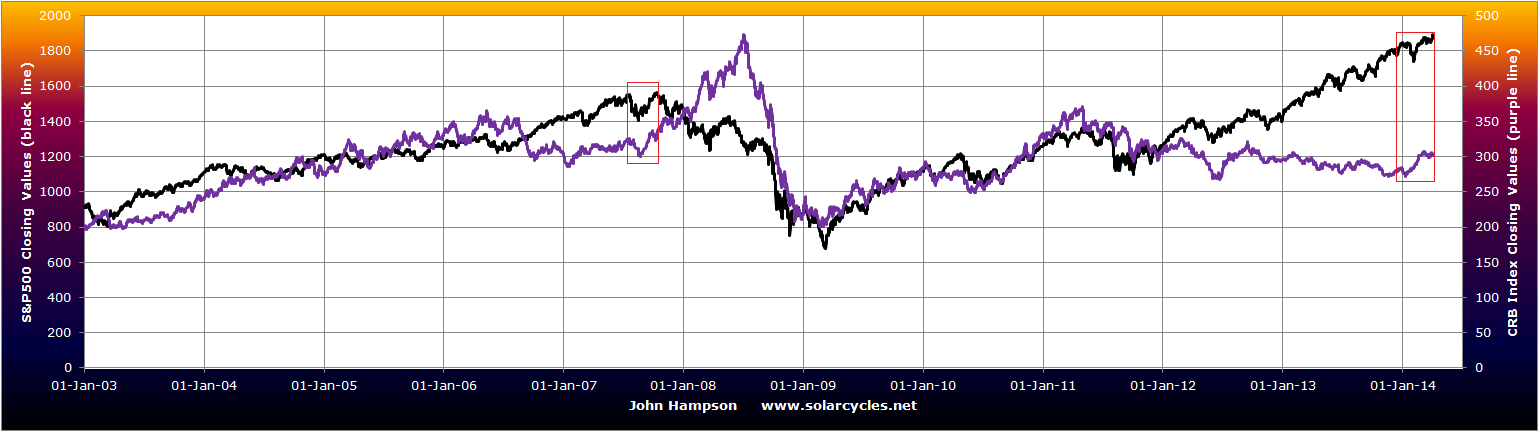
35. Winding down of QE historically negative for equities, positive for bonds and gold
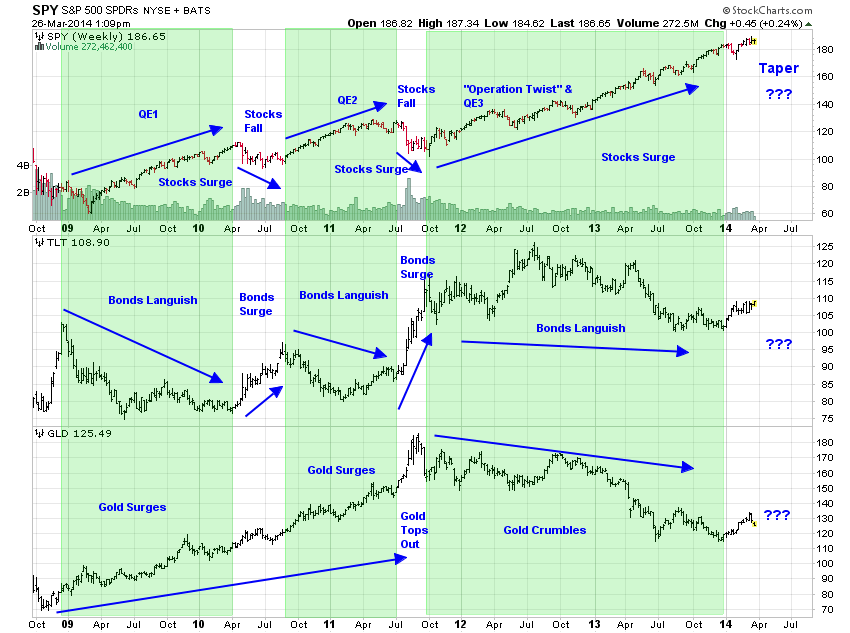
Source: Jesse Felder
36. Trading in penny stocks signalling a peak
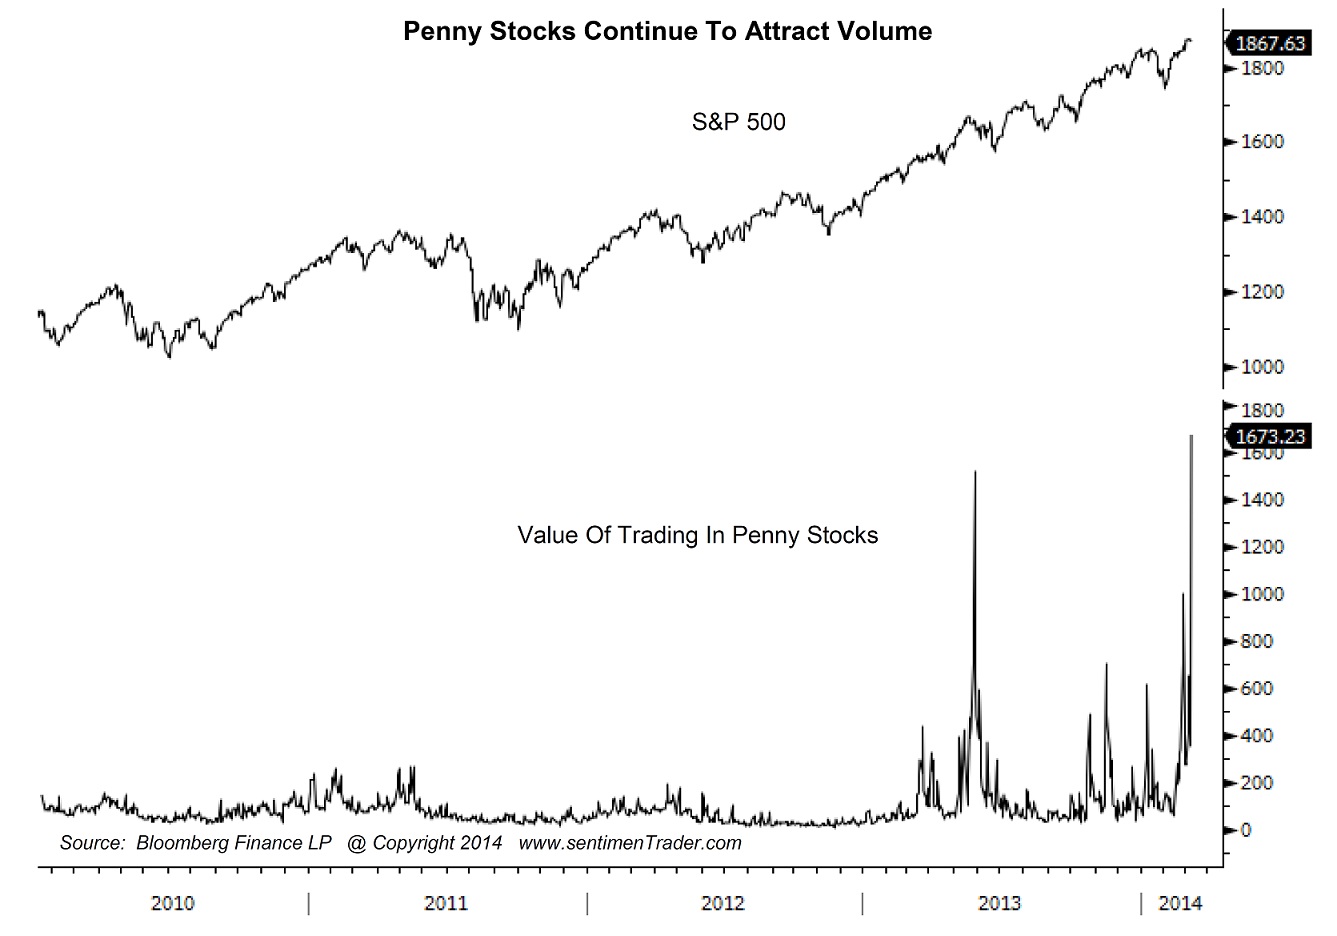
Source: Sentimentrader
37. Dow, FTSE and Nikkei are all at long term resistance levels (connecting 2000 and 2007 peaks)
38. Treasury Bond Yields Rate Of Change over last 12 months is at a level that previously led to market tops in 2000 and 2007
39. Rydex money market assets back to 1999 lows
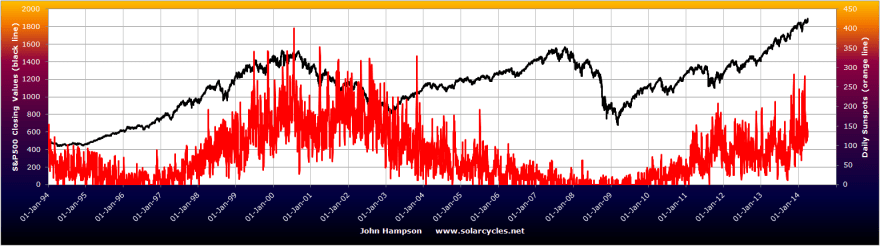
40. Equities topping out with the solar maximum, in line with history

Underlying Source: Solen.info
A 40-indicator case is a fairly strong case to go short. But we need to balance with what’s supporting the bullish case.
Cyclical stocks have broken out upwards over the last week. The cumulative advance-declines breadth measure remains in an uptrend, supporting the advance in equities. Euro Stoxx broke out to a new high. Gold and gold miners have pulled back in March, with gold having failed to hold a break out above the first meaningful resistance level:
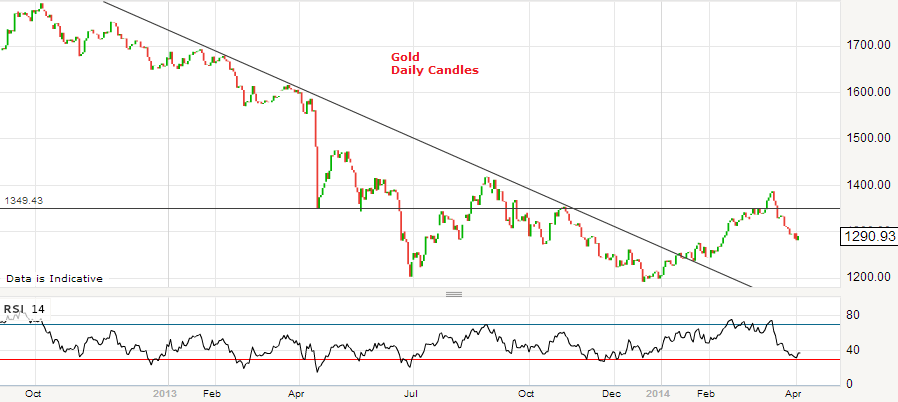
The question is whether a higher low can now be made in gold, to continue the bottoming process.
Margin debt, for which we have data up to the end of February, did not yet top out. I had initially expected margin debt to top out in December with an anticipated highest monthly sunspots spike at that time. However, a higher monthly sunspot spike in February suggests speculation could have topped out as we moved into March instead. We have thus far seen peaks in the Russell 2000, Nasdaq and Biotech in March, and we saw a lower monthly sunspot spike in March than in February. The consensus view is that the smoothed solar maximum for SC24 already passed at the turn of the year and that sunspots should decline from here. However, SIDC are still running a second alternative whereby a smoothed solar peak still lies ahead in H2 2014:

Source: SIDC
Playing to that possibility is the trend in leading indicators noted above. If stocks can hold up whilst economic data starts to improve again as of May then may be they can rally through to the Fall. On the flip side, we should have another month of disappointing data right ahead which could equally pull the rug from under equities. Were the second SIDC scenario to occur then I would expect speculation not to top out until the Fall, and a suitable technical mirror from history may be 1987 whereby sentiment reached record levels in Q1 1987 but stocks did not fall hard until Q3. But for now, the more probable scenario is of a smoothed solar maximum having passed and speculation declining from here, and for this to be confirmed I would be looking to see that the RUT and Nasdaq indices do not make a higher high from here, and that margin debt tops out. Sunspots should also notably trend down as we head into mid-year to confirm this.

There have been a concentration of market falls occurring in the inverted geomagnetism seasonal lows of March-April and October. So again taking that primary scenario of sunspots now on the wane, I look to this new month of April to deliver major falls in equities, in line with the Nasdaq in 2000 (smoothed solar max and sunspot spike March 2000). Presidential cycles in the market suggest stocks could eek out further gains in the first part of April before falling for a period of weeks. DeMark also believes a top is within days but suggests the SP500 could reach 1931 before inverting.
The primary scenario of a smoothed solar maximum having occurred in December 2013 and a highest monthly sunspot spike in Feb 2014 is supported by a chain of events to date: Bitcoin peaked in Dec, Nikkei and Dow (very tentative at the time of writing) peaked and money flows switched into defensives at the turn of the year, the ‘theme’ stock indices and sectors of the cyclical bull exuberance phase peaked out Feb-Mar 2014. But this is all subject to confirmation or invalidation. So let’s see how April develops. I remain significantly short equities, and siginificantly long precious metals, with other smaller positions long commodities. My worst case scenario is the continuation of speculation into late summer before Q3 falls in equties, and I would hold my positioning until then if so. But for now this is the outside scenario, and I maintain good odds of April delivering significant falls in equities, and momentum returning to gold with a higher low.
Thank you for all your input whilst I was away.

Great to see you back John
^.^
Welcome back John.Great to have you back.
John, very nice to have you back –
Thanks John. You take it easy. This is probably the most manipulated financial market ever and a lot of the previous predictive models that worked quite well are no longer producing the goods. How long this manipulation can distort the market is an interesting question. Certainly the ‘turn’ is overdue unless the financial markets have experienced some kind of phase change that have altered it’s structure. The markets are more controlled now by technology.
>
j.burns…….tell me you are NOT saying this time is different??
Welcome back John.
That is one hell of a list!
Just 10 of any of them would be justification to be cautious let alone 40.
Its a worry when you say there has only been ONE 5 year bull market.
You’re either very young or very ignorant.
John is neither but you are very arrogant.
It is such an embarrassment to use Voltaire as username as one reads “bull trend” as “bull market”.
thanks john
Nice to see you again, John. Sincerely.
@apanalis
Voltaire, the community here won’t stand for name calling or arrogance. If you disagree with something John has written, present the facts and leave it at that. But, please, none of this disrespectful, insulting tone….
Well said in a proper manner.
does any of this matter if the fed keeps the money pump on.
isn’t the only relevant question “how long can the fed keep the money pump on for?”
George it is a question of whether deflationary influences take hold not about whether the Fed is stimulating.
When deflation becomes the main driver it does not matter how much or how fast the Fed pump, deflation has the capacity to overwhelm anything the combined efforts of every Central Bank on the globe can put together.
The reason QE1 eventually worked was because markets exhausted their downside. Pure and simply the bottom was hit. All the Fed et’al have succeeded in doing is inflating another bubble.
Welcome back John, glad to hear you are feeling better today. You can tell what a huge fan base you have from all the recent messages! Even though I dont normally comment at all, I religiously read your email updates and it seems so does half the world! Stay healthy and dont forget your diet and exercise…
John, health is wealth, great to have you back. Warmest regards, Kevin
Reblogged this on thedarklordblog and commented:
Nice work John.
The UBS team see a minor top just ahead.
I see the 1737 pivot as the game changer FWIW.
John, if CMEs keep missing the earth like it had in the past week, will the peak be delayed. In other words, can we keep blaming the “weather”?
The lack of significant pick up in real geomagnetism is one concern to me.
But there is 1 reason that dismisses all those valid and logical 40 reasons.
The market can remain irrational longer than you can remain solvent…lol
Bienvenido John !
Grand to see you back. Be Well
Hi John,
Welcome back John, take good care of yourself!
Here is some info, http://www.cbsnews.com/news/major-solar-flare-erupts-from-the-sun/.
http://stockcharts.com/h-sc/ui?s=SPY&p=1&yr=0&mn=0&dy=2&id=p61920460201&a=285391858&r=1396534855344&cmd=print
http://stockcharts.com/h-sc/ui?s=SPY&p=1&yr=0&mn=0&dy=2&id=p39955090704&a=285391858&r=1396536114040&cmd=print
stockcharts is crashed so data lost
what i had wanted to show was that at the 18844 low an indicator stack set up on my 5 min chart that from my archived records reverses price 75% of time…
here it is
http://stockcharts.com/h-sc/ui?s=SPY&p=5&yr=0&mn=0&dy=7&id=p24061900359&a=326440910&r=1396541471834&cmd=print
Sorry: couldn’t resist.
John welcome back, and thank you for all the work and research you do! I learn something new here every time you post.
I enjoy reading the posts and comments here as it reminds myself of the dangers of investor/trader bias and having ( or lack of ) a trading system and time frame that matches reward and risk. There are multiple time frames, and conditions, and an actual trade trigger to go long or short based on price action. I think getting time frames confused, and not setting stops relevant to the time frame, volatility and personal risks can be extremely frustrating and dangerous !
As for the “age of the bull”…that was described in 2013 here http://goo.gl/0AX2uw by Barrons and here in 2014 by the WSJ http://goo.gl/nX3plv. Certainly the last 5 year bull in recent memory was the nineties.
April will be an interesting month, from an astrology, solar, technical and earnings viewpoint, trick is to know when to go long or short and a trading system. Here are more calls about April http://goo.gl/PLDWi6….whether you trade via Gann or channels… April sounds profitable !!
Best wishes to all!
Great stuff all round John!
Take it easy now.
Big thanks
John,
welcome back.
I think a big peice of puzzle is central back liquidity pumping. And its all the central bank. all other condition would get overriden by that. It might top at higher level. Would like to see your thoughts on that.
bill — Those of us who own BIS and TZA (check out their charts) know the market has already started to break down, but that fact is being hidden from the public by ever-increasing headline (major stock index) numbers. Market leadership is dwindling (market is being held up by fewer and fewer stocks), which is always a prelude to a serious correction.
People mistakenly think central bank money printing will keep the stock market rising forever. The stock market won’t keep rising forever because the stock market is designed to harvest paper gains (and losses, if you don’t cover shorts) at regular intervals, to keep the public from making money in stocks. As I explain to clients, the stock market was not created to fund businesses, as is mistakenly believed. It was created (and continues to function) as a wealth transfer apparatus. How and why that is accomplished is beyond the scope of a blog post, but believe me when I say it isn’t hard to prove. Case in point: “Tapering” is not being embarked on because the Fed and U.S. government believe the U.S. economy is recovering. They’re not stupid, and they believe no such thing. It’s being done in order to contract liquidity and crash the stock market. I hate to be the one to break the bad news to people if they’re unaware, but stock market crashes are planned well in advance and executed with military precision.
Are you saying the market is rigged?
AMEN!… my mom ,a lifelong speculator, sat me down 53 years ago when I was 11 and said the same thing!
D.J. ,
I totally agree w/ this observation. I had asked u this in the Demographics & Secular Bull Markets thread about this, im not sure if youve seen it. You claim gold will transition itself back into the monetary system near its stop at 10k-20k estimate. But you need the fear of retail to bid it that high. Why exactly should it transition into the system at its peak. The crowd can never be right. Can you elaborate on the mechanics? Im not seeing how retail will get fleeced by the few who coordinate , w/ gold transitioning into a new currency regime at its top?
D.J., thanks for the post, agreed. ‘They’ will start sheep shearing when it is time to complete the current phase of wealth transfer, after sucking in a certain level of wealth from the public, e.g. 401k.
DJ. I agree 100% of what you said. Very few people understand this.
Thanks DJ. I will like to hear more about your thoughts. when you say plan ahead of time how do you come to this conclusion. On other hand ES can go down from here or as per some other guys it can go all the way up to 3200 and then crash. when its at peak ES would be moving 50 to 100 point a day. There should not be any bear calls. as of today there is some one every day on cnbc calling 30 percent correction.
In other words whats your edge that says it needs to go down now or the gov has planned for crash. Draghi and Yellen both promised more support if we are weak from here.
DJ,
I’m with you mate. I have witnessed conversations with powerbrokers, read information and seen things that tells me that these guys are smarter than a lot of people take them for.
1% controls 99% for sure
D.J. In the last ten years I have probably learn’t one or two useful things about investing and discarded most of the rest. An important one is that there is no even playing field – markets must be rigged by the stronger hands. If I was the Fed I would want commodities suppressed while I pumped up the shares of main players who elected me – they succeeded.
I think they hoped employment would improve, but in the end using ‘democracy’ the deep state can apportion blame and simply dispense with one lot of clowns to put in another – which keeps the baying mob happy. (I often refer to ‘Deadwood’ for political knowledge). At some point the S&P edifice will tip over – attributed to some newsworthy event I suppose, after those who pushed it have taken their profits – for me hopefully it happens soon. More than that I don’t know, but I like what you say and would like to hear more of your ideas.
Take it easy man. I think the markets may still go up a bit or more. Don’t force.
“03/31/2014 In the next two weeks, I expect the indices to make a strong move upward, after breaking out of their congestion regions” Bulkowski
http://stockcharts.com/h-sc/ui?s=SPY&p=1&yr=0&mn=0&dy=2&id=p61920460201&a=285391858&r=1396550707816&cmd=print
Slater, how will you scale/add to your trade (in terms of size) if in fact the top becomes THE TOP? That’s not clear to me.
G- I said a while back what I was looking for to push all in with an outsized position… So far not in place….currently I have to add to the consideration that my health is so bad that I have resigned myself to just trading normal position size on all signals to make a living as opposed to trying to catch the big trade.
i.e. I make what I need just trading:just showing entry techniques for those trying to enter for the big trade with as little risk as possible.
http://stockcharts.com/h-sc/ui?s=DIA&p=5&yr=0&mn=0&dy=3&id=p85149989337&a=326440397&r=1396554564572&cmd=print
Slater, hope your health gets better, re your CHART on DIA where is your X on chart tnx stay well…
I think i figured it out………………????
John, I have been reading your blog for about 2 years, and just started to post most recently. It is good to see you back, be well and take care of yourself.
I also posted this in the older Demographics & Secular Bull Markets thread. I’m not sure if you folks have seen it. Id love to get John and everyone else’s feedback on this:
Has anyone on this site followed Harry Dent over the years?
Ive just began to read up on this guy w/o actually reading his books. It looks like he bases his projections on demographics but from what ive gathered he expected demographics to peak in 2010 , in contrast to John’s 2000 demographic top. So based on his books’ synopsis he was all for a demographic bull starting in the early 90s but kept rooting for it to catapult even higher past 2000 all the way to the yr 2010. After 2000 Thats when everyone blasted him and called him a quack as he kept calling for a 2010 top. Then near the dow bottom right around 2010, just where he said demographics should peak he has pretty much aligned his views with John’s. Im curious to know what demographic parameters he was basing his 2010 demographic peak on, that diverge heavily from John’s at the peak but converge at the nadir at about the same time.
He’s perhaps the most well-known demographic modeller, but I believe he is a salesman.
You take care of yourself. Quality is always better than quantity (in fact, too much of a good thing can even work against you in that repetitiveness can lead to boredom).
There’s no doubt that yours is quality, and that made a little more scarce will make it even more valuable!
That’s not to say that critical and timely updates won’t be welcomed when conditions call for them though!!! Or course, with a mid to long term time horizon, those would be few and far between. 😉
Do you have an e-mail notification service available?
Thanks again for all your great analysis and do be good to yourself – without your health, you’ve got nothing.
John,
Welcome back fella. I’m sure the hordes have missed you, as have I.
While you provide an absolute outstanding service, we all would want to ensure that you, importantly, take care of yourself first.
Kind regards,
Mat (Aus)
Glad to see you back! Take it easy, John
My baby cycle works seem to point 4/15-4/20 the time to get out.
Yeaa, welcome back, John!
The Biotech sector and small caps performed poorly today. The biotech index has a very bearish flag and the stage is set for another sell off.
The market rally is now eeking out smaller gains on the back of ever decreasing stocks. This market may be at new highs but it is growing more sick by the day.
Most market participants are being hoodwinked here by being led to believe that new, much higher highs are coming and yet they fail to see that what drove this market is now collapsing.
http://stockcharts.com/h-sc/ui?s=$NBI&p=D&b=5&g=0&id=p16648395594
http://stockcharts.com/h-sc/ui?s=$RUT&p=D&b=5&g=0&id=p45457653328
And if the biggest online retailer in the world is sick then what doesthat say?
AMZN’s daily and weekly charts are………horrible.
The weekly needs to find support here or it’s a big SAYONARA.
Having already broken and back tested the lower long term trend I’d say it’s game over.
http://stockcharts.com/h-sc/ui?s=AMZN&p=D&b=5&g=0&id=p17916168699
http://stockcharts.com/h-sc/ui?s=AMZN&p=W&b=5&g=0&id=p31529666460
From Financial Sense:
The market has a tendency to correct during mid-term election years, with the bottom referred to as the four-year cycle low. Typically, the weakest periods during a mid-term election year are the second and third quarters. Shown below is the market’s current percent change (black line) along with three different averages. One average looks at the last mid-term election years during secular bull markets (2010, 1998, 1994, 1990, 1986, 1982), and is shown in green, while another shows the average election cycle during secular bear market years (2006, 2002, 1978,1974), and is shown in red. The average of all years is shown in blue. The overall average (blue line) and the secular bull market average (green), suggest a market peak between now and the end of April before bottoming in the summer and setting the stage for a fall rally.
Careful with data dredged charts.
Its highly probable that 2010 is not part of a secular bull market, cyclical bull yes but not secular. There’s way too much convolution to use the averages taken to make inference:
Gary wrote:
With regards to Merriman, he has a rather provocative astrological forecast:
“Everything is escalating to the March 29-April 25 period, which may be the most intense planetary pattern of a lifetime. It doesn’t mean a specific event happens then, but it could. It could also be a very profound decision made by one of several government or banking leaders, the consequences of which may not be known right away. The last time anything remotely this powerful occurred was in late July-early August 2010. At that time, the Federal Reserve Board made the decision to not end its quantitative easing program, but instead expand it into QE2. It changed the entire financial world.”
I am not a person with knowledge of these things, but apparently what he’s referring to is the Grand Cardinal Cross, which has significant meaning for astrologers.
================================================================
After reading “Babylon’s Banksters” one is almost compelled to consider such events and not dismiss them out of hand. Robert Grover in “Time and Money: The Economy and the Planets” pointed out that the same combination of planetary aspects occurred during the first American Great Depression of the 1780’s, and also in the depression of the 1870’s, and the 1930’s.
For further discussion there is this post which appeared on a public blog this morning.
================================================================
Data: April 15, 2014 @ 3:43 A.M. EDT – Washington, D.C.
The Lunar Eclipse falls into the country’s 8th house, the area in the lives of the citizens that governs the treasury, national debt, financial organizations such as the banking industry; the nation’s mortality rates, financial affairs with the nation’s 7th house allies or enemies. These are the matters that will be front and center.
The eclipse occurs in the sign Libra, corresponding with social issues. A crisis erupting with an eclipse in Libra may involve division, abuse, and circumstances affecting other countries. As the Moon rules the Cancer 6th house of the eclipse chart, look for problems also with service workers, police and firefighters, civil service and public servants, armed forces, public health, and the working class in general.
In the chart for the United States of America this eclipse falls into the 10th house – the executive branch – and squares Pluto posited in the 2nd house of the financial state of the nation and its purchasing power. The head of state will act compulsively and become involved in emotional power struggles that will affect the nation’s wealth…to its detriment.
================================================================
I need to point out that I am NOT an astrologer; although I have spent many years attempting to find astronomical correlations to speculative markets. I also do not believe in birth charts; as signs of predestination. Hope this is not too off-topic.
John, So glad to hear that you are home with Gabbi and the kids. From the pics you shared on your whirl wind travels you have a beautiful family. So heed your own advice. These things normally pay us a visit two to three times. Time to rest and build strength.
I take issue with your most recent post in two very big ways. First, I hope it will be less frequent because this post is certainly not less intense. Gabbi if you are reading this try pooling ideas from readers here for various techniques in tying restraints. Listen to Gabbi John… Second, if you are going to break your first rule right out of the gate why the hell didn’t you then include the correlation of the markets to earthquakes. We had a 7.something in Chile yesterday. Maybe your post was up before the quake and we can lend a little slack but the timing is suspicious John. So c’mon! Every indicator under the sun and no earth quake correlation? LOL (Please don’t run off and research this…I can see the chart now).
And finally, I’ve said it privately but let me say it publicly. Your work is affirmed in my mind. The timing of the turns and the price action came right on time. Not to mention the call on commodities and your brilliant demographic work. Sunspots and other disturbances aside, it was a pretty tall order to anticipate a waterfall event on schedule, not a tall order to anticipate one eventually, but unraveling the calculus of the Sun is akin to entering the deepest chambers of the cognoscenti. Mirra Alfassa describes some very intense experiences in her yoga journals where she travels deep within the core. The rest of us for the time being, are relegated to acting and working on the peripheral. So, we miss what’s operating beneath the surface. True for the markets, true for our own affairs, and true for our relationships. Sometimes we just need to step back and listen.
Oh! And did you hear me? Your work is affirmed. All that needs doing is some refinement and adjustment. Let it evolve and allow yourself to celebrate what’s been accomplished thus far. This business is not about being right or wrong the way I think about it. It’s about seeing market movements and flows that for most of the time happen gradually. This is what most amazes me about your work. I too do my best at timing, but have come to respect the Indeterminate.
Keep up the great work… but more slowly for a time…
HVA
Well markets may be looking ill by some metrics,
however they still continue higher for now.
The chances of some sort of 10% plus correction in 2014
are high, as ever there are no guarantees.
The beginnings of a new bear market look to be
postponed until at least 2015.
The big tell(for me) was the market action following the last FOMC
meeting, very clear taper on but markets hardly flinched.
at each new high if the algo sets up, in the context of John’s work,, putting the short on with a tight stop, in this case risk 10 cents….
http://stockcharts.com/h-sc/ui?s=DIA&p=5&yr=0&mn=0&dy=3&id=p81029976271&a=326440397&r=1396624606727&cmd=print
http://stockcharts.com/h-sc/ui?s=$SPX&p=5&yr=0&mn=0&dy=2&id=p35517568911&a=338320968&r=1396625802453&cmd=print
supporting the sell signal in the other two indexes were rare overlapping red line green sets ( my second favorite entry)in FAS
note! IF!!!!!! price can break all this short term geometry… this may be the start of the big one…
http://stockcharts.com/h-sc/ui?s=FAS&p=5&yr=0&mn=0&dy=3&id=p14940045319&a=326440957&r=1396627354715&cmd=print
this is my last post… I hope you have all come to see the value of having the patience to wait for the algo’s to set up to enter you trade . good trading. slater 9
Wish you well slater9 . . Thanks for all you have shared here and particularly the way you stepped up in John’s absence.
Why your last post………….hope its not your health ……………….all appreciate your experience
Yes, Slater, I hope it’s not due to health reasons. We will miss you and the opportunity to learn more from your techniques. Regardless, thank you for sharing generously.
The P&F spot gold chart presents some interesting “reading”:
http://stockcharts.com/def/servlet/SC.pnf?chart=$GOLD,PLUBDANRBO%5BPA%5D%5BD%5D%5BF1!3!10.0!!2!20%5D&pref=G
Well if I were a bettin man I’d say the momentum is now fair and square on the bear side.
This is going to spook the hell out of a great deal of traders.I really can’t see the market recovering too soon from this. There has been a huge amount of technical damage done here on top of what was already a market growing more fragile by the day.
Allan, firstly congrats if your short position is beginning to pay
and for holding this when the DJI broken through the December high.
If I can ask in terms of your above comment re traders panicking,
why would this be the case now when it did appear
to happen in the earlier 6% January pullback?.
– my own view is that it may take 9-10% plus before
that could happen on an eventful scale.
If we are still falling next week then this becomes (at last) interesting
and my decision to go heavily in to cash may begin to look better.
Allan, nice call staying bearish – as I have said to John privately one element I felt has been lacking in a major top scenario was some indication of stress in the credit markets. That still is not the case —
From my Twitter stream: So far exactly ZERO evidence that corp. bond mkt cares about what’s happening in stks. Lrg US fins CDS making new lows again
Market now in fast downward move to at least Oct’13 lows (SPX 1630-1670 zone).
I previously thought this zone might be the bottom and then attack to new highs would follow. But the fact that SPX and DJI made new highs yesterday changed my view of the market for even more bearish. It makes me to believe all-out crash to SPX 1350 is in the cards. How we get there is however entirely unpredictable now. I will not play any bounces in that move.
I tend to favor your new analysis as well, Bunell, but I’m looking for more downside, most likely to the 38.2% Fibonacci level (which would be about SPX 1172, if SPX 1897 holds as the top). I expect it to be a swift, waterfall-like decline, in line with John’s work and Erik Swarts’ 1946 fractal analog. DeMark is looking for SPX 1931 as the top, in which case a 38.2% Fib retrace would equate to SPX 1193 or so.
Market internals continue to break down, as evidenced by the higher highs and higher lows being made in BIS, TZA, and SQQQ. The countdown to a crash has clearly begun.
To those who asked me to elaborate on my previous post above, I’ll be happy to do so when I get the time.
by when do you think we reach there…dont you think everybody is protected with cheap puts
John, you deserve a garland!
Good article on the VIX curve, plus to my point above about the state of credit markets.
http://www.minyanville.com/business-news/markets/articles/bonds-junk-bonds-jnk-corporate-bond/6/3/2013/id/50127?utm_source=hootsuite&utm_campaign=hootsuite&refresh=1
Please note the date of the article in June 2013; however similar conditions apply to today’s market environment.
Gold top was 1923 and fell to 1100s with a thud. I am wondering if S&P is setting for a similar landing.
Off topic but an interesting comment on HFT from the FT. I’m no expert – but this rings true:
Whats galling about HFT is that:
1. Its not your broker profiting from your order, so there’s no ‘reflected benefit’ to you, such as the broker really working hard for you when you really need it.. (i’m not talking entertainment budget here) this is the key to a relationship.. liquidity is simple in good times, but you can lose a lot more when it goes in your face on one occasion than you save in 1000 good trades.
2. The exchanges are complicit.. they get paid on volume, and HFT adds volume to the total transaction flow.. note volume, not liquidity. So they are happy to give that extra info especially when paid for faster data.
3. The ability to fake the order book with orders that are not real (because you have faster connections, you can guarantee they will never be executed) means that the process of price discovery is fatally flawed. If you want to play games ( submitting sell orders to drive the price down when you are a buyer is nothing new), you need to have some risk of being caught out. HFT by virtue (!) of their relationship with the exchanges are guaranteed never to get filled on their fakes, but still have the fakes influence the market price. This is wrong on so many levels..
The argument that its an arms race and its up to everyone else to catch up has validity.. but the whole point of law & regulated markets is to level the playing field in a reasonable manner. Its not dog-eat-dog anarchy on the streets because we ask task society to act against the mugger with the baseball bat.. but we allow the better run factory to take business from the worse run one.
HFT in my opinion is the mugger with the baseball bat and police protection.
Glad to see you back in health . You were in my prayers.
Great to know your are okay.
Go out and enjoy springtime in alps.
Markets will be there another day.
take care,
P.
http://www.distressedvolatility.com/2014/04/nasa-expects-sunspot-cycle-to-dip-in.html
https://www.youtube.com/channel/UCTiL1q9YbrVam5nP2xzFTWQ
I could be completely wrong, however I still can’t believe, given the evidence, that many analysts and investors are still holding on to the notion that higher highs are probable.
This chart says totally the opposite and is as far as I can tell the ugliest daily chart this market has produced since 2009.
http://stockcharts.com/h-sc/ui?s=QQQ&p=D&b=5&g=0&id=p12434130330
Welcome back John.
I agree with the others who suggest you take it easy.
Guided in part by your work I am now ‘loaded for bear’. I do think the bear may be kept at bay, even into October, but I have no doubt that the essence of your work will be affirmed. I continue to watch and trade as opportunity arises but with much less urgency and much less worry.
Welcome back John. And thank you again for another great article.
Someone earlier asked about Dr. Robert McHugh’s analysis and his book “The Coming Economic Ice Age”. Isn’t it interesting that it will likely correlate with the coming global cooling into the next solar minimum.
I subcribe to his newsletter and will exert what he feels will be happening in the short and intermediate term. Here is his update for today, April 7.
“Today’s U.S. Blue Chip Stock Market Comments:
Call me crazy, certainly the sharp reversals down and up since early March have made me feel crazy at times, however, enough pattern has developed to paint a clear picture of overlapping waves, sideways in the Blue Chips, and declining in the NDX and RUT, to tell us this is most likely a corrective pause within a larger degree rising trend. What it means is stocks are likely to bottom over the next week or so, and then rise sharply. New major declining trends occur impulsively where waves do not overlap, do not move back and forth, up and down, but rather occur with dramatic giddy up and go. The decline the past two days does have some impulsive character to it, however there was no sharp rally out of the overlapping pattern before it occurred, which means the past few days is probably one of the final moves within the corrective overlapping pause pattern. These final waves can appear impulsive. This is what I believe is likely occurring.
Our short-term blue chip key trend-finder indicators quite interestingly remain on a sideways signal Monday, April 7th, but another component indicator did trigger a sell, the 14 Day stochastic. The intermediate term Secondary Trend Indicator remains on a buy. The longer a sideways pattern lasts, the higher the breakout will be, typically. So, once this sideways pattern completes itself, stocks should resume their upside move.
So in conclusion, the corrective decline from early March, which has not taken stocks below their early February lows, which is consistent with the large degree wave structure for the primary rising trend that is underway, is likely to finish over the next week or two, and should be followed by a blow off rally that is impressive. Once that rally leg is finished, probably accompanied by an Advance/Decline Line Bearish Divergence, we should arrive at the top of the Jaws of Death pattern, to be followed by a huge Bear market in stocks and a recession/depression in the economy. It does feel like this is all occurring in slow motion, but it is a massive primary trend coming to conclusion and it has the right to take more time.”
Thanks again to everyone for such lovely messages!
Tuesday morning. I have updated the models. Now the stock markets have begun a sell-off I am next looking for evidence of a wash-out or capitulation (in indicators such as call/put, nymo, vix) that might signal a bounce or trend reversal. But I don’t see that yet, so expect we are going lower yet (with treasuries and gold higher), whilst understanding the bears won’t win every day. US earnings kick off again today with Alcoa.
John,
Are you preparing to exit your shorts on a washout and go long.
Bill
The sun’s northern magnetic field strength has now reverted back to zero, and the overall dipole is barely making progress. http://wso.stanford.edu/Polar.html#latest
The weaker the field strength, the higher the number of sunspots…
Two years ago I mentioned here that the solar dipole might not necessarily reverse at all during SC24 https://solarcycles.net/2012/04/20/solar-peak-secular-asset-conclusion/#comments
Solar planetary cyclical models, originally regarded as amateur pseudo-science, are being proven correct. They are showing that the next solar peak (SC25) is due around 2018/2019 – only a few years away.
So we are most likely facing a period of sustained solar influence, in a way that humans have never experienced before. And just at a time when the lunar declination cycle (as marked by the forthcoming four total lunar eclipses in a row) will be modulating it for maximum effect.
Mark,
Thanks for posting your valuable inputs on SC. I had read your comments then.
Let me get it correctly – Are you saying double top in Sunspot numbers with 2011 will happen NOT in early 2016 but in 2018?
Mark, I am also confused about your comment regarding a 2019 top. I had always seen the potential for a late 2015 final peak as suggested by comparing time distances between first and final major peaks within a similar sc structure like sc16. Are you suggesting sunspot #s will dive in the next couple yrs and then climb for a 2019 top?
Jigs and Joseph,
I suggest there are two distinct possibilities. One is that solar field strength remains very weak, allowing a low but still significant sunspot count to continue until SC24 effectively merges into SC25.
The other possibility (more likely I think) is that field strengths start to strengthen again later in 2014, creating the right shoulder of a typical weak-cycle plateau during 2015/early 2016. Most indications are that SC25 will be extremely weak, and its peak could form very quickly after a brief intervening minimum.
Looking at how humans have behaved during prevoius solar cycles, it seems that the longer duration of weak cycles at least makes up for their reduced sunspot numbers – and now we have the probability of a very long SC24 followed unusually quickly by SC25…
I can’t find any evidence that the next solar peak is 2018/2019. Nasa shows a minimum at that time, since the cycles are 11 years long.
John – a plot of a relationship between planetary and solar cycles is shown in the third chart in this link, which you might find interesting: http://tallbloke.wordpress.com/2014/03/31/what-is-the-planetary-theory-about-why-all-the-fuss/
11 years is the average duration of a sunspot cycle, but they have lasted anything between 8.7 and 13.9 years. An analysis by Timo Niroma shows that they’re equally as likely to last 9 years or 13.5 years as 11.
Mark, very interesting…thank you for the information. It is fascinating how the initial intuition that the planets are too small and too far to affect the sun might turn out to be false.Do you know if there is a table of the planetary cycle? Eyeballing it, it seems to peak a year before the solar maximum.
If the actual peak was say the Euro Crisis in 2011 (and then irregular action due to QE), I can see another peak 8 years later in 2019 as you said. That would repeat the 8 year difference between the 1929 and 1937 market peaks.
John – I don’t think there is a table, or even a summary of all the research. The tallbloke website is probably the best attempt to tie it all together. They have a list of some research papers here: http://tallbloke.wordpress.com/prp-special-issue/
All of the planets must affect the sun, due to the very fact that they’re held in orbit – its just a question of degree. The outer giant planets tend to influence the position of the sun via gravitational attraction; and the inner rocky planets disturb its plasma via tidal force. The result is a very complex influence of cycles upon cycles, which science is only beginning to understand – that’s despite the fact that humans have been thinking about this since at least the time of Copernicus, possibly much longer.
Mark, thank you for the information. I will review with great interest!
Thanks for responding. Are you planning to go long or just cover your shorts.
If we saw evidence of selling capitulation I would cover some shorts.
Is there a relationship between the solar maximum and El Nino?
This year could be the big one…obviously El Nino would affect food commodities.
http://www.slate.com/blogs/future_tense/2014/04/07/el_nino_2014_2015_forecasts_show_it_could_grow_into_a_monster.html
It seems bears are losing this. Yes I know Nasdaq100 and Russell are in downtrends and what happened today could be only one-day wonder and short covering. But SPX and DJIA look like they can break to new highs. If bears do not appear with full force tomorrow we may see SPX 1900 until end of week
Yes today’s powerful rally gives the near term downside risk a big hit. However, we all say this after such a powerful rally and at some point it simply wont bounce back otherwise the market is on a one way trip to infinity. I still stick with John’s prediction but this market top may take a while to play out. Today’s rise on the back of the 6.5% target being removed only serves to prove the FED is only real positive driver in the market and all the signals john has above are being ignored for the moment,
Interesting discussion on the sun cycles. Have you folks hear of Eric Dollard and his research and study on the nature of the sun? This discussion is quite popular in esoteric circles and is worthy of thought. Amazing, but could be true, which means there could be a divine path or reason for what would be playing out in our near future, controlled by the sun, as a transformer of energies.
And also as Mark as pointed out: “And just at a time when the lunar declination cycle (as marked by the forthcoming four total lunar eclipses in a row) will be modulating it for maximum effect.” In addition to a rare alignment of the Sun, Earth and Mars.
http://aetherforce.com/3-secrets-about-the-sun-video/
“Eric Dollard reveals three stunning secrets about the sun:
It is hallow
It does not operate by fission like a big nuclear bomb but is instead a electrical extra dimensional transformer.
It is dying… or going into a weak solar cycle much like the dark ages”
As a follow up to 1946 analog, the chart that was posted from Market Anthropology exaggerates how steep the drop off after the peak. There were two major bounces in 1946 each with lower highs before the major drop. This unwinding process occurred over about three months. The current bounce is consistent with this scenario as long as it doesn’t extend more than 5 or 10 points higher.
Reblogged this on inflationproofinvestor and commented:
excellent research on financial cycles