

The selling in equities into Tuesday did not wash out indicators, suggesting a lower low should be ahead. Yesterday’s bounce produced a very low put/call reading signalling high complacency.

Source: Stockcharts
Risk of an outsized move remains historically high:
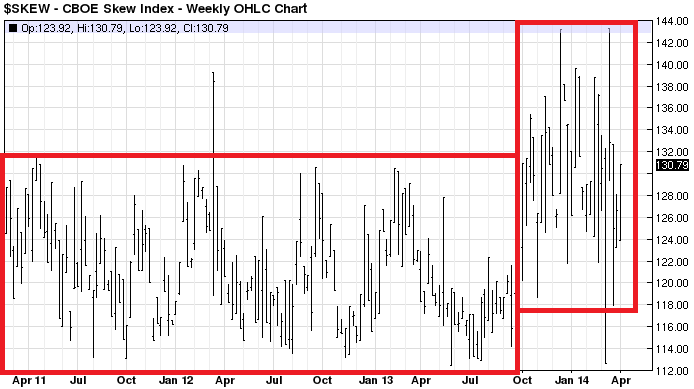
Source: Barcharts
Investors Intelligence bulls back up to 54.6%, bears unchanged at 18.6%, continuing the historical extreme cluster of readings.
There is downward pressure into next Tuesday’s full moon. Presidential seasonality peaks out in mid-April. Earnings season ramps up as of next week.

Source: Fat-Pitch / StockTradersAlmanac
Narrow money and OECD derived leading indicators continue to point to weakness in global industrial output into May, before a summer pick up. Economic surprises for the main regions ticked further negative this week.
After a little consolidation, commodities (CCI and CRY indices) are breaking upwards again:

Source: Bloomberg
Whilst the US Dollar is flirting with breakdown again:

Source: Stockcharts
Treasuries and yields are in a range, watch for resolution:

Source: Stockcharts
In short, I expect the current bounce in equities to be short lived and roll over into further declines into next week’s full moon. April remains my target window for major declines in equities, based on historic patterns of falls accompanying this inverted geomagnetic seasonal low period, together with an anticipated solar maximum now on the wane. That would imply this earnings season would be a sell, and I think this is reasonable given we have negative earnings guidance once again whilst stocks have front-run up to valuations that in contrast demand a return to solid earnings and revenue growth. Leading indicators also suggest economic data should continue to disappoint into May, adding to this April window of opportunity. However, if equities can hold up in a range through this period until data picks up again, then maybe we could have a mirror of 2011, whereby stocks did not break down until the Fall. For now though, I suggest this the lower probability, and I expect April can deliver the goods.

Thanks John. Either you’re up very late or you reside in my half of the globe?
Europe – markets open time.
That aside, I agree that this equity bounce is likely nothing more than continuing topping action.
The USD does have me intrigued though as I would expect that any equity breakdown would be followed by safe haven buying ie USD/bonds and looking at it the dollar appears to be on the cusp of a breakdown.
That implies risk on and new equity highs. Unless of course we get a scenario being a US centric, banking related sell-off.
I’m not sure that is even remotely possible. given global market structure, regardless of what occurs to the US financial sector.
i would suggest that the probable tax selling is to start from today (after an up day of yesterday)
hey there 🙂
Certainly, the 2011/1998 pattern is a particularly appealing scenario for this year.
Bull maniacs face a major concrete wall of resistance in May…and we’re now less than 3 full trading weeks from that.
The USD monthly cycle sure looks prone to upside, which I realise is counter to what most are currently saying. Look at the bollinger bands on the monthly..they are tighter now than in 25/30yrs.
A BIG move is coming in currency land. If I had to guess, Japan is going to have…’issues’.
Love your name.
John, full moons tend to be tops rather than bottoms
if the lunar model has any credence, they should be lows. The half of the lunar month that is generally positive for stocks runs from 2 or 3 days after the full moon until 2 or 3 days after the new. Vice versa for negative for stocks. So we are getting close to the end of the lunar period that’s negative, full moon is on Sunday. There could be carry over for a couple of days next week, then the two weeks following should be positive for stocks.
http://www.astroadvisor.com/astrology/april-apocalypse-to-hit-financial-markets/
I know nothing about options but can see that trading them would be a great way to make money from the potential collapse that could occur in the next few weeks. Risk is limited and potential reward could be massive. Trading out rights means have to get the entry spot on and manage stops accordingly which is still tricky.
You guys on this blog are pretty clued up. Whats the best way of shorting equities using options?
I’m not sure what is the English speaking equivalent, but i use the German Onvista.de platform:
http://www.onvista.de/optionsscheine/os-vergleich.html?CATEGORY=SO&
Options are the hardest instruments to trade. It’s easy to lose money.
That said, to short U.S. indices, people generally buy puts on index ETFs (SPY, QQQ, DIA, IWM).
http://www.optionsprofitcalculator.com
Craig, I do agree with Ultra. Options are for sophisticated traders (and you may indeed be one of them!) but you can ultimately lose everything due to time decay, which can eat you alive if you chose the wrong option. I suggest looking at some inverse ETFs which are widely traded with great liquidity. For example, if you want to short the SPX take a look at SDS – the ProShares UltraShort S&P500. But even then it is really a day trading instrument, or perhaps swing trading for two or three days. It was up 4.25% on April 10th. You can short just about everything via inverse ETFs. But bear in mind that they are not perfect, and if you hold them for longer than a few days you may suffer abnormal losses.
(None of the above is investment advice….just personal opinion.)
Appreciate the comments guys. I am already short NQ, YM and ES futures. Im in the money with my stop breakeven so will ride that out. I was just thinking of further ways of enhancing the potential drop if this rapid collapse scenario does play out. Obviously if the timing predictions are on the money with the eclipses etc, then options would be a good play as well with the risk reward being so good.
Hai John, do you think 14 or 15 bottom? Tq john
Thank you again John for this update and welcome back. I still have to position myself at this stage, but your updates are always a good sounding board to reassess my own view of the world! I hope you however pace yourself as financial markets are extremely overwelming at times and health is too essential for your long term being and happiness. Take care!
Even after today many analysts are repeating that this is not a broad based sell off. I even heard one analyst comment that this was not a high volume sell off?
Give it time , this is only the beginning.
Denial is rampant. Sell signals are continuing to grow stronger by the day. Not until we see futures making triple digit losses and the market gaping down are we even close to a bottom.
I could be wrong but for several reasons this chart looks really bullish to me.
http://stockcharts.com/h-sc/ui?s=$GOLD&p=W&b=5&g=0&id=p34022091382
Thank you John Be well
Any comments on the Blood Moon?
Puetz crash window April 9 to April 18
I’ve been thinking April 14 crash for months but not so sure.
Thanks for the update, John. Great that you are back where you belong.
Yesterday at the open was a peach of an entry – nice fibs on all the indices. Breaching the prior low is bearish, although I am wondering if the bearish key reversal yesterday (Thursday) isn’t a case of too far, too fast. Outside down day not at the start of a move is usually a sign of impending reversal higher.
Another chart you posted last time, John – BTC looks like it’s begun another leg down, after the lower limit of the huge triangle down from the top was just breached.
Meanwhile, back on my extremely technical daily megaphone chart, after a full month of futzing around trying to gain escape velocity, did we just fail for the last time?
http://scharts.co/1cVPvBW
And this is also a longterm megaphone from the 2000 top. I call it a reverse point wave from a publication by Wells Wilder. Big reason I am bearish despite credit cycle not.
Thanks all. No washout/capitulation in indicators after yesterday’s selling in stock indices so I keep my shorts in tact and on we go.
TRIN was extreme at 2.37. That is capitulation.
http://stocktwits.com/message/21954357
That was a strange day yesterday, not typical for GN markets (going nowhere), rather a trend day we can find in directional channels and in higher volatility. Good volume at the open and narrow balance…I shorted first a few pips above DJIA open level, the rest is history. The thing is, a trend day in this range has sharp pullbacks (4,7 April), this time, every red 5 minutes candle was a safe entry for shorts. Bears were very exhausted recently, so 4 th of April delivered an expected fakeout, another fakeout to the downside may follow, like in June 2013. There, below March -April 2014 value, bears would regain strength, so that the Bull can eat them alive. Bull needs fuel to continue, the bears sustain bull’s life. Can this be a beginning of a bigger correction? I go where the market goes.
USO inside day affords a nice entry setup with small range – http://scharts.co/1hFvH6J
My first and only time I was wiped out was in options. It’s not that I didn’t know how they work, I simply was positionning myself for the price to go somewhere buying puts and calls, while the range of the market was narrowing and the market was positionning itself for going nowehere. It was right at the beginning of my trading, a decade ago, and of course I overtraded (size). Some say being wiped out is the best what can happen to the novice trader..well back then I thought I know a lot, while I knew bloody nothing! Mark D. Cook, L Raschke and J. Livermore all were wiped out. It’s not a good feeling or pleasant experience but this kind of shock therapy may deliver some extra perception skills so that one becomes a wizard. I don’t recommend to anybody trying being wiped out, and the only advice I’d like to give to novice traders is to keep away from the markets. If youre cold blooded crocodile and able to dedicate a few years of life before you make profit, jump in, otherwise the markets will be a very costly adventure, in some cases they can break a man. Yesterday was one of the best trading days in my life, it would not be possible without all my trading experiences. Thanks to all the lessons, I didn’t choke, being offered a rare pefect day where everything worked. Please don’t learn daytrading using yesterdays price action, this type of days is really rare.
My working hypothesis has been that we are forming a head and shoulder top to end the rally from 2011. Head top has been formed. I suspect we go down to 200 day ema before bouncing back up to form right shoulder, then big decline begins in May-June time frame. Just a working hypothesis.
Puetz crash window: here we go again? I thought this was NOT…NOT a crash window as defined by Puetz becaue first comes a Solar eclipse; then a Lunar eclipse. The eclipse this month is marked first by a lLnar; then a Solar eclipse.
Now; do I have that wrong?
” He noted that market crashes tend to be lumped near the full moons that are also lunar eclipses. In fact, he states, the greatest number of crashes start after the first full moon after a solar eclipse when that full moon is also a lunar eclipse . . Once the panic starts, Puetz notes, it generally lasts from two to four weeks. The tendency has been for the markets to peak a few days ahead of the full moon, move flat to slightly lower –waiting for the full moon to pass. Then on the day of the full moon or slightly after, the brunt of the crash hits the marketplace. ”
Also:
“He does conclude that a full moon in general and a lunar (eclipse) full moon close to solar eclipses, in particular, seem to be the triggering device that allows for the rapid transformation of investor psychology from manic greed to paranoia. He asks what the odds are that eight of the greatest market crashes in history would accidentally fall within a time period of six days before to three days after a full moon that occurred within six weeks of a solar eclipse? His answer is that for all eight crashes to accidentally fall within the required intervals would be .23 raised to the eighth power less than one chance in 127,000.”
My take is that this full moon could turn out to be a Puetz crash, even though the more normal pattern is the solar eclipse is first. See my other comment where I’ve quoted from an article about his crash window.
eclectic
i claim no special knowledge about puetz crash other than what i have read
i have never seen anything about which comes first
i seem to be the only one in the world that thinks that we are currently in one
“six days before to three days after a full moon that occurred within six weeks of a solar eclipse”
John, I’m no expert either; just hoping to increase my knowledge. I’m merely pointing out that the eight (8) crashes referenced from the following article; occurred when a Solar eclipse was followed by a Lunar eclipse.
http://www.wallstreetbear.com/beginner/Puetz%20Eclipses%20-%20Peter%20Eliades.htm
Having said that; I’m sure there is significance to these two eclipses this month; because they are also of the blood moon variety.
In reading the link in the majority of the eight crashes the full moon was an eclipse but not all of them. a couple were when the eclipse was the following month like this one will be
John, can you please be more specific?
I show a Lunar eclipse on April 15. This is followed by a Solar eclipse on April 29.
I do get the 6 days before and three days after the Lunar eclipse on April 15; which would be April 9 to April 18.
So, again, the sequence for this month is Lunar; followed by Solar; not Solar followed by Lunar.
And what about that 6-weeks before the Lunar eclipse rule?
I’ve recently discovered your blog & want to echo all the other posters in saying that I appreciate the thorough & well reasoned arguments / evidence you put forward for what is now happening in the markets.
Furthermore, I’m glad you’re back & trust you’re getting better by the day, not least because you’re seeing your predictions unfold in real time.
So to my query relating to the Dow. On previous posts you mentioned a waterfall decline but also a top (Dec) being followed by a decline & retrace back to almost this high.
Given we have seen a higher high in March, does your research suggest this pattern is still probable, given where we are in April & the timings of the lunar / solar eclipses (discussed by others above), or has your expectation of the likely pattern to be followed now changed I.e a straight-ish drop to something low in the 30% decline category?
Thanks Tim. The Dow high close remains 31 Dec, it was not taken out. Yes, I’m still with those timings until disproven – see new post.
I’ll just correct myself that the Dow higher high was in fact 4 April I believe & not in March
We are in the midst of mini-crash to SPX 1630-1670 zone (October lows). Then if (and that is big if) we find support it can rally back in one more attempt at the high.
It is always hard to join such dynamic move as there can be no significant correction until temporary 1730-1740 support is reached. Trading discipline is key here and it is most difficult part of the game.
Bunnell, I don’t think we are in the midst of a mini crash. I think we are just at the start of a MAJOR crash.
The reason I say that is because major crashes occur from major extremes. The markets were, still are, at extremes in just about every historic indicator you choose to view.
John has done a superb job at compiling a list of why markets are in for a very substantial decline and made it easy for us all to see for ourselves.
I think investors the world over are still in denial. That ensures that the severity of this decline has not even begun to sink in with the majority of investors, most of whom are completely asleep at the wheel and hang onto the belief that new highs will quickly ensue.
Here is the charts of three markets in the weekly time frame that are about as ugly a chart as one can get no matter from what perspective you look. I could find dozens and they all paint the same picture. The ducks are lined up.
Wait until the panic really sets in, this decline hasn’t even scratched the surface
http://stockcharts.com/h-sc/ui?s=$FTSE&p=W&b=5&g=0&id=p00363766519
http://stockcharts.com/h-sc/ui?s=$INDU&p=W&b=5&g=0&id=p70958837911
http://stockcharts.com/h-sc/ui?s=$NIKK&p=W&b=5&g=0&id=p02131686490
Allan,
Well said
Mat
I think there is a chance for market to at least try to bounce at previously mentioned levels. It can be close to FOMC meeting on April 30th. If the Fed gets scared and Yellen is afraid of her being repeat of Greenspan in 1987 they can reassure markets for another brief respite. If we get subsequent closes below SPX 1650 it will be all over though.
I am really afraid of what is next as I expect major international event to happen, similarly to July-August 1914. It can be real thing and major exchanges may be closed for some time. I am not sure it happens this year or in 2015 but it increasingly looks it will happen. This can drive SPX to low 400s in few months.
I do not expect September of 1939 to happen in Wall Street, I rather expect August of 1914. 1939 was thought in America to be limited European war, 1914 was clearly end of cycle in globalization.
That is why I think it can be technical problem to profit from the next “big thing”.
Allan, I like your comment about being “asleep at the wheel”. That perfectly sums up the dumb money position during the last year, at least. I simply cannot believe the record amount of margin debt and the fact that we seemingly never learn from past mistakes. I wonder if that negative credit balance started to retreat in March, which usually signals a big sell-off in equities. Here is Chris Kimble’s chart again:
Meanwhile, the smart money has quietly been exiting the market for a long time now. It’s well known that insider selling is at an all time high. You have to ask why.
Regarding hte eclipse configurations. As was stated, the typical sequence is solar, followed by lunar.
First rule of thumb is markets don’t normally crash between eclipses; they normally crash on either side of them, about a month from the midpoint of the eclipses is a typical panic climax. Of course that is not to say a can’t happen between the eclipses, just that no crash I know of has occurred between a lunar and solar eclipse where the lunar occurred first.
For example, the current eclipse configuration most resembles April of 1930, where the rebound out of the 1929 crash ended. There, the lunar was April 13 and the solar was April 28; the market topped on April 17.
In 2011 there was a triple. The lunar was June 15 and the last solar was July 1. The market made a low on June 16, then rose through the solar eclipse, the lower top was July 7, and another lower top July 21 or 22, and the crash was in early August. The market double topped in July around the full moon, equidistant from it.
http://www.project-syndicate.org/commentary/harold-james-warns-that-eu-and-us-financial-warfare-against-russia-could-lead-to-the-real-thing
Zionist propaganda. Putin has done nothing, it’s Europe and USA that are trying to take over Ukraine by setting up some dodgy terrorist in Majdan. Russia is one of the few countries where Jewish criminals actually go to prison (Chodorkowsky). All zioniworld hates Putin. An Economic war would be won by Russia and China, and Wall street is well aware of that. Crimea never belonged to Ukraine, why not protect Crimea from hostile western takeover? History repeats itself, 1933, 2014.
http://rense.com/general84/declare.htm
Thank you for this resource… Impressive ‘project’…
Are we waiting for the same coorrection and crash that people have been talking about since March 2013? A system that has 9 losses and one big win are not really that sound, despite that it makes some money in the end.
Here is the background of the author of the article I posted above from Project Syndicate:
Harold James is Professor of History and International Affairs at Princeton University, Professor of History at the European University Institute, Florence, and a senior fellow at the Center for International Governance Innovation. A specialist on German economic history and on globalization, he is the author of The Creation and Destruction of Value: The Globalization Cycle, Krupp: A History of the Legendary German Firm, and Making the European Monetary Union.
You won’t make money in the market, if you cannot tell fact from fiction.