

1. Bulls in control of price still, but the combined picture of this chart suggests an imminent handover to the bears:
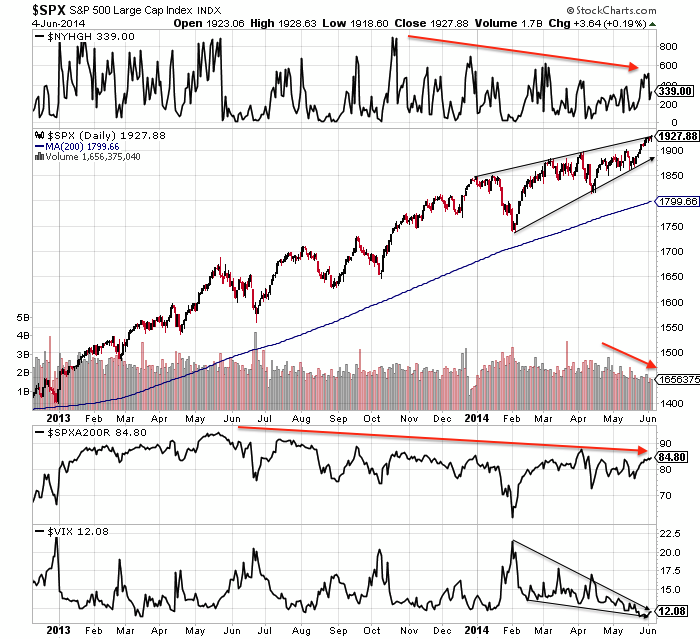 Source: Stockcharts; Annotations: Mine
2. Plus, new high on negative Nymo breadth:
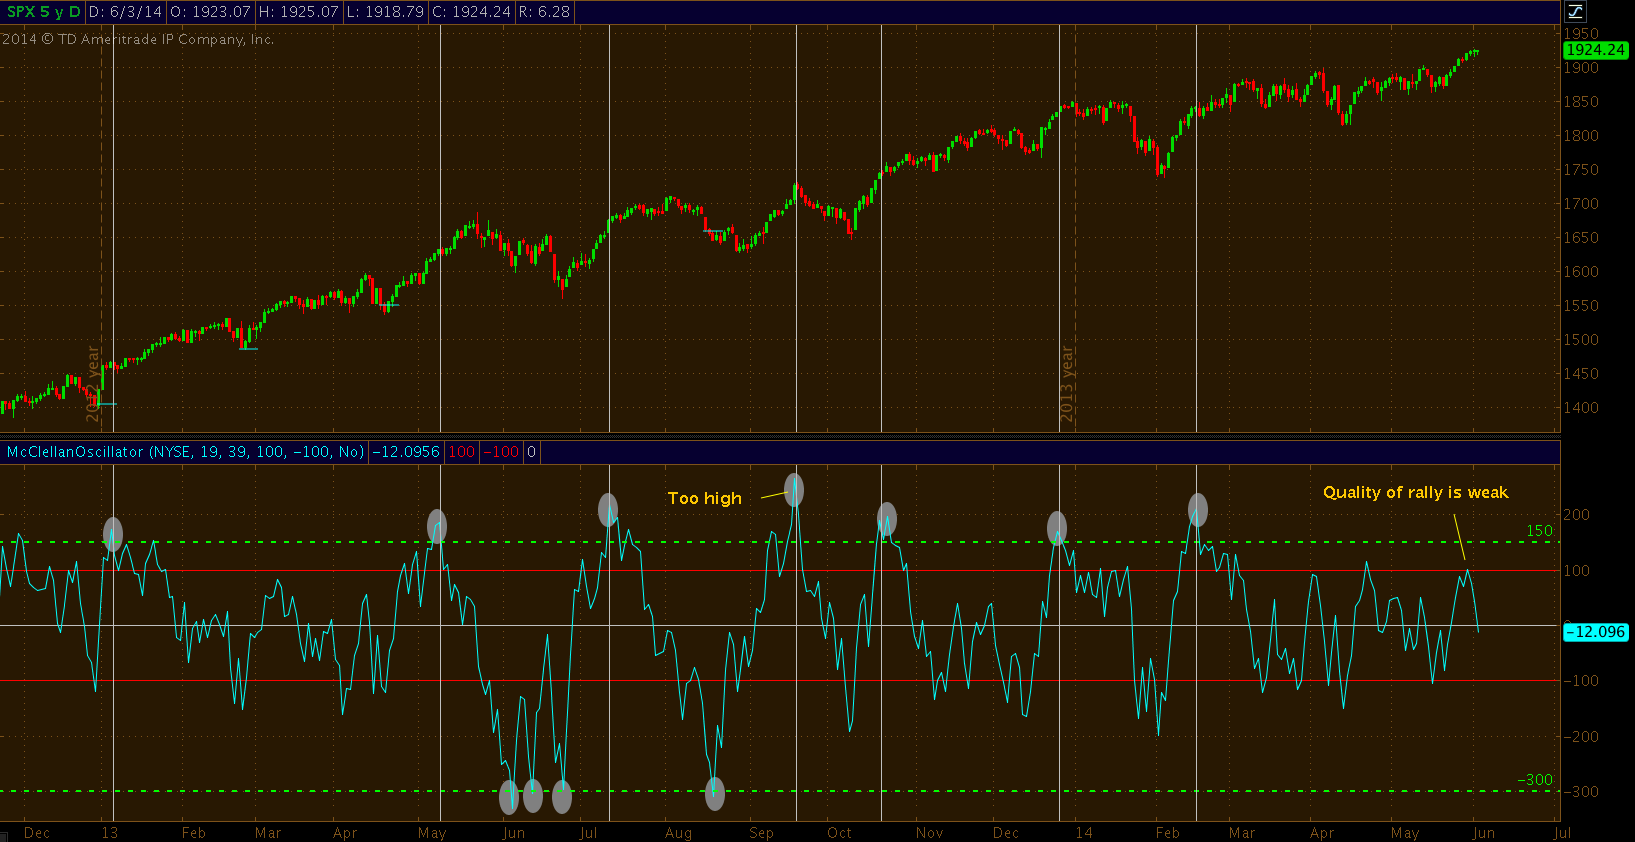 Source: Tradetrekker
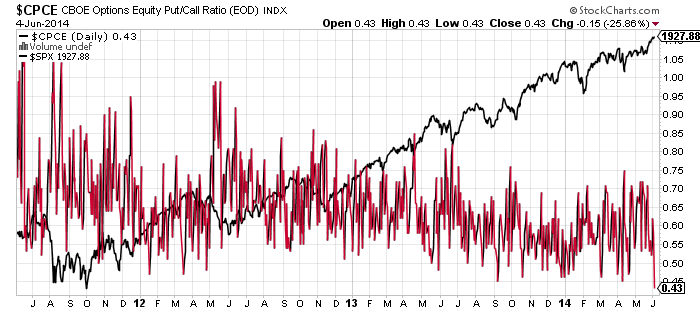
3. Equity only put call ratio printed an extreme low yesterday:
4. Investors Intelligence bullish sentiment last seen Oct 2007:
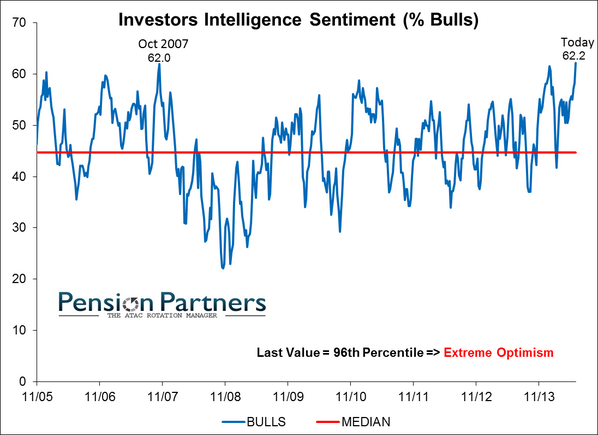
Source: Charlie Bilello
5. Sornette bubble-end flagging a second time on SP500:
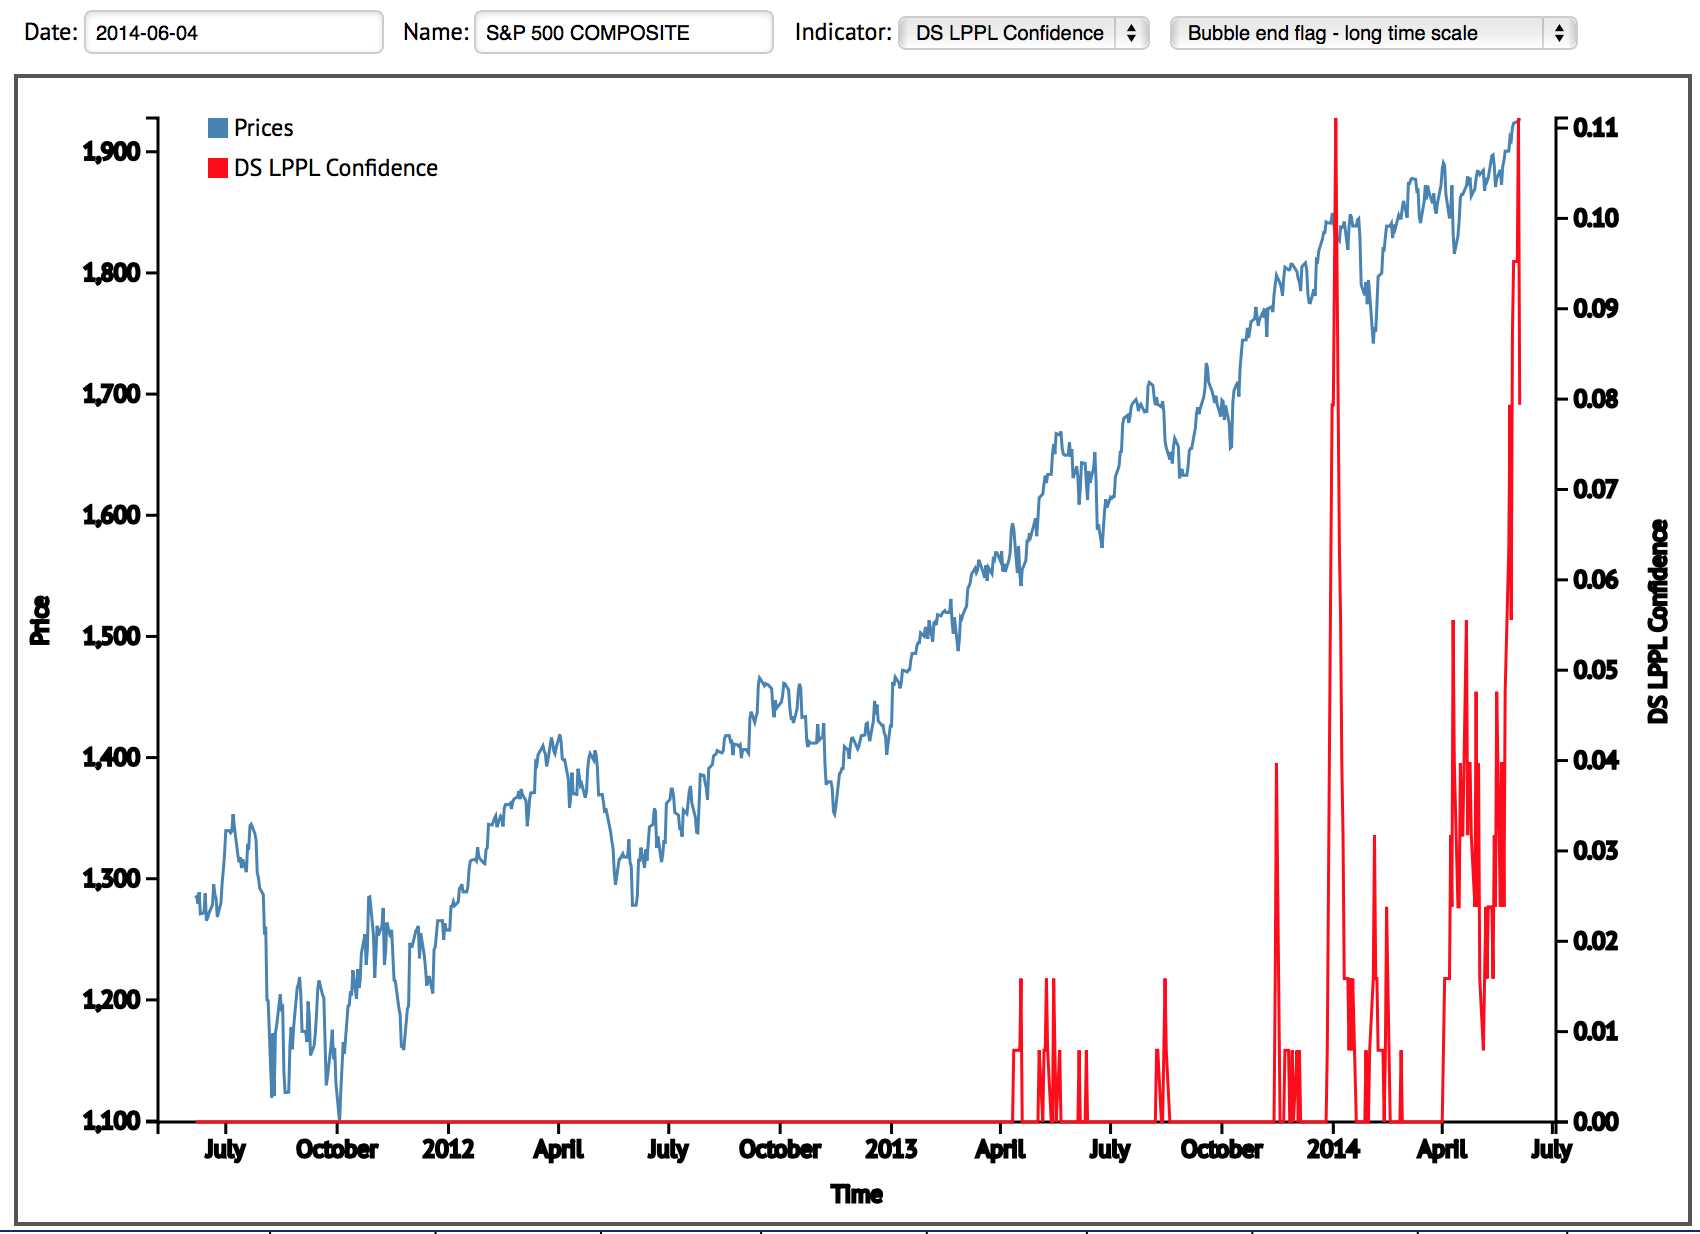 Source: Financial Crisis Observatory
6. Euro short interest at level that suggests a rally ahead in the European currency:
 Source: FX Street
So, ECB decision today and US employment report tomorrow. The Euro chart above potentially paves the way for ECB aggression disappointment (thus Euro rallying), which would fit with their conservative approach to date. Meanwhile yesterday’s ADP report paves the way for a potentially disappointing US jobs report tomorrow. However, if news exceeds on either release then more short covering could propel equities higher.
Pressure is downward from here into next Friday’s full moon. The combined picture, including the charts above, has set up another compelling chance here for the bears, so let’s see how the market reacts to the two news releases.

First
thanks John
Thanks for the great work John, These are dizzying heights we are at. Reminds me of how I feel when I try to climb my ladder to get on my roof. I feel like I am going to fall off!
ECB decision…..Buy the rumour sell the news?
ALL IN LONG
ALL IN SIDELINES!!! ….with ammo ready for when everyone else ran out 😉
Now your cash is costing you money… how about that position… =)
haha…one might be able to beat the market, but not sure its remotely possible to beat the banksters!!!
Short squeeeeeeze starting… squiggly line traders have all their indicators screaming to short but paper buyers will start to buy when they see how much cash they did not earn last few years… public participation will start and VOLUME will increase from all you cash people.
thank you for these charts… price is all that matter but there are a lot of things that stinks
LMAO……as expected. Banks now have to pay for depositing money in the Eurozone. Who do you think is going to pay for that?!
No incentive to save, no incentive to improve efficiency. NO INCENTIVE PERIOD!
Central Bankers are going to destroy the global economy, but at least stock markets will make new all time highs…..
Move along, nothing to see here.
Who is going to pay for it? Anyone who leaves their money in the bank!
There’s even talk of large-denomination banknotes being withdrawn. In other words, if you want to withdraw a significant amount of money from your bank you will only be able to transfer it electronically (ie. to another financial institution) – so you’ll be trapped, having to pay interest on your own wealth to the banking fraternity…
Keep it in cash under your pillow, and you’ll see it inflated away at a rapidly increasing pace..!
This absolute madness. I know I keep saying it, but this is going end far far worse than anyone could ever imagine.
We had opportunities several times in the past two decades to take our medicine and we ALL choked on it.
Australian Prime Minister in the early 90’s Paul Keating was ridiculed and lambasted for making the following statement.
,
“this is the recesion we had to have”
He is, to this day, one of the smartest and least understood politicians ever.
Two links of mine>
http://forosdebolsa.com/foro/foros-de-bolsa/1116576/17-years-cycles-1906-23-and-1966-83/
http://forosdebolsa.com/foro/foros-de-bolsa/1116599/smart-money-and-dow-jones/
@apanalis
Ref ECB COT, in a similar position in July 2011, was the beginning of a 6 month plus month decline. COT is like overbought, it’s bullish in a bull mkt. Steve Briese, author of the COT Bible, says the time to sell is when the large speculators are fully committed and the last one buys. That can take months or even years. The large speculators have been short/bearish precious metal for 2 years and correct.
It’s got to the point where I hope we get into the worst recession this planet has ever seen. It will create huge levels of unemployment and bankruptcies but if it changes opinion on central bank policy then it’s worth it as future disasters will be prevented. We need 0.2% annual growth not an unsustainable 3%! Why can’t we grow slowly and steadily rather than explosively with volatility. It all comes down to human greed basically! If stock markets double from here that will be great for most investors but I bet the economy will be in a worse place.
Boom and bust economics is bankrupting working people. Only the wealthy have enough capital to ride out the busts, and buy, buy, buy what poor folks are forced to sell for basic needs. It’s sickening.
We cannot grow at that pace because virtually all “money” in existence is debt. More money than exists is needed to pay off the debt.
Be sure to check out peterslane1 link to helical model of the solar system, I love beauty in the morning, splendid. It was in Fuel Spent post.
The Investors Intelligence chart of bullish %, is noteworthy. It is in near record territory and a double top. That should be it.
The big fly in the ointment for bears has been the hurricane of QE. Easy money in a weak economy has been bullish and that is exactly what we have been experiencing Bear markets have come when the real economy is expanding so rapidly it takes liquidity from financial assets. Does the 1% drop in US GDP indicate even that is not working now? That is probably the thing that could make us bears right. Currently the big money totally believes that the central banks are in control. They completely discount the drop in GDP as an aberration. If it is not, I believe it would make the hedge fund boys et al really panic, as Aunt Janet Yellen’s put may not work either.
Has GDX put in the right shoulder low?
http://stockcharts.com/h-sc/ui?s=GDX&p=W&b=5&g=0&id=p35466287550
I think so, Allan, if the price goes up from this level, the right (inverse) shoulder is realized. I am looking at the HUI weekly chart.
Thanks John, great work! Much appreciated.
Regard the Sornette model, Hussman has stopped talking about it after being wrong in January. It seems that the oscillation got smaller to the 1/2014 countdown as the model wanted.
Then from 2/2014 we started a new countdown, and so I thought the fit would not be good anymore. Would you be kind enough to share what the wave oscillations look like now? Could you share the source of the data?
Hussman, DeMark, etc are as useless as the day is long for the last 2-3 yrs.
John,
With this negative rate and bond buying threat are you worried that we have much higher to go before we fall.
Bill
Salute to fearless bears! But let’s face the fact: the markets don’t care how many reasons you have or how reasonable you are. They just don’t care. If bears have 100 good reasons, bulls have 100 too, no more and no less. So, how to resolve the disputes between bears and bulls? Let’s vote. The rule is simple and clear: more money, more voting rights. This is how the markets are working. Just forget the Sun or the Moon. They are fair and kind to everyone.
Feels like a big short squeeze has just started.
Today’s session also looks like tragic loss of opportunity for bears. Market doesn’t honor all bearish indicators and technical resistance levels so it is probably going much higher. And that will involve buying panic or short covering madness, you name it. It is unforgiving and if eventually (August ?) when it finally tops bear bus will leave the station completely empty.
Maybe, maybe if gold bottoms here and USDJPY heads lower we can hope for turn in main indexes. But first all bears will be exterminated.
what a joke to believe in solar cycles based on 3 instance in 100 years…
This is the solar maximum, and here is the speculative mania. What a joke?
Glad I fully hedged on the dip after the rise. Will ride out whatever rise is left and then close my longs ready for the mega collapse which will lie ahead due to such inflated markets.
Bears need to have good vacation and come back late August. There is nothing wrong in being in cash, it allows you to think..
True bears should be careful. But without doubt when the bears get their turn they will be as powerful as the bulls currently are and will drive the markets down heavily.
Tom de mark has been wrong again and will have to reset his indicators such that they point at a higher top as he done the last 3 times. Eventually he will be right though lol
Beginning of euphoria stage?
Jan 2013 was beginning of euphoria stage. This is a continuation…
I believe the consensus is that the previous rally has been “hated”. Although I don’t know what that means exactly.
“Hated” because the Gini coefficient (a measure of inequality of wealth) is the highest since 1929, while the stock market is making all time highs.
SHORT SQUEEZE,
ITS not lining up cos im looking at the usual suspects that always rally with general market and its not happening today
specifically what are you seeing? what stocks always rally with general market that did not rally today?
i reckon sprout hits 1158 to finish wave 5 on daily chart
what is 1158?
Haha. Robbie is on about the Russell. Brussels sprouts!
I have been in markets for a long time. I have never seen anything like this. The fraud is unbelievable. The speculators inflate and then stocks and sectors collapse, they reflate them again, they collapse again and they reflate them again. There is no self-correcting mechanism for failed excess and failed rampant speculation with endless free money given to institutionalized speculators.
Russell 2000 and Value Line Index are sucking wind although they are ramming both hard today.
Regardless of when this ends, it is going to end very, very, very badly. Possibly with a collapse in the concept of money and an end to capitalism.
yep!!
and ive just been banned from the GREEDOMETER website for calling it the “monkeymeter” how sad that he cant take a bit of ribbing
Dont feel bad robbie, that meter is a “has been”
This authour has been correct for a long time now. He’s forecasting a drop to 16000, then rally to 17000, then correction in Sep/Oct.
http://www.marketoracle.co.uk/Article45917.html
Renowned permabear Tim Knight of http://www.slopeofhope.com (almost) throws in the towel.
Dare I say, this is the kind of shit you need to see for a generational top?
http://www.zerohedge.com/contributed/2014-06-04/persistence-memory
I see only one small chance for bears and it is today. If we take a look on ES future chart we can see 80 point advance from 1804 on Apr 14th to 1883 on Apr 24th – 79 points. Then after ambiguous consolidation pattern we have another advance from 1859 on May 15th to 1941 today – 82 points. So this can be roughly qualified as A-B-C. In the same time gold should advance higher after bottom was formed around 1240. Any strength in stocks today would invalidate it. Bears lost so many opportunities last weeks that reversal now seems inconceivable.
Unfortunately for bears, strength in Russell, mid caps, small caps etc is sign of much higher prices. Like in 2007, first opportunity to sell would come in mid August with retest in September. That is my preferable scenario now. But I will not switch bullish as the risk is simply enormous.
The risk simply enormous? the risk is enormous if you allow a position to eat away your account.
Thanks everyone.
I largely agree with Bunell. There is a chance today of a reversal, something similar to the Bin Laden top in 2011. An overthrow (yesterday) to bring about capitulation of the final bears (me aside, I added short again) reversing into a downtrend. Volume was low again yesterday and gold, treasuries and utilities all rallied. With 62% II bulls is there the fuel to rally this higher from here? If there is, then the solar maximum is still in charge, inspiring a greater mania yet. But first we see how the market digests yesterday’s news and the jobs report ahead today.
The German DAX has been a reasonable leading indicator. I say reasonable because it hasn’t been perfect but good nonetheless.
Sure has the makings of a reversal to me.
http://stockcharts.com/h-sc/ui?s=$DAX&p=D&b=5&g=0&id=p75420633579
Even if the market is going higher from here I would expect a small pullback of maybe 2% to get the buy the dip people interested again. This could happen in the next two weeks hopefully.
Time now for me to try going short SP500 at 1944, but I’ve my finger on the get-out-cheap button above 1945. Ideally I’d like to see 1955 by next Wednesday before being more aggressive.
I’d recommend reading Duncan Smith’s link above, by the way.
1956 is the next big resistance.
rut is now in uptrend
Tuesday is always up, but Friday even more so.
Market continues to be very easy to trade for those with open mind. We are in a bull market. First of all, there is no reason to short market at all time highs. On May 5/20, I questioned the sanity of the bears of this blog. That was posted incidentally at the absolutely low of the week. Now we are 80+ points higher. Do you want to trade the market you have or the market you want? John’s indicators have proven to be incorrect, by his own admission he has been bearish since November. Adding shorts on every rally and he doesn’t have a single profitable leg. Nasdaq has made new highs higher than the March peak.
When the market is at all time highs, how can you short? Where do you put the stop? It is impossible and foolish. People here are calling for BRUTAL (his own words) decline, end of capitalism, etc. That is crazy.
We had months of sideways consolidation and we broke out. That means you go long with a stop. I remain bullish, I am 100% long on the 1900+ breakout. I have moved my stop up. On Friday 5/23 when I left, I said there is NOTHING BEARISH above 1885. Go back and re-read my comments in the Perfect Setup post. I said John is wrong. We will see 1950 before 1850. I even doubt we will see below 1800 this year. Nothing I have said has proven false or unreliable. Yet people blame the Fed, they blame the market, they claim manipulation. THE EVIDENCE IS HIGHER LOWS HIGHER HIGHS. People here are engaged in a massive self-delusion. My account is at all time highs. Am I smart money or dumb money? Does it matter? You trade the market you have, not the market what you want.
“My account is at all time highs”
Congratulations, you are right until you are wrong.
blah blah the last trade u did was a loser and it was a short!!! at 1900, so now we have you back with a winner and stop to break even, oh dear please save us
I shorted based on wave C = wave A, stopped out for 4 points by my own admission. We broke out to new highs, I went long. You obviously don’t want my help. How is your account doing? I called for 1950 target FAST on breakout, we got here in 2 weeks. What have you done for the blog?
Mate, have you ever considered that maybe other people know or see something that you don’t?
Great, you made some money going long at all time highs. You and every other man and his dog this side of the black stump!
lol, im not here to give trades out im here to read johns well thought out opinions on the market
Looks like you can invoke Alex Red spirit wherever on the net if you mention Tuesday always up:)
Short term prediction: All markets new highs before reversal.
John,
Always many thanks for sharing your thoughts. I’m very interested in the solar cycle vs. markets cycle hypothesis, and very serious to it. I’ve read most of your articles. Now I have a question:
The Sun is shining not only above America, but also above other places of this planet. We’d better have a global perspective to realize the Sun’s impact on us.
According to GMO’s research, global assets bubbles were so severe in 2007 that only 1929 could be used as comparison. In 2007, bubbles could be found in stock markets, real estate markets, commodities and fixed income markets in MOST countries. But right now, although the U.S and German stocks are expensive, there’s little sign of bubble in other major markets.
Ironically, 2007 was a bubble year of very low solar activities, and 1929 was a bubble year of very high solar activities. Can you explain this?
I can see this market going 20% straight up before we have an october crash – even thats’ not guaranteed. One cannot predict a black swan event.
As the ceo of citi group chuck prince said in 2008 in the aftermath of the financial meltdown, ‘whilst the music’s playing, you gotta keep dancing’ !.
Could the nasdaq re-test the 5000 2000 high?
It might be on the cards.
Have been following this thread with interest over the last couple of months. Firstly can i say that John’s dilligence in providing evidence for his assertions is astonishing. I for one do not have the capacity to do that level of research to back up any claims i may make here (So take them at face value). I believe in investing that for 99% of the time you need to follow the consesnsus (without heavy leverage) – to that end i stay long and continually to profit off the table (Not reinvesting as it were). Should the market fall / even massively i will only lose what i have on the table – I feel sure that i will get an opportunity should a ‘crash’ happen that i will be able to profit from it – I do not seek the riches associated with being in at the very top and catching the first 5% drop. I feel – and i have no evidence to back this up apart from visiting both bull and bear market web and research sites that we haven’t hit ‘Euphoria’ levels yet and therefore believe markets will test new highs over the coming months. You guys will be proved right and the market will crash eventually – I only hope you are still ‘solvent’ when that happens.
John have you added to shorts again today or waiting to see if 17000 is hit?
RUT 120 min – https://imgur.com/a3dp2iL – http://scharts.co/Tnfq2p
bears’s destruction
We own a lot to John as his analysis during last months was example of superb work. Maybe it was even too convincing and seductive as you could not resist such strong evidence. This is not the first time when analyst is too early in his big call. I believe John will be right sooner then later but it is still ahead of us.
Such kind of move like this week’s short covering rally has low probability of direct continuation in hyperbolic manner. This is not late 1999. I expect market to retest previous resistance in 1890-1900 zone in next week or two. Then we may see weak rally into July and early August and then it should end. Probably it will take lot of fake moves up and down when agonizing. Bears lost too many chances since January and there is no catalyst for reversal yet. I believe it will be geopolitical event that finally breaks this market.
Bulls are milking it while they can. I doubt there will ever be as a good a bull market as 2009-now again. I’ve stopped predicting where markets will go next as I’m pretty much crap at it.
That is a good observation/analysis Bunell. I ran the EW analysis on SPX and my results are not too far off from what you are suggesting.
Agreed that John is probably a little early with his timing, but his technical indicators are right on. I have been a bear since April and closely followed his great analyses. Have to admit that my timing is too early as well.
For entertainment, here are some interesting results of my EW analysis, wave 5:
Best Case Scenario: Markets continue hitting new highs on Monday 06/09 and Tuesday 06/10, then start declining on Wednesday 06/11. More sell-off on Friday 06/13. Major corrections will start occurring around 06/20. Actual crash will take place some time towards the end of July/ early August.
More realistic case scenario: More likely the sell-off will begin after the FOMC meeting, during the next couple weeks when Dow could retest the 16,000 level, then bounces back to the current level around 17,000. The actual crash will be late September/early October.
Just my two cents.
And John, I am with you as taking the other side of the market. I have increased my short positions today and will short higher if the markets continue creeping up next week. The crash is imminent and history is in the making.
A total fail searching to fight central banks’s action.
My two sense is 1960ish (if 1950 isn’t good enough) should hold it and be followed by down into end of quarter to put a tail an this.
http://redlinescenario.blogspot.com/2014/06/ideal-top-tuesday-june-10-at-spx-1960.html
Hi,
The crash of financial markets occurs within 2 years of solar minimum, said John. And every prudent reader here agrees the imminent crash is a major one, which may last for at least 8 years before recovery. If so, there is a long agony of waiting ahead until the crash in 2018 or 2020, followed by a long recovery which may cover most of the cycle 25. In view of this, shouldn’t we focus on what to do next, instead of shortening against the worsening economy all the way? So, an ideal prediction should be able to simulate the future trend within a year. In most bad years, there are ups and downs. And more so, you should know the trend of your own lot. (You may not make money when the market rallies.) I don’t think solar cycle tells you this. It is a general macro picture, not specific enough to guide an individual through a perilous jungle.
Scott,
John says around Solar maximum we get equity top (1989, 2000 etc) and solar minimum gives recession-bottom. Though personally, I strongly believe in presidential cycle and do expect real bubble phase in Dow/NASDAQ in end 2015 or beginning of 2016 before top but no one knows the future and John could be right and may be we are near top?. Also, even if we are to see bubble in 2105 we need 15-20% correction between May to Sep 2014 as per same presidential cycle so he may not be totally wrong?
no correction till the end as in the most classical bubbles
I agree with your outlook Jigs. There is a correction of 15% on the horizon. But higher into next year. Bottom around Sept/Oct time.
Jigs,
Buy in July, Sept or October 2014, and sell in Jan, Feb or March 2015. Buy in Aug or Sept 2015, and sell in Aug 2016. 2019 will see the bottom. These are my guideline. I would like to hear your comments.
Scott,
See Presidential Cycle year wise from seasonalcharts.com http://oi62.tinypic.com/346272q.jpg
As per this cycle between Oct 2014 to Sep 2015 we may big rally.
Thanks!
I looked at the Presidential election cycle but don’t give it much weight. If you look at an average of charts, it says one thing. If you look at the actual charts making up that data series and try to come to conclusions after reviewing each chart, I wouldn’t put my money down based on such flimsy odds.
Have a look yourself:
http://stockcharts.com/freecharts/historical/presidential.html
Most concerning development for the bears in my opinion:
After being rejected from strong multi-year resistance (some called it “jaws of death”) since January, Dow seems to breaking out on weekly. Either this is great fakeout that will end badly or this means that we enter entirely new era (possibly hyperinflation ?).
Will we see VIX in 8-9 range this summer ?
I saw this too. Price needs to get back under the trendline fast in order in order for it to be a fakeout. I.e. this upcoming week!
Does the “madness” indicate an upcoming moon effect inversion?
Next Thursday & Friday could be all time ”madness”.
Madness is nothing new you know.
It travels in waves.
Only earthquakes can create waves in rock.
(who said there are none so myopic as those who cannot see very far?)
Hi John,
I have now officially joined you in the bearish camp, from
Friday’s close of 1949 on the SPX, primarily due to the
configuration of the VIX:
http://goldwavetrader.com/volatilityreversion.html
For me, this is only short-term; Having said that, I do see
the potential for a drop down to the lower daily Bollinger
Band on the SPX, which is currently at the 1859 figure.
The position of the advance/decline line would favor that
correction to be followed by higher highs, upon completion.
How are Tom’s exhaustion levels now looking?
For what it is worth, don’t fight the battle now and lose the war. The Nasdaq 3/2000 peak was inline with the solar maximum, but there was infinite whipsaw until 9/2000. I do think that the Russell might have made a similar peak earlier this year, but it might be prudent to save some ammo for later in the year. I am not saying to go long, but to expect low volatility consistent up days or periodic rapid short covering spikes (after down days) to continue.
market is in superbubble territory…but we are in a new bull market (thanks to liquidity) and a severe correction could happen after a sharp rise. What game we are playing? a loser one or there some possibilities for a downside? FED and big banks are squeezing shorts like I said some weeks ago.
http://stockcharts.com/h-sc/ui?s=SPY&p=D&st=1998-01-01&en=22222-09-09&id=p03429138756
Simon, I keep reading similar comments,
however just take a look at the dividend increases
over the past year from Microsoft or Coke.
Does the Microsoft PER suggest a superbubble?.
We still have record earnings and increasing dividends.
You can make a correction case, extreme investor bullishness,
ultra low volatility, duration since the last meaningful correction ..
However, I do not see conditions in place for
a new bear market.
Record earnings and dividends keep being ignored,
by bears, when they begin to come under pressure
everything changes.
I’m not calling for a new bear market, read better. But “rising dividends” as a whole is not a true fact and the dividend yield for sp500 is 2%, low level in history but tech bubble. Earning are not growing or growing at 3-4% y/y at best. We are in a liquidity bubble…if market continue to rise so quickly we will arrive to a crash (twenty percent in just a month).
From the bears’s point of view let’s to be said that this market is really dangerous because trend is intact and what they are hoping for is based upon metrics that in this distorted market had less worth than in the past.
http://fat-pitch.blogspot.it/2014/06/historically-decline-in-earnings-caused.html
VIX has traded below its 60 days moving median (currently at 13.37) for the last 36 days.
In its nearly 6000 days history, there have been only 3 such runs in a low VIX environment. There are another 17 such runs but all after a volatility episode.
These three runs ended on: May 20, 2013 (67 days), July 25, 2005 (53 days), May 08, 2007 (50 days).
the real problem is fake central demented… this is the only game working to build the giant bubble
http://www.zerohedge.com/news/2014-06-06/5-things-ponder-central-bank-edition
PHIL WHITE…
record earnings and increasing dividends, eeerrrrrrmmmm maybe thats because of all the record amounts of share buy backs oh and where does all that money come from to buy the shares yep record levels of debt!!! and its not healthy the way these earnings are coming from cost cutting and very low capex, the top line is just not growing
short term trade, spread bet magazine have gone short on Friday, they have a superb track record since they started their blog 2yrs ago
Hi Robbie
Could you please tell us the url of spread bet magazine blog ?
Thanks.
robbie, as I have posted several times you can
make a strong current case for a correction.
In my view this will provide another opportunity
to buy the dip for a probable last leg up of this bull market.
As we are now in the 6th year of one of the most
powerful bull runs in history, it’s not a big call
to predict significant % falls at some point.
However for a call to be a good one and for it
to be profitable, the timing has to be pretty accurate.
And this market has already destroyed many bears
who’s timing was out.
Many of the commentators who are referenced
frequently on here predicting “the top”
have consistently been incorrect.
It makes no difference why, blame the FED,
the ECB etc, an incorrect call is an incorrect call.
Couldn’t agree more.
Tops are a process and this can be seen very clearly on a long term chart of the SPX. A longterm bear market like 2000/2003 and 2007/2009 had a year where price whipsawed between a 10% range. Then came the plunge. This is different to the mid bull correction i.e. 1998 / 2011. Both these correct by approx. 20%. Given that this bull is now over 5 years old chances are we will whipsaw between 10% until a high is made.
Duncan, agree with that, currently I am
in cash and the market looks dangerous to me.
However equally dangerous is taking a position
on trying to time a near exact top, eventually
some will time this perfectly, as always happens.