
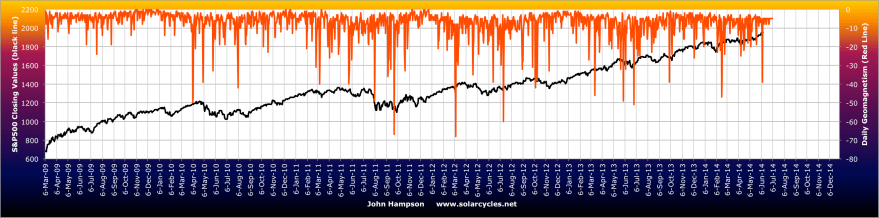
1. Sornette bubble end flagging and potential ending diagonal overthrow price pattern on SP500:
Source: Financial Crisis Observatory / my annotations
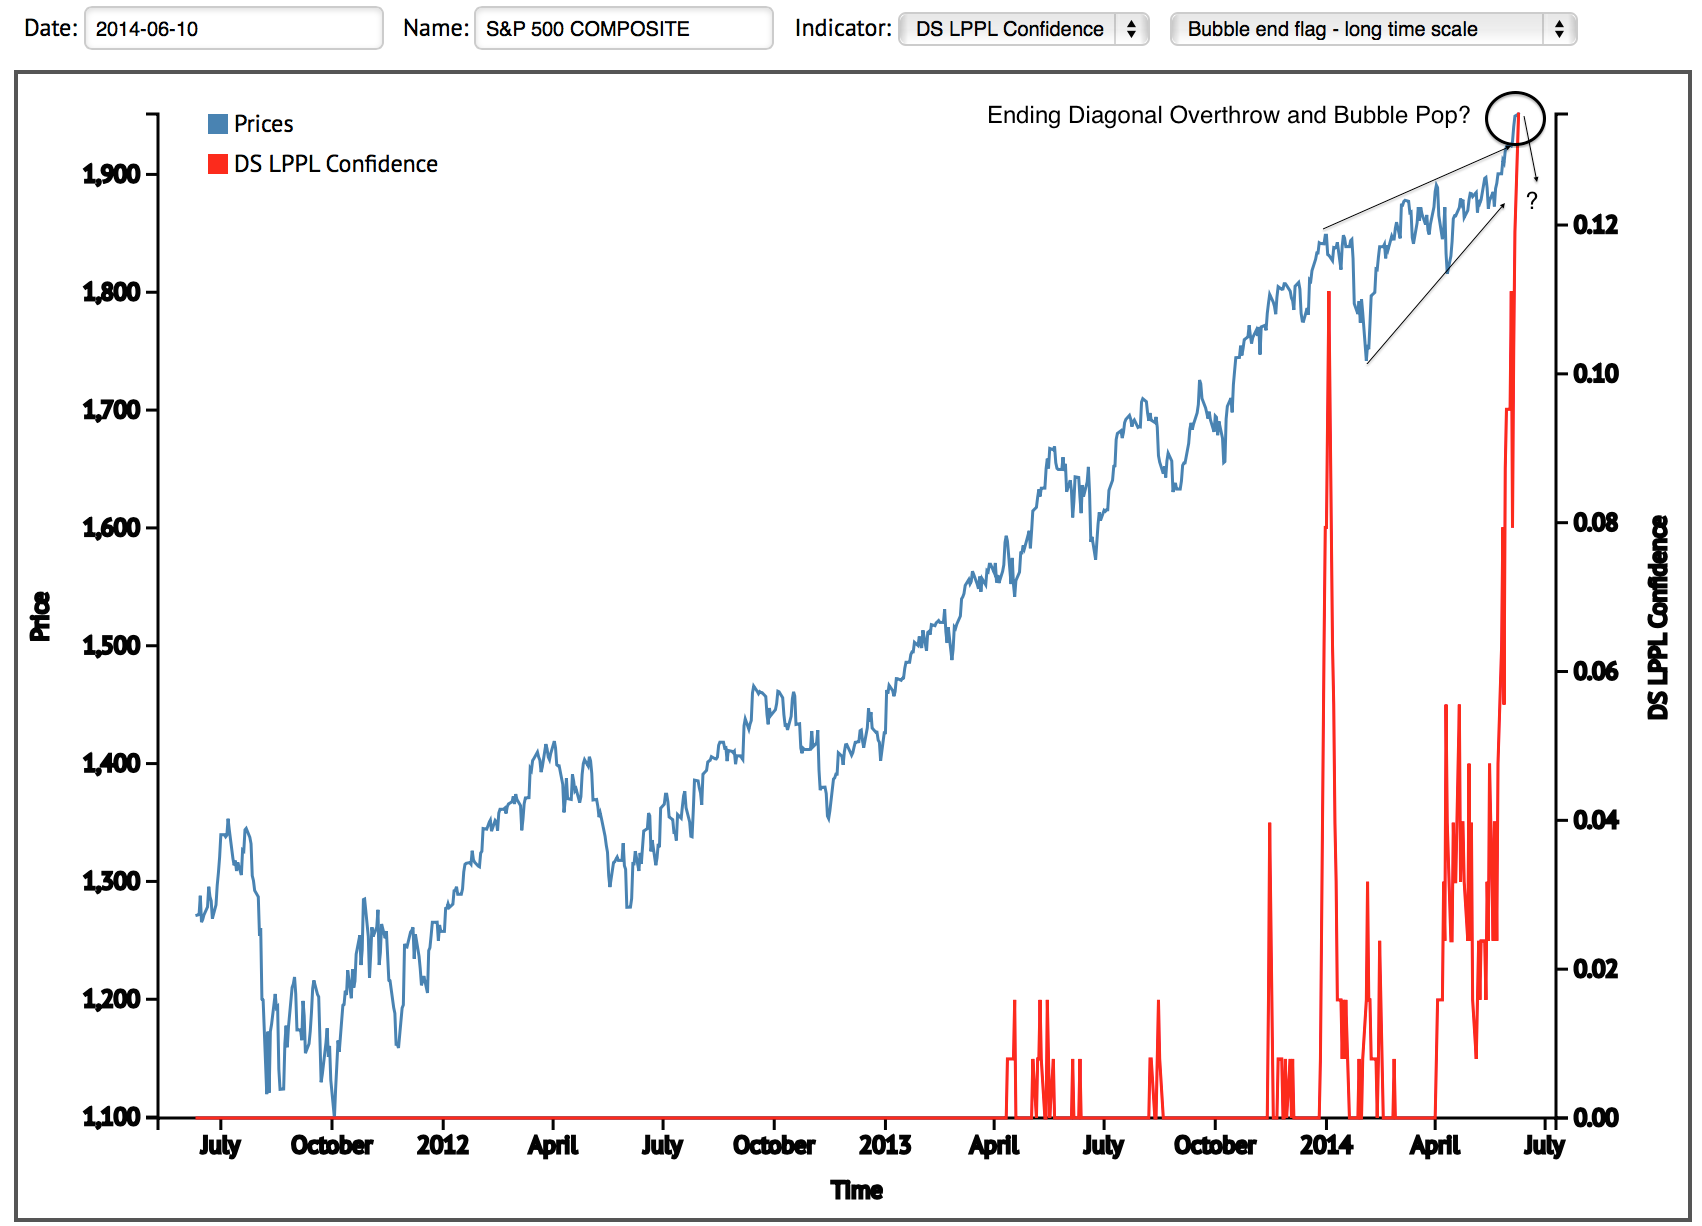
2. Dtrend flagging uptrend exhaustion:
 Source: Rory Handyside
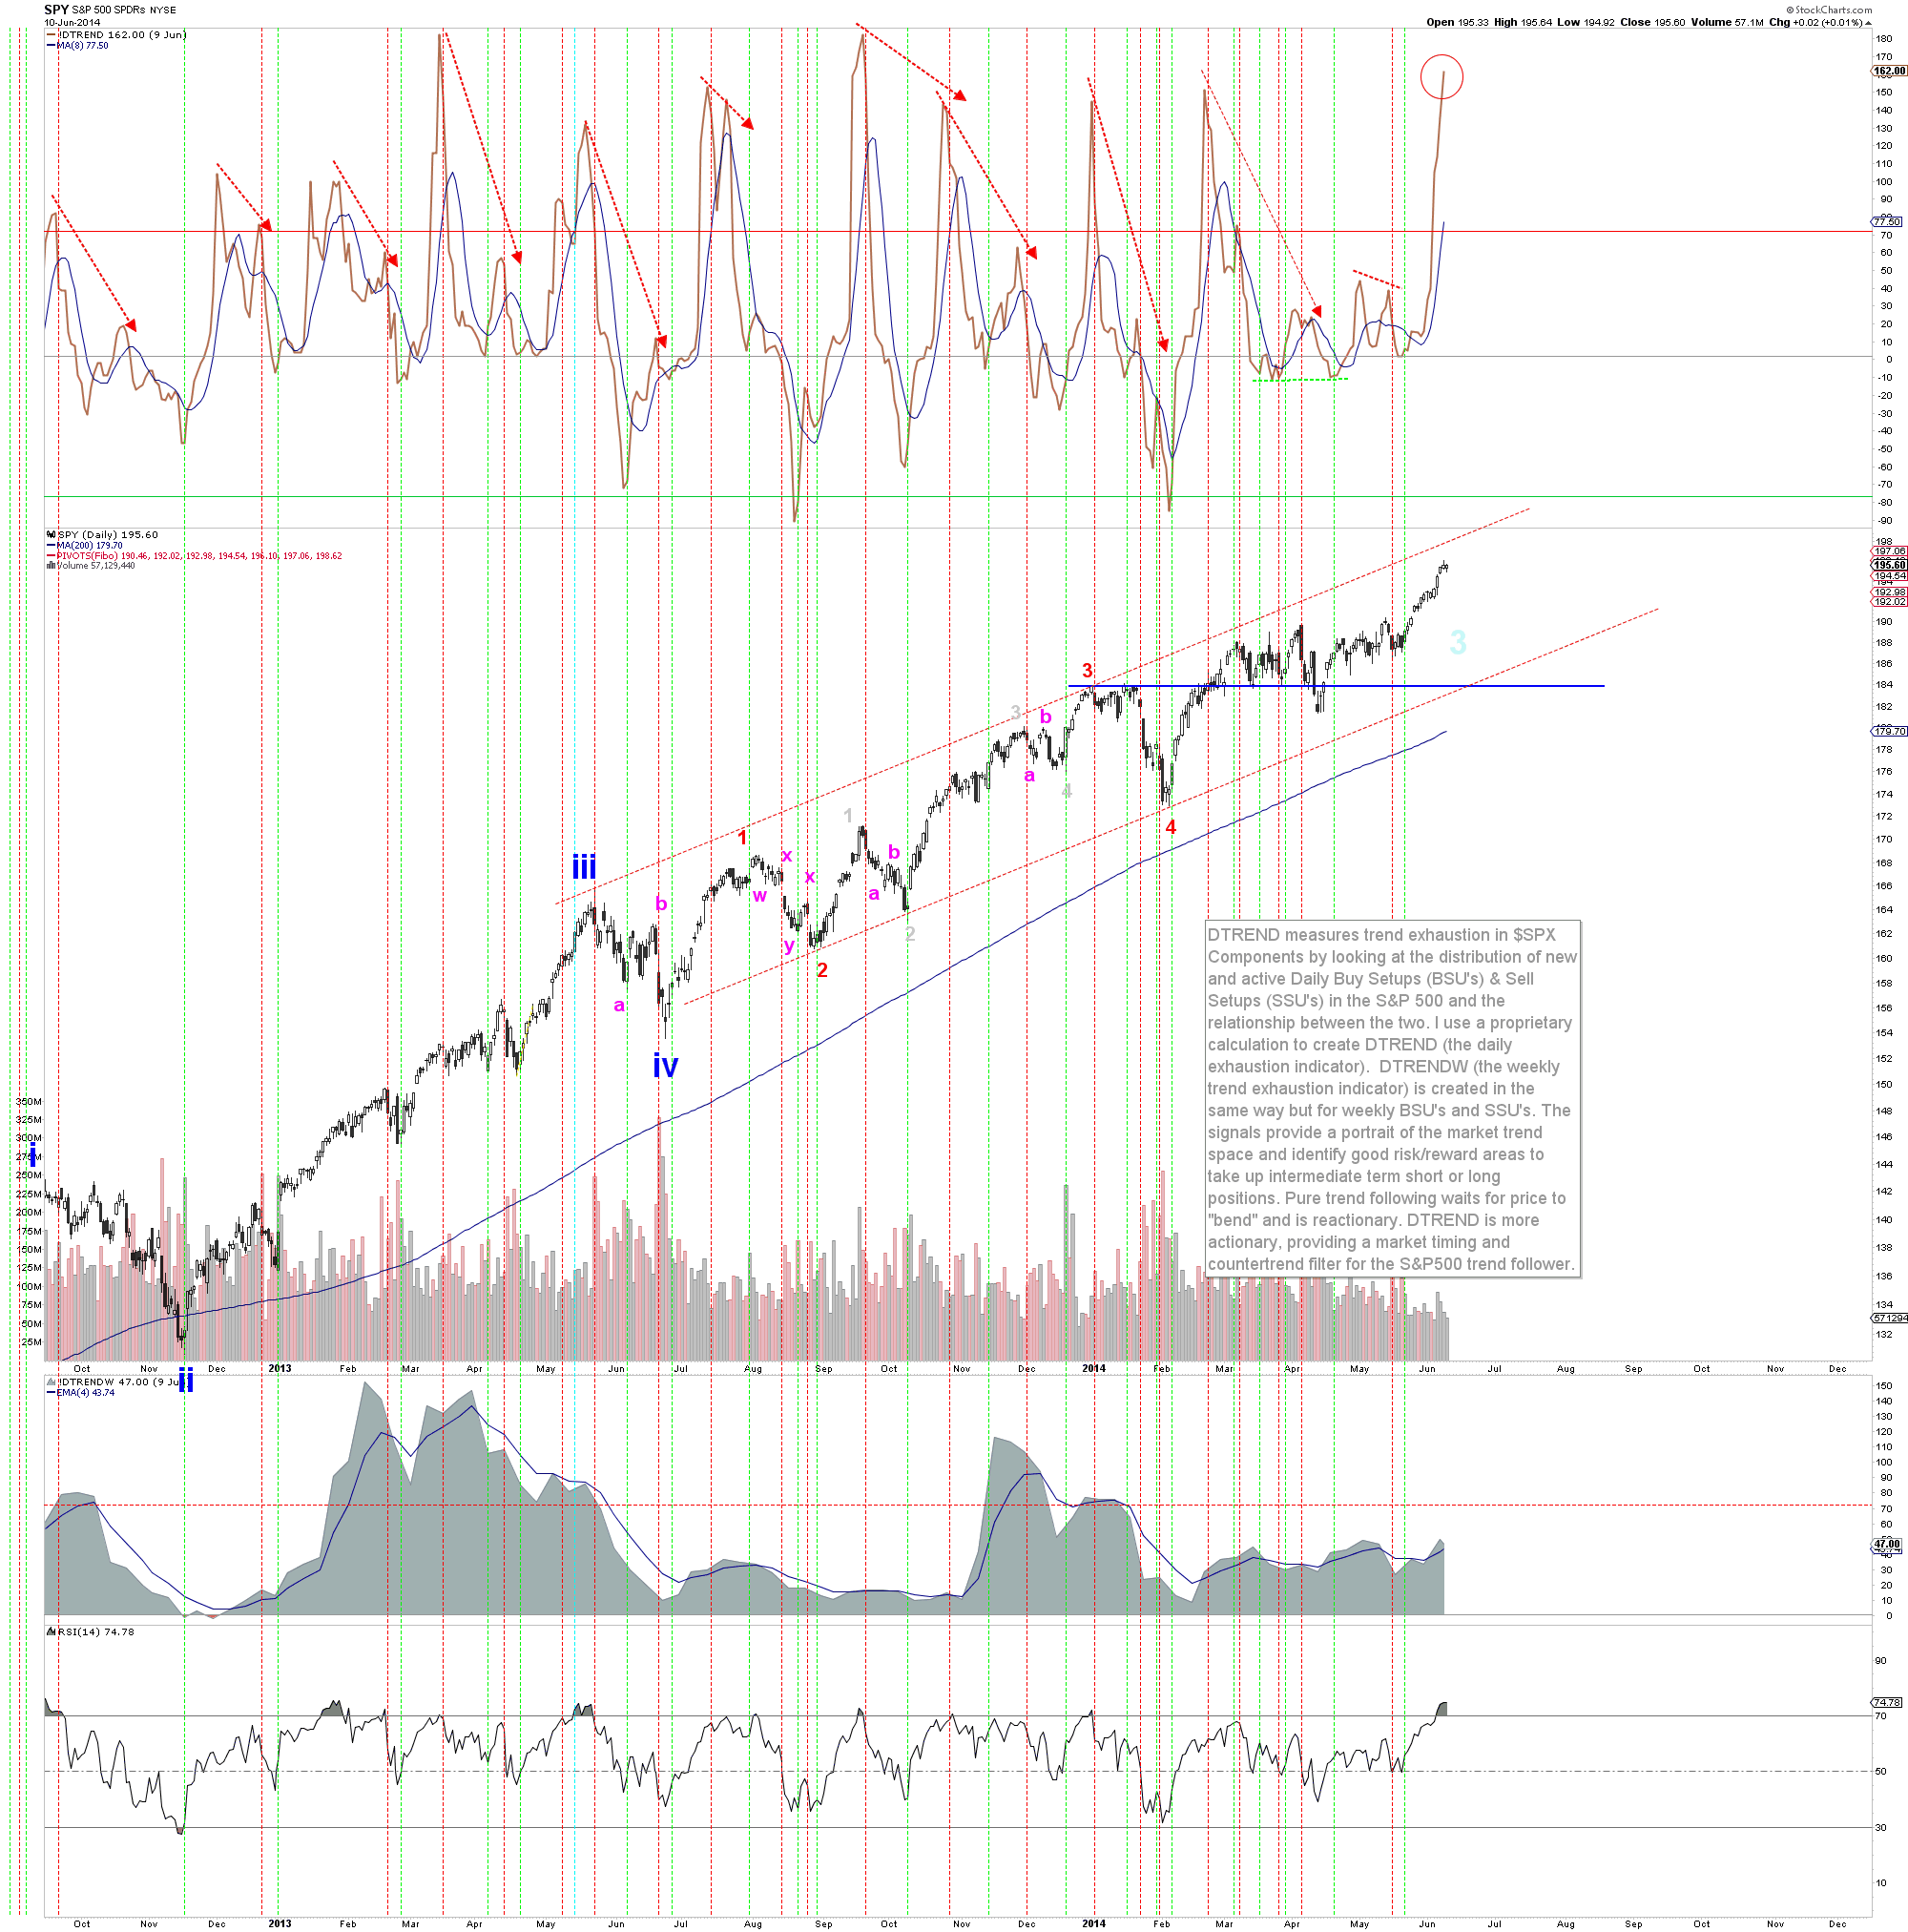
3. P/e over Vix ratio at peaking level:
 Source: ZeroHedge
4. Put/call, volatility and volume collectively suggesting an inversion: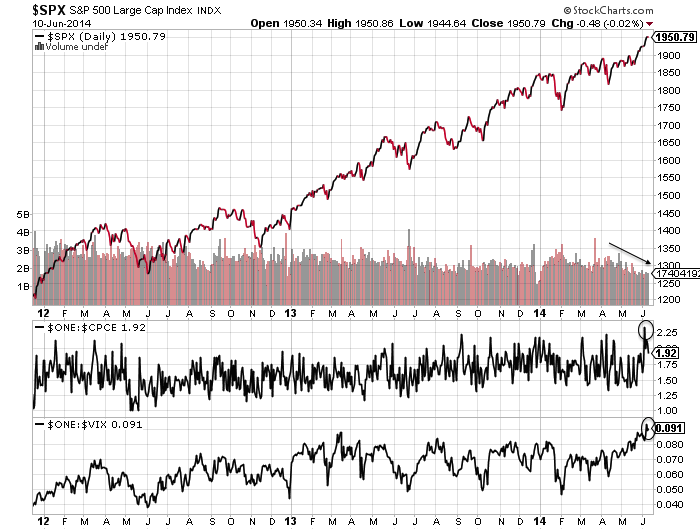
Source: Stockcharts
5. Sentiment at lop-sided extreme: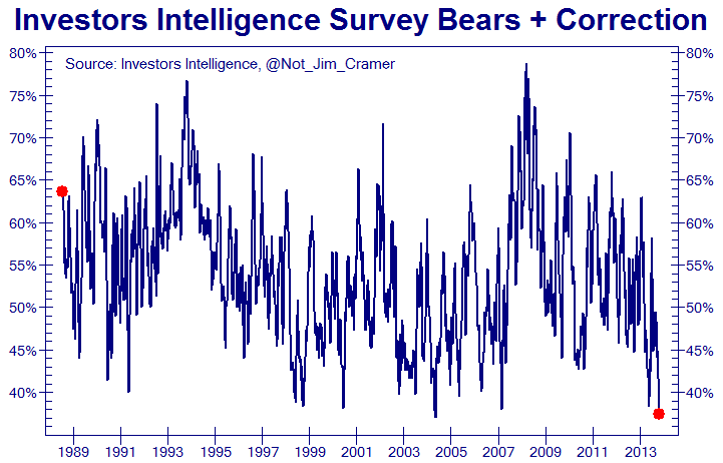
Source: Not_Jim_Cramer
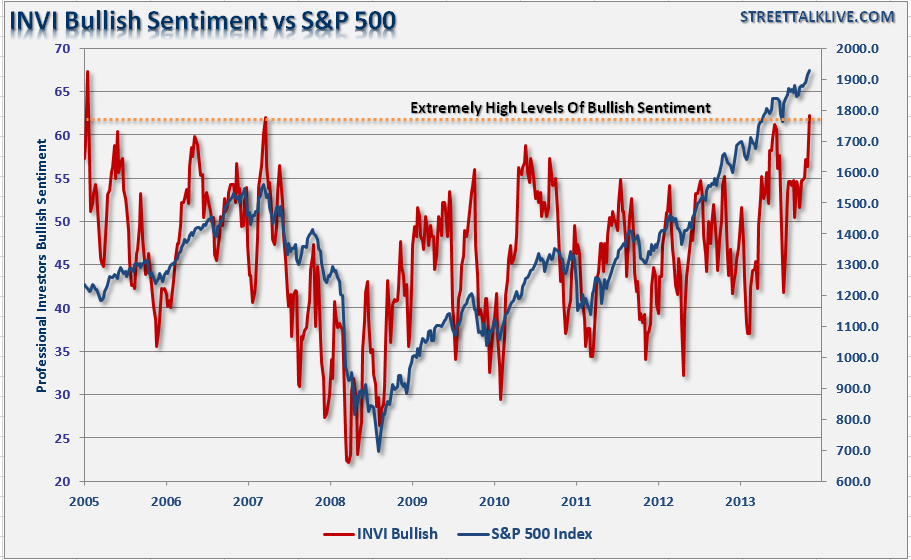 Source: STA Wealth
6. Junk bond spreads divergence as per the 2011 peak:
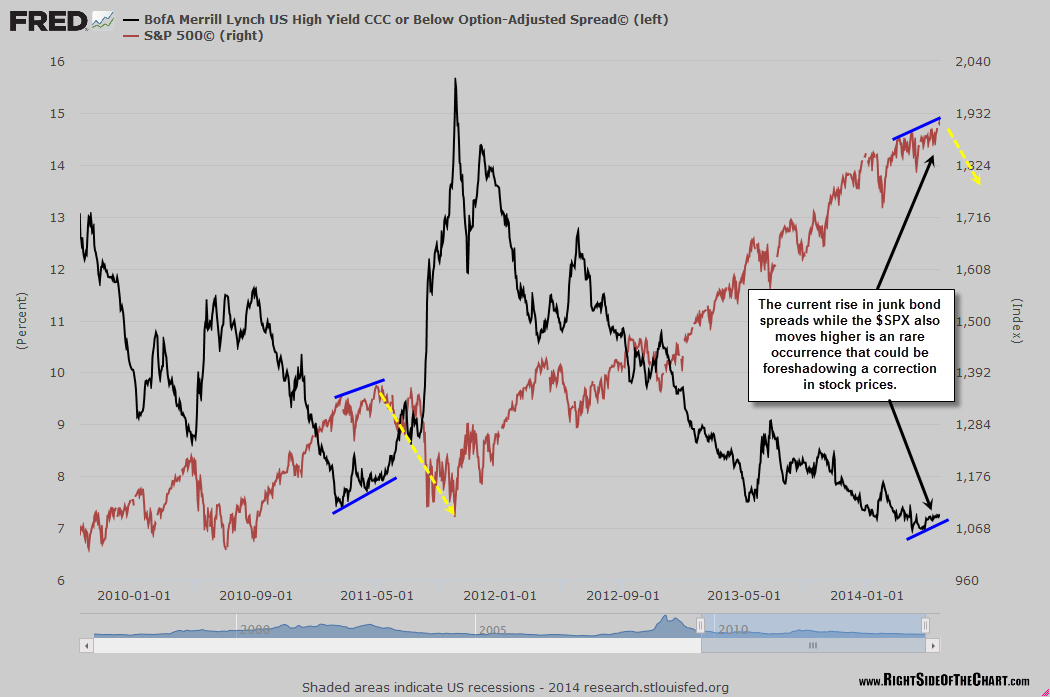
Source: RightSideOfTheChart
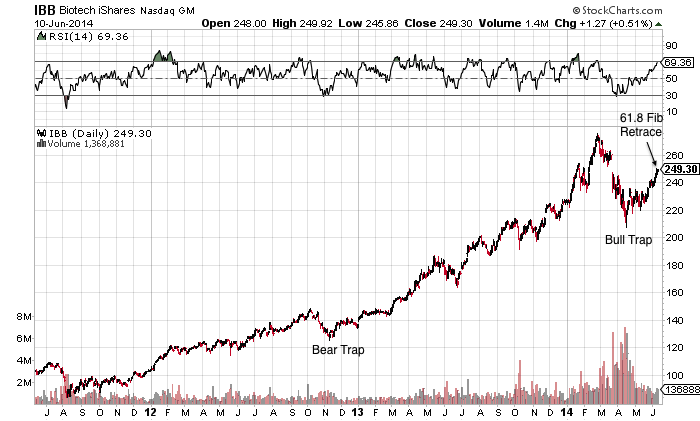
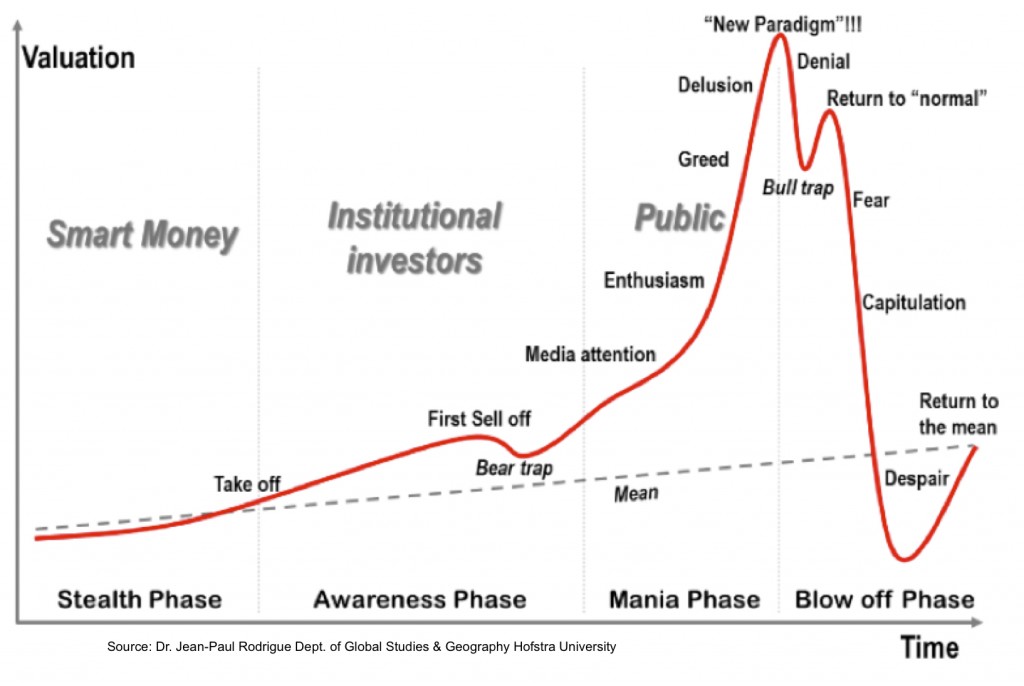
7. Biotech has made a 61.8 fib retrace of the decline from the parabolic peak, as a potential lower high per the bubble anatomy model:
8. Rydex data provides another example of the peak in leverage now being in the past, which along with margin debt should mean the markets are on borrowed time:
 Source: Sentimentrader
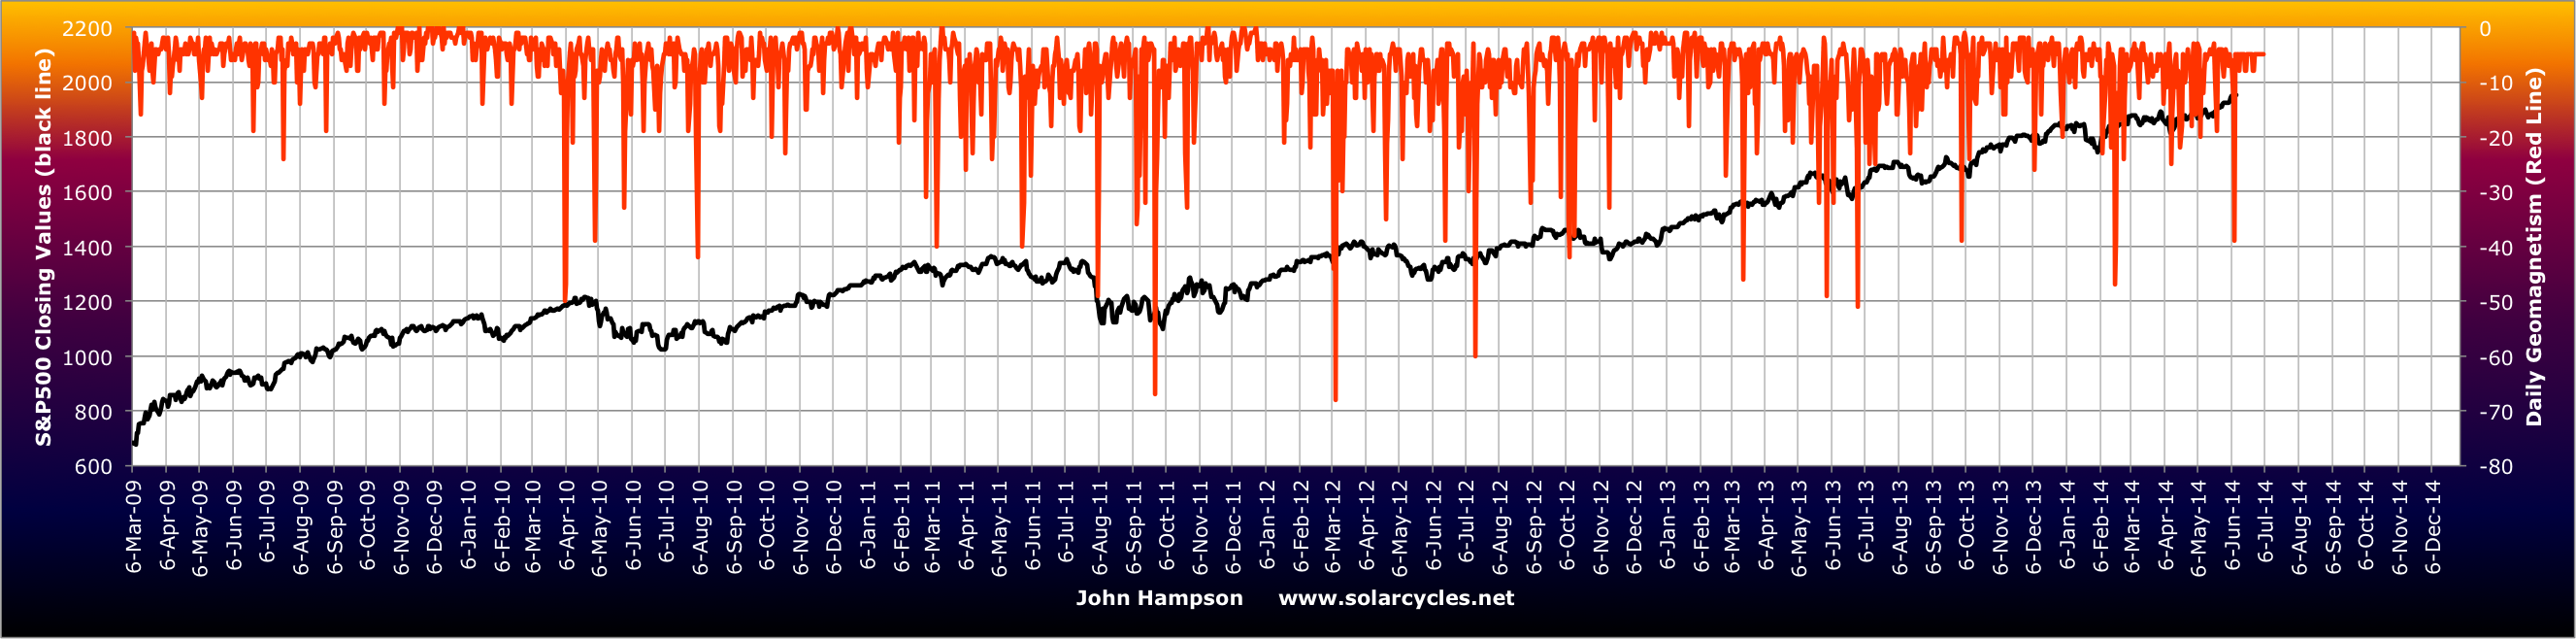
9. A geomagnetic storm hit at the weekend and we are heading into this coming Friday’s full moon: twin negative pressures on sentiment.
10. Economic surprises are negative in USA, Europe and China:

Source: Citigroup
11. 75% of companies in the US that have issued earnings guidance for Q2 2014 have issued negative guidance.
12. Gold and silver short interest at levels suggestive of a rally in precious metals, which would fit with a decline in stocks.
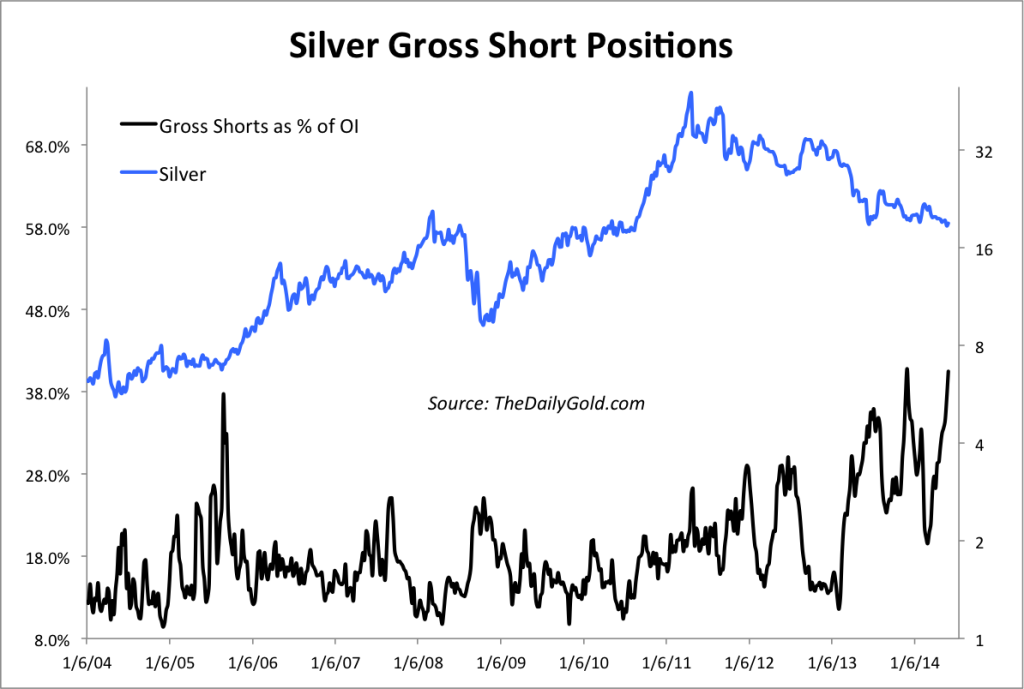 Source: TheDailyGold
In summary, it’s another compelling set-up. Whilst I cannot rule out stocks breaking higher and going crazier yet, I have to doubt whether sentiment, complacency and bubble/froth indicators really can get more extreme. As per my Sunday post, Piecing It All Together, my primary case is for this being the last piece of the topping process, particularly so in honouring the combined February peaks in the sun, in margin debt, and in RUT, IBB and COMPQ, i.e. lower highs here are important. If selling can initiate here, then exit will be through a keyhole due the lopsided all-in extremes.

that said… psychologically-wise, SP hitting 2000 might be a milestone that may spur even more euphoria, I remember similar talk with the Nasdaq when it was around 4000 during the .com bubble, “smart” investors warning “stupid” investors that putting their money in internet stocks was crazy if not outright irresponsible, and yet after some consolidation Nasdaq still went from 4000 to almost 5000 pretty easily. Again, I’m not talking technicals here, simply saying that the market rarely does what “smart” people expect it to do. Personally I’d say exit longs to be on the safe side but don’t go short quite yet…
It’s about trying to measure all-in or fuel to go higher. Not easy, but various indicators are suggestive of it.
Thanks John, once again you amaze me.
Interestingly the DAX this morning has broken down under the 10k level and decidedly so.
Intersting also that you mention Ag as I am also buying more physical silver and gold here and taking a few contracts.
Cheers
A link to spooky stuff
http://www.theidiotandthemoon.com/eyeofra.html
Thanks
Allan, looks like your call of the inverse head and shoulder on GDX is strengthening, congrats.
Hi John! good read, as always. like I noted before, I am with you now
on the bearish side, short from last Friday’s close of 1949 and having
fingers crossed, primarily due to the VIX
http://goldwavetrader.com/volatilityreversion.html
now that we are both on the same page, we could both be in trouble 🙂
Jim
Good chart, thanks
John,
I’ve been looking for something else that indicated a change on 12/31/13.
Have you seen this chart?
looks like a significant change to me
Thanks
Only concern is that usd gets stronger here. Not great for gold and silver.
Though certainly not usual, Gold and USD rising together did actually happen in certain periods. A very interesting signal to the market when it did.
John/group:
Here’s some additional analysis on the purported ending diagonal. Also, on the VIX.
I think he was on that horse for many weeks.
http://www.safehaven.com/article/34101/spx-rip-the-ending-diagonal-equity-bears-have-been-defeated-once-again
Where do you find Sornette’s graphs like this one???
http://risikopedia.ethz.ch:2375
wow dow down 120pips i didnt realise it could go down
3 x flares in a row http://www.space.com/26206-sun-erupts-3rd-huge-solar-flare.html
Thanks for a good consolidation of data, John.
In addition to the elevated silver gross short positions (Managed Money Short & Swap Dealers Long – all at record high), here is a well informed article to add value to the bullish call on PM.
“A Bear-Raid on Gold – Is that about to happen?”
http://www.mining.com/web/a-bear-raid-on-gold-is-that-about-to-happen/
Near perfect conditions for a correction currently,
over to the bears now to see what they can do.
The most recent stock peaks, particularly for the DJIA, sat nicely around major milestones. The rounded peak around 1999 and 2000 saw the Dow end its bull run, around 11,500-12,000 points
The 2003-07 run ended, with the Dow briefly settling around 14,000 points. The Dow could possibly surge to 17,000 points this time, just to accentuate the heights of this bull, before it corrects.
Rate rises would be great news for the USD, pushing Gold down, but could also weaken the economy, if they are done too soon. Tapering has slowed the Dow’s advance, since December, rate rises could actually kill it, if they occur by the end of 2014.
Nice post. There is a triangle in the middle of the move off the 2009 low. A triangle in that position is bearish. The return of the bear was delayed in 2011 with that triangle. This, the 138.2, is where the bear should return. Dow 17150.
Thank you John for your blog. Has always been one of my favorite reads.
http://redlinescenario.blogspot.com/2014/06/end-of-bull-market-i-will-return-in-2016.html?m=0
Appreciated SJ
I am following so many sites, but I have to say John’s analysis is the most compelling and insightful work. Thank you very much John for the great work and for sharing it with the rest of us investors. I think your timing this time is impeccable that the markets are on the verge of major correction. It appears that the crash is unlikely, a gradual but major correction between 20%-40% of the current Dow is imminent. I could start as early as 06/13 or 06/19.
Thanks Erick
FWIW…I have 4 daily systems using various criteria…all are now bearish following today’s action…
John, Great collection of interconnected charts, In time you will have all plotted into one perfect timing model. Currently I have noticed a relationship with dollar/ yen, silver / gold and VIX. All merging. Add a little superstition- Friday the 13th and look out below.
Thank you! John for all the great charts and data.
Here is an Elliot Wave prediction of the RUT futures contract, right at the top of wave 2 at around 1182 made a few days ago. A big wave 3 down is next http://elliottwavepredictions.com/
Thank you all
Slightly surprised we haven’t seen much of a move in oil on the back of this action in Iraq.
Another great article John. My own thoughts are a small pulback into July, then new highs in August (17k+) then a correction in Sep to Nov
Thanks
It appears the days may be numbered of that outdated method of fixing the gold price via the London Gold Fix.
If ever there were a system open to abse surelynthis has to be it?! (rhetorical)
https://uk.finance.yahoo.com/news/osbornes-market-clean-too-little-215621472.html
Right on.
“The Shanghai Gold Exchange (SGE) – the world’s biggest platform for physical gold trade – is in talks with foreign banks and producers on the new exchange in the city’s pilot free trade zone.
The exchange is set to launch physically deliverable gold contracts, with the metal allowed to be stored in vaults in the free trade zone.”
http://www.reuters.com/article/2014/06/11/china-gold-shanghai-idUSL4N0OQ0HP20140611
Solar flares over the past 24 hours have created a coronal mass ejection that could hit earth on Friday. Scientists expect it will create a mild geo-magnetic storm. Does this have any significance with your analysis?
Yes if it hits – they are negative for sentiment
hi john,
how about some analysis on indian stock market, its roaring mighty with huge volumes, crash alert in view or not. will be very appreciated. also kindly if you can share your email id.
Rgds,
avinash
Email is on About page. I don’t follow the Indian market closely, sorry.
China could fall 30% from here if pattern completes:
http://blog.kimblechartingsolutions.com/2014/06/pattern-suggests-china-could-fall-30-if-so-impact-sp-500/
Backtest of 1890-1900 zone in S&P approaching. Either we will see strong support there or all hell will break loose immediately. There will be some fight for sure.
Gold looks like it may have bottomed, I would like to see it above 1300 next week.
Art Cashin on CNBC said the last full moon on a Friday the 13th occurred in October 2000, when the “dotcom bubble was exploding.” The next one after tomorrow won’t happen until 2049.
Iraq could be the Black Swan event that sets things in motion.
Just like the Marco Polo Bridge incident on July 7th 1937 that marked the start of the Asa WWII?.. The market picked up another 5+% until it crashed in August….amid the Spanish Civil War. Bulls don’t care until it matter (after smart money sold?)
US futures making strong recovery already. Let’s hope that 1.5% fall wasn’t the entire pullback! Iraq will be a non event like most geopolitical issues but should drop markets by 5% or so and that could result in the start of the drop John predicts. Today is Friday 13th full moon and bears need to really hit it hard today otherwise it will just add to the bull optimism.
None of the breaches of the DeMark SPX 1931 target have properly been stopped out.
Any subsequent down daily close that is followed by an up close that is above 1931 – and then gaps higher the next morning (and the opening print is not the high of the day), would constitute a proper stop out.
That has yet to happen —
http://www.peaktheories.com/is-a-super-spike-setting-up-in-the-vix-.html
LOOK AT THE DATES, AND SIMILARITY
ALSO THE TIME SPAN LOVELY FRACTAL, WILL IT REPEAT
And for further confirmation…wave 5 of wave 5 of wave 5 for real…
I think the trend will continue and this analysis is the same as it has been for the last few years
The latest on the solar mini-max:
http://news.yahoo.com/solar-mini-max-erupts-quiet-sun-finally-hits-112812802.html
Looks like Dubai market peaked in April:
http://www.zerohedge.com/news/2014-06-23/dont-buy-dubai-ipo-bubble-bear-market-2-months