
The rally in equities persists. The momentum continues but the warning flags are increasing, in a fine balance. When we eventually pull back, I maintain this should then be followed by a further higher high, but with divergences and weaker internals, to make a topping process. UBS have echoed this in their chart here:
 Source: UBS
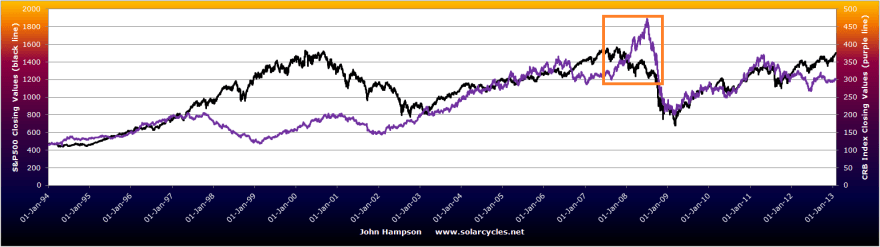
I have predicted a scenario ahead this year similar to 2007-8, marked by the box below. When stocks made a topping process in late 2007, similar to the distribution patterns shown above, commodities only made their parabolic acceleration once the equities topping process was underway.
 Both energy and basic materials are late stage cyclicals, which mean they are typically amongst the last sectors to rise and top out, and are reflective of commodities gaining momentum usually later than equities.
I am suggesting that there is a possibility therefore that we need first to see equities entering their multi-month topping pattern before commodities truly accelerate. Once stocks pull back, after this current rise, I believe that process will have begun. The question is how far and how long equities can rise in the mean time, and it’s a difficult one to call. If the pullback were to begin today I could point to a handful of indicators supporting that. Yet, as noted in the last post, both overbought and overbullish readings can persist for a little while before a pullback. So I watch and wait.
But back to commodities. Oil is the outstanding performer of the moment, most other commodities are lacking momentum. I previously studied commodities peaks and solar peaks in detail (here), which revealed that commodities should typically begin an acceleration around 12 months before the solar peak, which is currently forecast for around September of this year, but that commodities typically make their parabolic peak after the solar peak. Drawing that analysis together with the above, I would suggest that commodities, as a class, are overdue a momentum move, but could need equities to lose momentum and begin their topping pattern before commodities take over.
There is historically a close correlation between commodities. Below are shown food and oil. If oil can maintain its recent strength, food should follow (oil is a key input in the agri process).

Source: MD Briefing
Food and gold prices also have a close historic relationship, as shown in this previously posted chart:
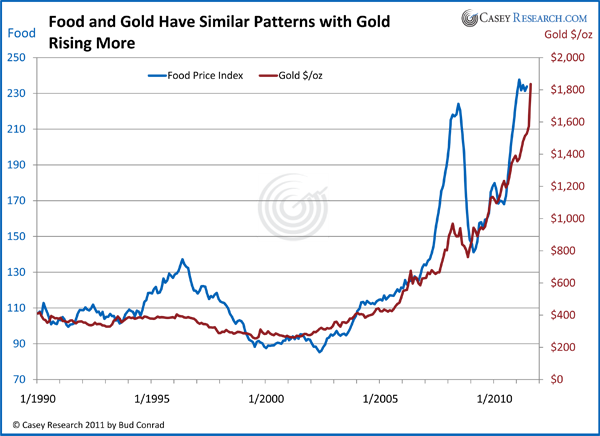
Source: Casey Research
Yet there has been a disconnect in the last 18 months between gold and general commodities, shown here:
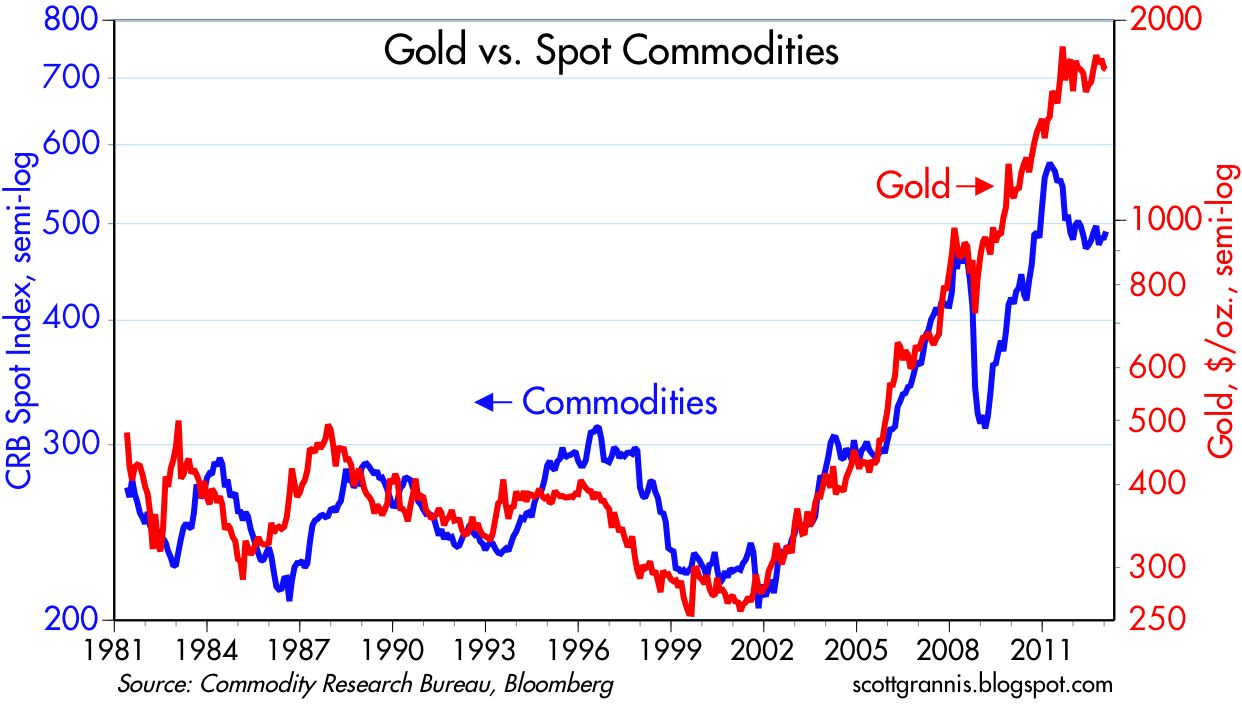 Source: Scott Grannis
This helps to explain why gold in particular is struggling to advance, as other commodities need to catch up (or gold pull back). So let’s see if oil is taking a role as the leader here, and that foodstuffs will join in the rally, and then precious metals.
Gold miners made what looked like a high volume capitulation at the end of last week, which together with very negative sentiment puts them in a good position to reverse trend here. But a reversal in gold itself is of more importance, and aside relations with other commodities, we can also look to the US Dollar and central bank balance sheets as a driver. Here is Euro-USD and Fed balance sheet modelled together versus gold:
 Source: Nordea / Bloomberg
In 2013 the Fed balance sheet is forecasted to expand significantly, based on its QE plan, and currently the Euro is technically bullish versus the dollar. So here is a potential catalyst for gold.
Real interest rates are also important for gold. With treasury yields rising currently but inflation fairly tame, the real interest rate trend is going the wrong way (even though real interest rates remain negative). However, a rising oil price has the potential to push on inflation and turn that trend back. Rising agricultural commodity prices would also push on inflation, and this brings us back to the feedback looping between commodities. Essentially, we need oil to maintain momentum, or, say, agri commodities to join in the momentum, for the whole complex to begin the feedback looping which should result in a parabolic finale.
A reminder of other factors. The solar maximum later this year should inspire more speculation into commodities, but also protest and war. Rising food prices typically play into the latter. The NOAA climate chart that I displayed last week showed a trend that, if still in tact, could produce a record hot year this year. If so, that would be a big push on agri commodities. And by history, the secular commodities bull should end in a parabolic mania of some degree. Below is the equally weighted commodities index – did we see that mania into the start of 2011, or is it still ahead?
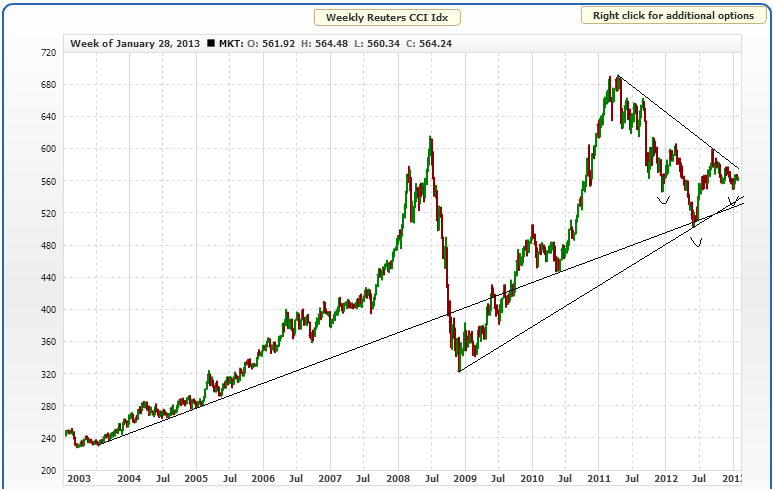 Source: MCRI
I have marked on the chart an inverse head and shoulders pattern, formed throughout 2012, that could potentially catapult commodities upwards and out of the triangle to give much greater weight to the ‘peak ahead’ camp. Alternatively, a break beneath the secular support line would make the ‘peak was 2011’ view the convincing one.
I believe the conditions are still right for the secular commodities finale to occur in 2013, potentially making a final top by as late as H1 2014. Economic data, leading indicators and US dollar fortunes all need monitoring in order to nurse those conditions forward, but it really comes down to whether commodities can now gain momentum in that relatively supportive environment and then build to a speculative climax. I am itching for that collective momentum, but as outlined above, we may need to be patient a little longer whilst equities ease out of their momentum and into a topping process, handing the batton over to commodities and the late cyclicals.

A side comment here – did you know that one of the most famous technical analysists – Welles Wilder (who invented RSI, ATR and other legendary indicators) was later in life a solar/lunar trader? Here’s a brief profile:
http://www.stock-trading-infocentre.com/welles-wilder.html
He discusses his solar/lunar theory in the book The Delta Phenomenon, where he claims the market follows a 4-day cycle, a 4-month cycle, a 1-year cycle, a 4-year cycle and finally, a 19-year cycle based on lunar and solar influences.
He makes some big claims for this system:
“I use the best trading system I ever developed. It’s called the Delta Plus system. It makes over 100% a year, every year, trading eight commodities. It is available only to members of The Delta Society International. It uses, among other things the Volatility System and the Parabolic Time/Price System”
“I have two accounts. In one account, I follow the Delta Plus System on the 8 commodities exactly, no matter what I think personally. In the second account I use the Delta Turning points and my own judgment to trade all of the market, but not necessarily at the same time!
I also have another system, called the DDS (Delta Directors System) that trades any and all commodities with only one parameter. (A parameter is a certain value or number that changes for every commodity.) This system has averaged over $50,000 a year in actual trading for the last 10 years. Nine out of the ten years were profitable. The one losing year was a loss of $5,000. The first quarter of the following year made over $20.000.”
(http://www.forexjournal.com.au/education/education/traders-interview/494-an-interview-with-j-welles-wilder)
There’s an account by Wilder here on the website that sells this system:
https://www.deltasociety.com/content/delta-story
I’ve had a google and many traders who have had a look at is feel it doesn’t work and it is some kind of marketing scam. However, Wilder has huge credibility so it might be worth considering. His book The Delta Phenomenon can be found on scribd.com
It would be interesting to here your take on this system John.
Great stuff Rob, thanks! I have long been aware of the delta phenomenon but because it was always payable I never bothered. But clearly that’s close to my research in many ways: the principle of the interaction of the sun and the moon with people and the markets. The ~4 year cycle (3.8 it looks like by his work) and the 19 year cycle I’ve shown exist on the Dow spectrogram. I will look into this when I get more time – post trip – but it’s going to depend what’s available for free about it on the net. I suspect that it’s going a largely similar angle to my own, but am interested in what extra bits he found out.
Rob,
In some circles Wells Wilder has a reputation of selling systems and even just technical indicators at prices that are orders of magnitude more than what they are actually worth. I believe the guy who used to head up Commodity Traders Consumer Reports (I think his name was Bruce Babcock) thought most of Wilder’s systems were scams.
Okay, next time I will do a little research before making a post like that. Everything I’m seeing on Wilder looks above board. I don’t see anything negative about him. The guy certainly had the knack for designing new indicators and systems.
I’ve always been suspicious of those ‘selling their secrets’ – if their systems are so good there are unlimited gains to be made in the market. But am sure there are genuines amongst the cowboys.
PS This guy seems to have done a robust check on the system and found it to have statistical significance:
http://dekalogblog.blogspot.com/2012/02/testing-delta-conclusion.html
Hi Rob,
I read the book several years back and found the thesis of the influence of lunar cycles to be fascinating. This was developed further by Steve Copan in his own Matrix system which tied in Fibonacci time and price projections with lunar phases. Found both systems elegant and complex, as much art as science though sadly never had the time to do them full justice.
An example of delta (or what purports to be delta – and certainly appears to obey the count rules) may be found here:
http://time-price-research-astrofin.blogspot.co.at/2013/01/delta-projection-tides-astro-events-jan.html
Note the big pink 5 giving an idea of long term top sometime in Summer, this in agreement with John’s suggestions.
Ron Rosen is a well known and long standing proponent of delta with regards to the precious metals.
Hope this is of some interest.
Very many thanks to all who post here – and of course sincere thanks to John for the clear and concise analysis. Very generous. Thank you!
Regards
Rufus
Thanks Rufus, that’s really helpful – some interesting links there to explore.
I just found a good summary of the Delta Phenomenon on that site here:
http://time-price-research-astrofin.blogspot.com/p/delta.html
Great input – and thanks Rufus
Hi Rob,
That’s an interesting site with some great math.
Did you see this page: http://dekalogblog.blogspot.com/2012/10/dominant-cycle-periods-in-end-of-day.html
The most common daily cycle is 18 days, closely followed by 19 days and 20 days. If we take into account weekends and holidays, then there are about 20 days in a lunar cycle.
That’s some nice evidence for the lunar cycle.
Yes he goes in really deep, a bit over my head to be honest ; )
Does he mean that tools such as RSI would be better set at 9 or 10 for trading daily charts? And does it have implications for which moving averages would work best on daily charts? I’m also confused by how the ‘lunar cycle’ could have 20 days – shouldn’t it be 28 days?!
Thanks for your blog btw – it has been good following your nasdaq lunar results, so please keep it up.
He describes how he filtered out all weekends and holidays, and then looked for dominant cycles in half a million daily data.
So basically the dominant cycle he found is 18 “trading days” ( not calendar days). The average lunar cycle has about 20 trading days, and sometimes 19 or 18 if there are holidays.
Indicators like RSI also work with trading days, so yes he advises to set it 9 or 10, instead of the default 14.
For moving averages one would then use simple multiples of 18 (so, 18, 36, 54 days…).
One of the problems with trying to use solar cycle peaks for timing is that the peak is not very clearly defined and often only declared a year after the fact.
For example, see http://www.swpc.noaa.gov/SolarCycle/
In the previous cycle the smoothed sunspot number peaked in March 2000, but the solar flux peaked in early 2002 (while the sunspots carved out a slightly lower second peak). We could have the same scenario now. Early 2012 may be left as the smoothed sunspot peak, while solar flux peaks in 2013 or 2014.
Basically solar cycles have a two to three year peaking period, and not a clearly defined peak.
That makes it difficult to use for market timing purposes.
Also notice how the current cycle continues to be much weaker than expected (red line), as was forecast by the late Theodor Landscheidt. Per his work the next cycle will be very weak as well.
I use the smoothed sunspot peak and it seems to work consistently looking back. Yes, there is a solar maximum period rather than a point, but the smoothed sunspot peak works for the market correlation history. Nasa’s smoothed sunspot peak is for Fall/Autumn 2013, Sibet’s Sept/Oct 2013, and SIDC’s also for then – however SIDC also are tracking the weakness to which you refer as a potential ‘already peaked’ alternative.
What I mean is that the solar peak is not easy to use because of the uncertainty around it.
When it is full moon we know it is full moon, no doubts.
When there is a smoothed sunspot peak early in the peaking period, then it may be the peak already but we won’t know for at least another year. If a smoothed sunspot peak is made towards the end of the peaking period, then we can be much more confident that it will likely stand as the peak.
And because the smoothed sunspot number is calculated on a 13 month filter, we only get it 6 to 7 months late anyway. So, the smoothed sunspot number for January 2013 will only be known by next July.
By the way, here is another interesting source, the Australian IPS site: http://www.ips.gov.au/Solar/1/6
They give monthly forecasts all the way to 2019. Their current projection is for a smoothed sunspot peak of 84.5 in next July. And it looks like the next solar minimum is already pushed out into 2020.
There is a mailing list that sends you their monthly updates.
Got you. And thanks for that additional forecast source – can’t have too many. Just finishing a new post considering the alternative of the solar peak that already occurred.
Chinese zodiac fire and water year of snake. Read more. Interesting parallel with Bradley dates, other important dates in trading history?
http://www.france24.com/en/20130207-asian-astrologers-warn-stormy-year-snake