
Mixed fortunes for pro-risk currently. Commodities, as a class, are still struggling to gain upward traction, although pockets have woken up in recent weeks, such as crude oil and iron ore, as China has displayed increasing evidence of a turnaround. However, the weakness in gold and softs has brought daily sentiment readings down to sub 10 for gold, soybean, soybean meal and oats, and sub 15 for corn, wheat, coffee and sugar (out of 100). I believe this extreme bearishness should provide a reversal in due course.
Treasury yields, on other hand, have made a move of some momentum, which adds weight to a potential bottoming mid-2012:
 Source: Stockcharts
Equities have been particularly strong since the fiscal cliff relief. The global stock index has broken out beyond its Q3 2012 high and is now within touching distance of new cyclical bull highs as shown:

Source: Bloomberg
Dow Transports have broken out. The Shanghai Composite has rocketed 18% over the last 4-5 weeks. The SP500 is just 10 points away from a new cyclical bull high. We do not see major negative divergence in internals or in leading/economic data so I believe global stocks can go on to make new highs. We have upward pressure into the new moon of the 11th January, and thereafter the rapid climbs in the Nikkei and Shanghai may need to digest.
The combined global manufacturing and services PMI composite looks like this – a notable improvement in Q4 2012. It is not clear however whether this is just another oscilliation in the downward trend in place the last 3 years that will roll over again shortly.

Source: Markit
Narrow money as a leading indicator currently suggests improvement in the global economy into February and then a peak out.
Source: MoneyMovesMarkets
Citigroup economic surprises may be topping out in the US, as this index has made a rounded head over the last couple of months, in a high zone historically associated with turnarounds (and this is a mean-reverting indicator as economic data or analyst expectations eventually shift). Here’s a reminder of what happened to stocks when economic surprises (blue line) topped the last two times:
 Equities were on borrowed time, though in both cases there were several months in which to sell.
Cyclicals as a leading indicator suggest a top by March 2013:
 Source: PFS Group
Lastly, Eurodollar COT as a leading indicator suggests a top right here, or if not a topping process beginning here and lasting until June (second high on negative divergence would be the norm):

Source: Nowandfutures
All combined, we may be looking at a top in equities in Q1 2013, but as yet there is a lack of the usual topping indicators, so I am sitting tight for further gains until more data evidence comes to light to support the time predictions.
I completed Thailand with Phitsanulok and Hua Hun and am now in Borneo, starting with 4 nights in Kuching.

The market just hit a 5 year high. That usually indicates a beginning rise in interest rates. When interest rates hit a 15 month high in both short and long term rates, the end is indeed nigh! See Strategic Investment Timing by Stoken.
Are commodities in a bull or a bear market? After falling for a year from Apr 2011 to Apr 2012, the Crb has rallied and looks pretty good sitting on 50 and 200 day moving averages. If it’s a bear market, it should break down from here.
We are in solar cycle 24. We are in month 48, almost all cycles have peaked by month 48. 24’s high was in momth @ 36, a fairly normal high point. That would mean we could be over a year from the peak! Making 2008 and 2011 the top it felt like.
I am curious as to what PM’s will do after this cycle. Will they stair step up or will they go dormant for another 33 years?
Anthony by history they should track overall sideways for 2 decades at a permanently ratcheted higher level. But the wild cards are resource and fossil fuel exhaustion and debt growth, namely if either escalate out of control. I maintain that growth will not until the next cycle starting 2 decades hence, and I expect exponential tech evolution to contain the resource situation, but no guarantees, we shall see.
It’s interesting Kent that 12 months on we still don’t have a definitive on whether commodities topped in 2011, as per your call. I maintain it’s a matter of time before a new CCI high but it is proving an extended teaser.
Has anyone noticed that corn, wheat, and soybeans appear to be in long term parabolic up moves? That would make one more leg up for commodities come true.
What’s interesting about the stocks bull market since 2009 is that it’s been steadily climbing during a period of great fear. It’s been climbing a wall of worry, and definitely seems unlike any major rallies we’ve seen before. 1975’s stock rally came from low interest rates, but by 1980, interest rate hikes had left equities stagnant, before the shock 1982 blast off.
My guess is that stocks would undergo a major correction, only if interest rates had been raised or as a result of some unforeseen catastrophe. People feel unsure about the health of this stocks bull, based on the fact that it’s lasted so long. Loose monetary policy, which has persisted to the present day has kept stocks healthy. We can’t compare the length with other bulls with this one because this bull market is unlike any other that has come before it.
The bull market has been impressive, given money has also been in commodities and treasuries since 2009, but PMs have been stagnant, treasury bonds have topped out, and so an impressive rally since 2009 could easily turn into a full blown long-lasting secular bull for stocks.
Which is why ‘average’ length of a stocks bull isn’t a great predictor. I suggest the evironment for equities (rates, inflation, x-asset ratios, yield curve and so on) and the common cyclical bull topping indicators are more important.
Hi John,
It’s interesting that the 45 Year Cycle is another indicator that we may be at or near a topping point with a low into March 2013. Also, the first year of the presidential cycle (2013) may not be a good year for stocks.
Jack
Thanks Jack – can you point me at a 45 year cycle source?
The 45 year Cycle matches the dates for tops and bottoms and some kind of trend, last year from oct12 to nowdays it reply +-, it´s curious. You can see in the sp500 or Dow. Now it point out a drop until feb-march13, but ist is not perfect, anyway.
Regards
John, try this link:
http://time-price-research-astrofin.blogspot.ca/2012/11/45-year-cycle.html
Thanks, and interesting. Will say something about that in the next post.
John,
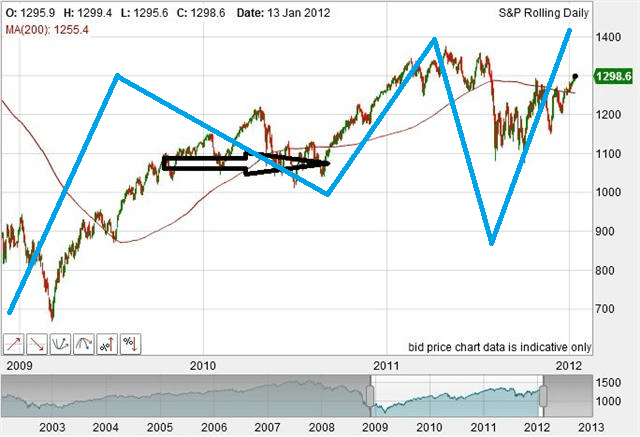
Here is something interesting concerning the TPDH pattern mentioned in Brent’s post about the 45 year cycle. It could be my imagination but it appears that the S&P begins to trace the three peaks and a dome pattern from the March 1968 bottom. So if there is a 45 year correlation between the S&P in 1968 and the S&P in 2013 then it could be possible that point number 1 in the TPDH pattern might start at the next low in the S&P (March?).
Jack